The identical charged-kaon correlations induced by quantum-statistics effects and final-state interactions are measured in Pb$-$Pb collisions at $\sqrt{s_{\rm NN}} = 5.02$ TeV. The results of one- (1D) and three-dimensional (3D) analyses show that the obtained system-size parameters (radii) are smaller for more peripheral collisions and decrease with increasing pair transverse momentum $k_{\rm T}$. The 1D parameters agree within uncertainties with those obtained in Pb$-$Pb collisions at $\sqrt{s_{\rm NN}}=2.76$ TeV. The observed power-law dependence of the extracted 3D radii as a function of the pair transverse momentum is a signature of the collective flow in the particle-emitting system created in Pb$-$Pb collisions. This dependence is well reproduced by the integrated hydrokinetic model calculations except for the outward projection of the radius (measured in the longitudinally co-moving system) for the most central collisions. The time of maximal emission for kaons is extracted from the 3D analysis in a wide collision centrality range from 0 to 90%. Its reduction with decreasing charged-particle multiplicity is well reproduced by the hydrokinetic model predictions, and means that kaons are emitted earlier in more peripheral events.
Submitted to: PRC
e-Print: arXiv:2601.15054 | PDF | inSPIRE
CERN-EP-2025-236
Figure group
Figure 1
1D experimental CFs before (empty markers) and after (solid markers) the momentum resolution (MR) correction given by Eq.(1) for the 0-5% (top), 30-40% (middle), and 70-90% (bottom) centrality classes. Only CFs in the $k_\mathrm{T}$ [0.2, 0.4] GeV$/c$ (top and middle panels) and [0.2, 0.5] GeV$/c$ (bottom panel) ranges are presented. | 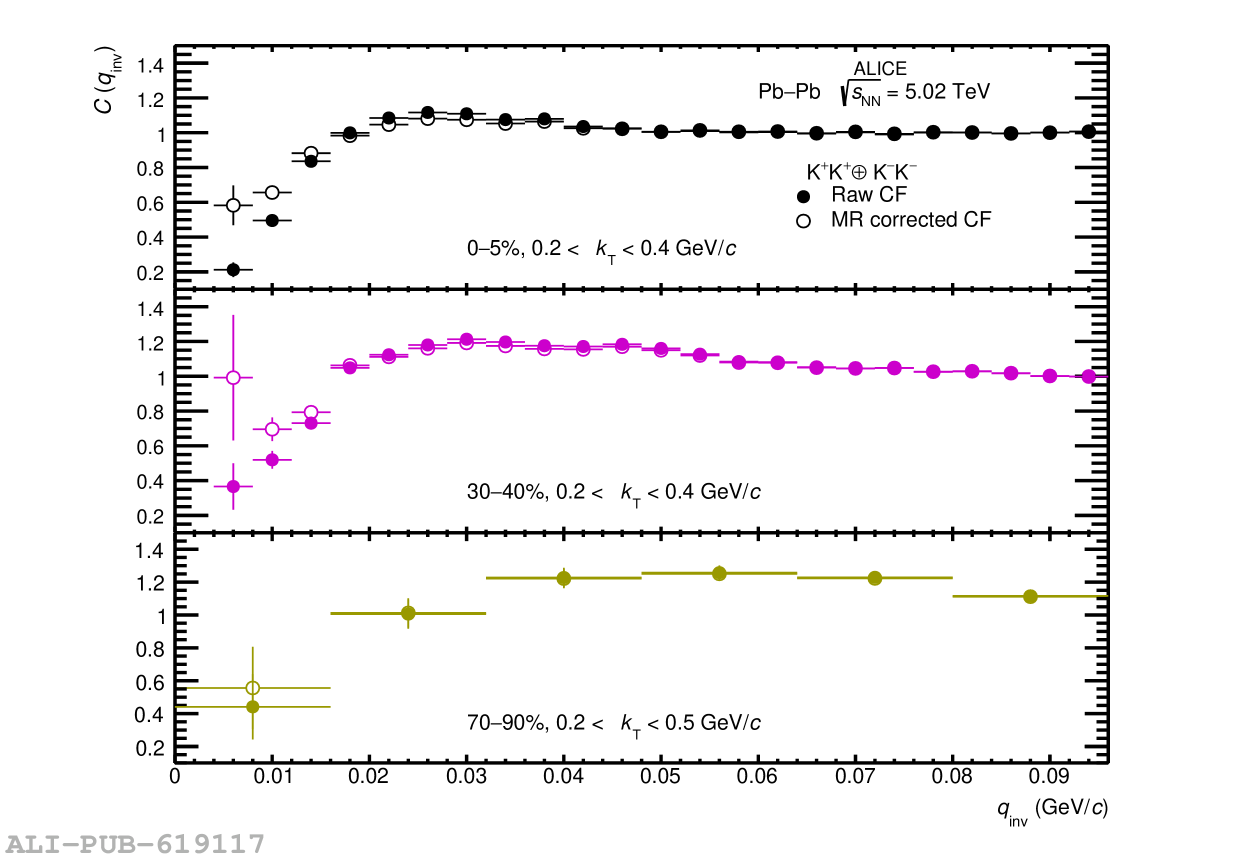 |
Figure 2
1D K$^{\pm}$K$^{\pm}$ correlation functions (black markers) for four $k_\mathrm{\rm T}$ ranges and for the 0-5% centrality class, fitted with Eq.(3) (red bands). The CFs are normalized to unity in $0.1< q_{\rm inv}< 0.5$ GeV/$c$ statistical uncertainties are shown as bars and systematic boxes. The width of red bands represents the uncertainties of the Eq. (3) fit. | 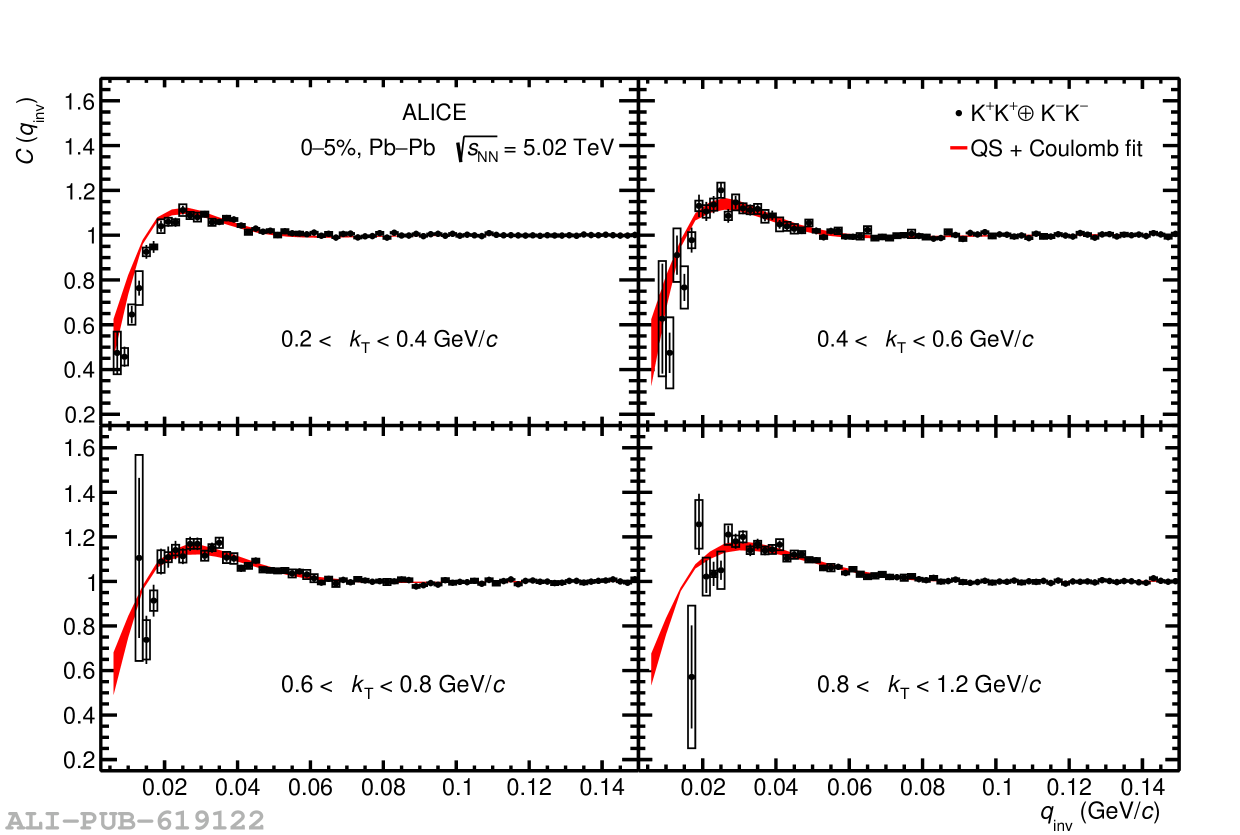 |
Figure 3
3D K$^{\pm}$K$^{\pm}$ correlation functions (black markers) in projections onto the $q_\mathrm{out}$ (left column), $q_\mathrm{side}$ (middle column), and $q_\mathrm{long}$ (right column) axes for four $k_\mathrm{\rm T}$ ranges fitted with Eq.(6) (red lines). To project onto $q_\mathrm{i}$ (i$=$out, side, long) component, the others are integrated over the range $|q_\mathrm{i}| < 0.04$ GeV$/c$ to illustrate the femtoscopic effect for the corresponding axis. Statistical uncertainties are shown by bars, and systematic uncertainties are smaller than the markers. | 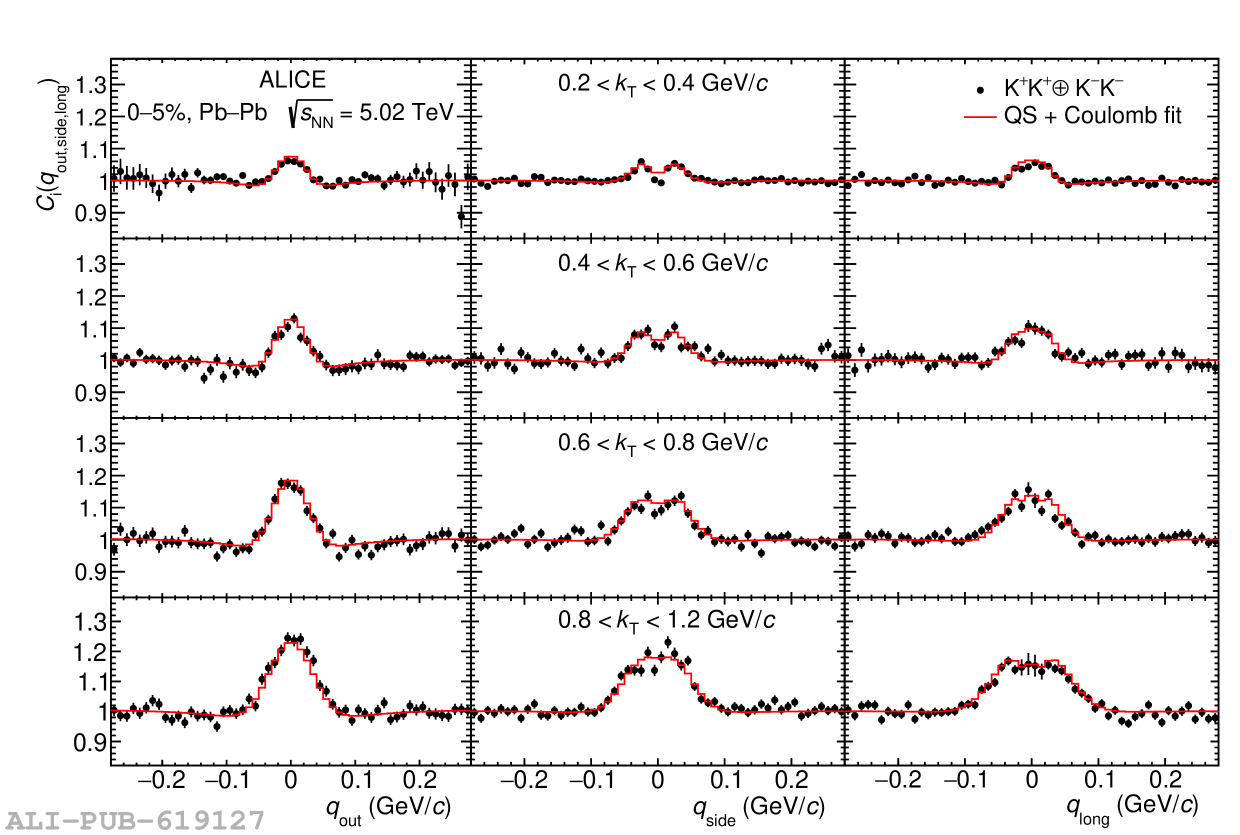 |
Figure 4
1D radii (left) and $\lambda$ parameters (right) as a function of the pair transverse momentum $k_\mathrm{T}$. Statistical uncertainties are shown as bars and systematic uncertainties are depicted as boxes. Points for the 5-10%, 10-20%, 20-30%, 30-40% (50-70%, 70-90%) centrality classes are slightly shifted with respect to the 0-5% (40-50%) centrality class in the $x$ axis direction for clarity. | 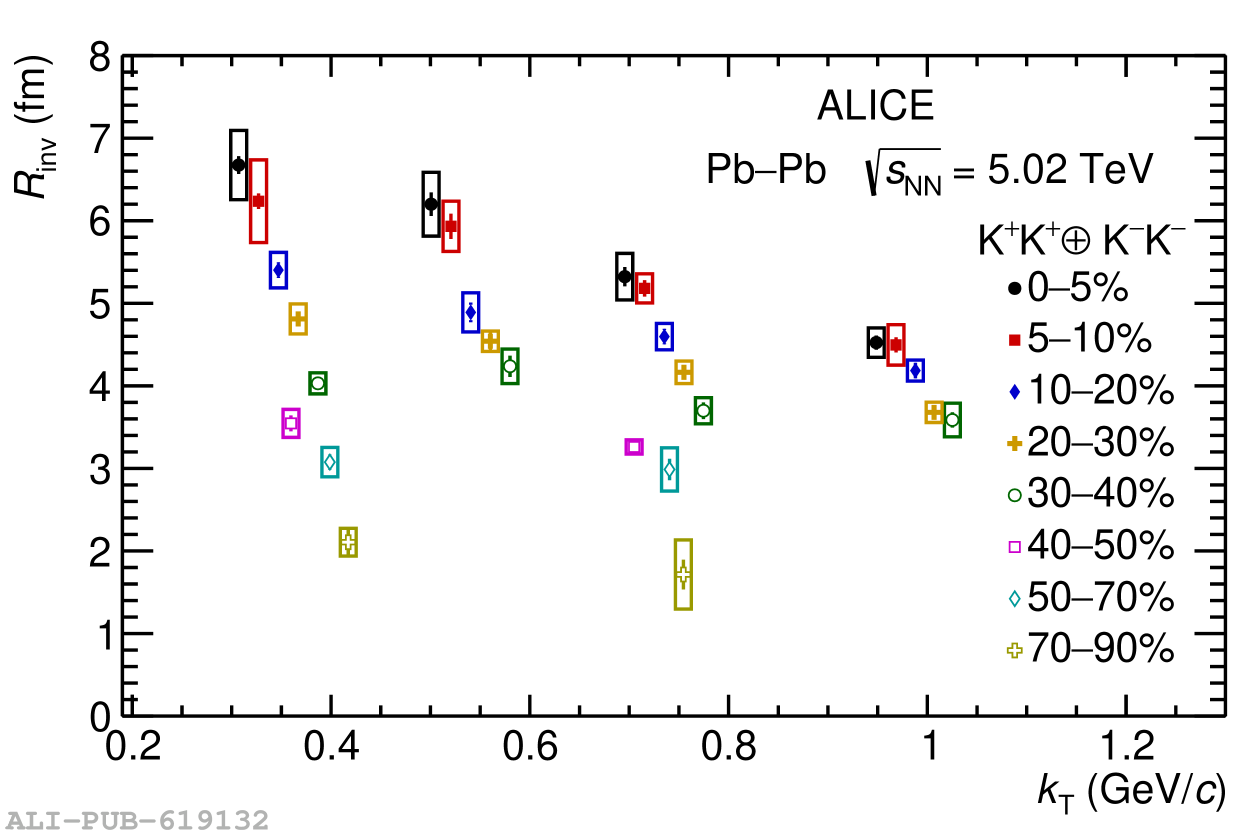 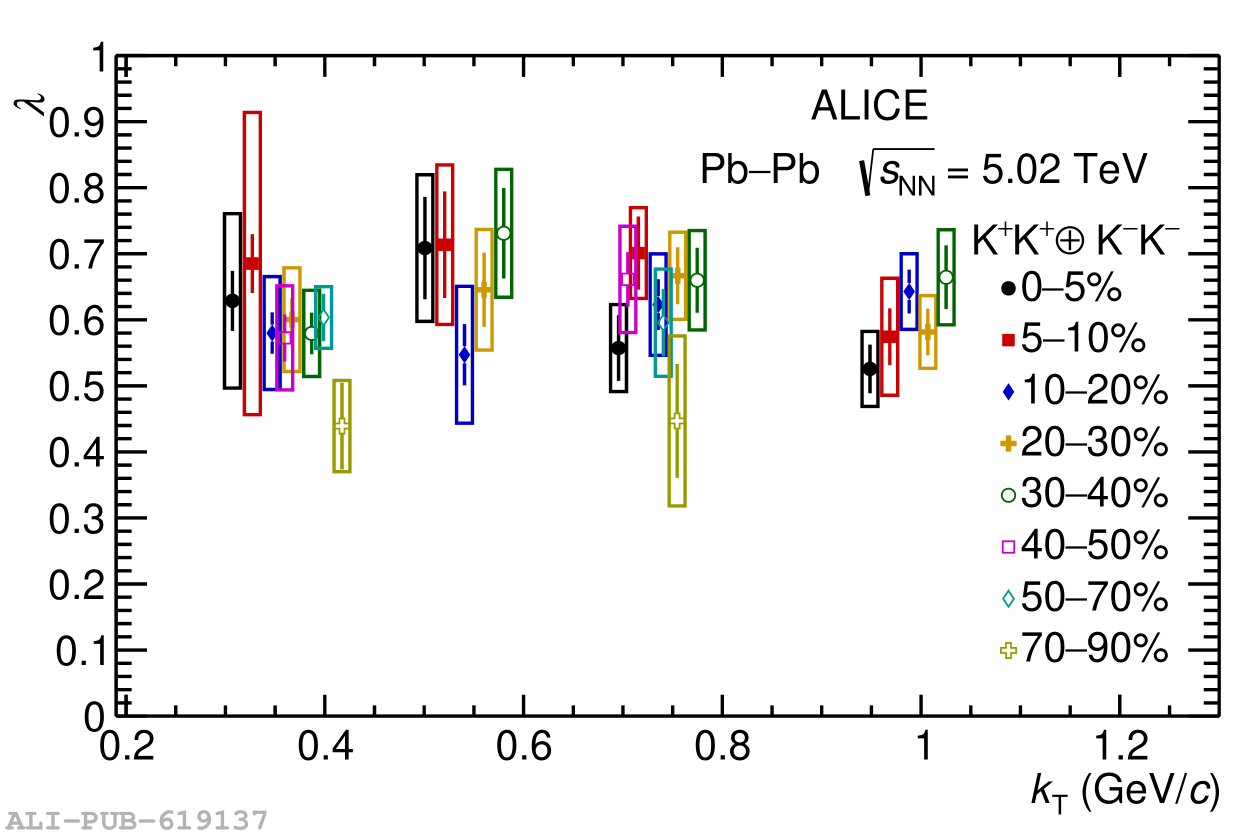 |
Figure 5
1D radii (left) and $\lambda$ parameters (right) as a function of the cube root of the charged-particle multiplicity density $\langle {\rm d}N_{\rm ch}/{\rm d}\eta \rangle^{1/3}$ in the low $k_\mathrm{T}$ range compared with results obtained in Pb$-$Pb collisions at $\sqrt{s_{\rm NN}} = 2.76$ TeV. Statistical uncertainties are shown as bars, and systematic uncertainties are shown as boxes. | 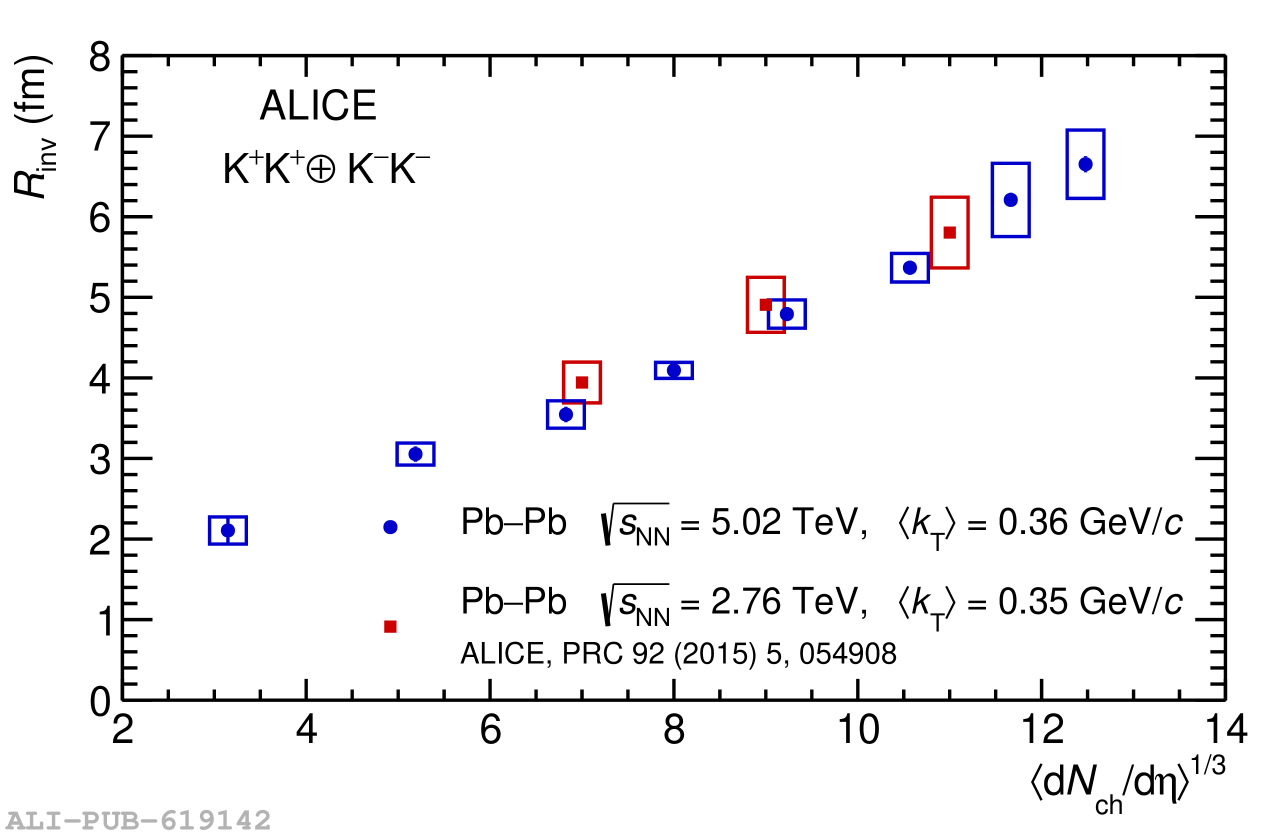 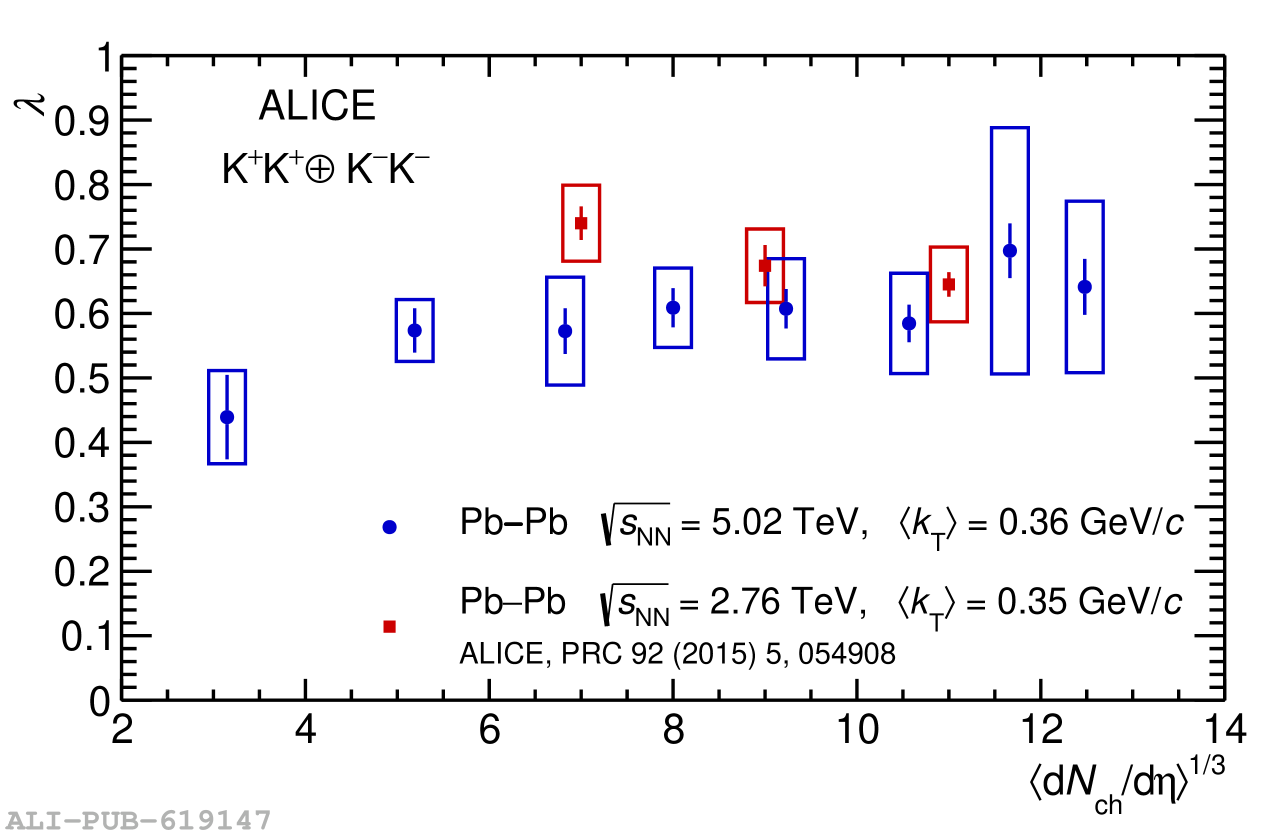 |
Figure 6
1D radii (left) and $\lambda$ parameters (right) as a function of the cube root of the charged-particle multiplicity density $\langle {\rm d}N_{\rm ch}/{\rm d}\eta \rangle^{1/3}$ in the high $k_\mathrm{T}$ range compared with results obtained in Pb$-$Pb collisions at $\sqrt{s_{\rm NN}} = 2.76$ TeV. Statistical uncertainties are shown as bars, and systematic uncertainties are shown as boxes. | 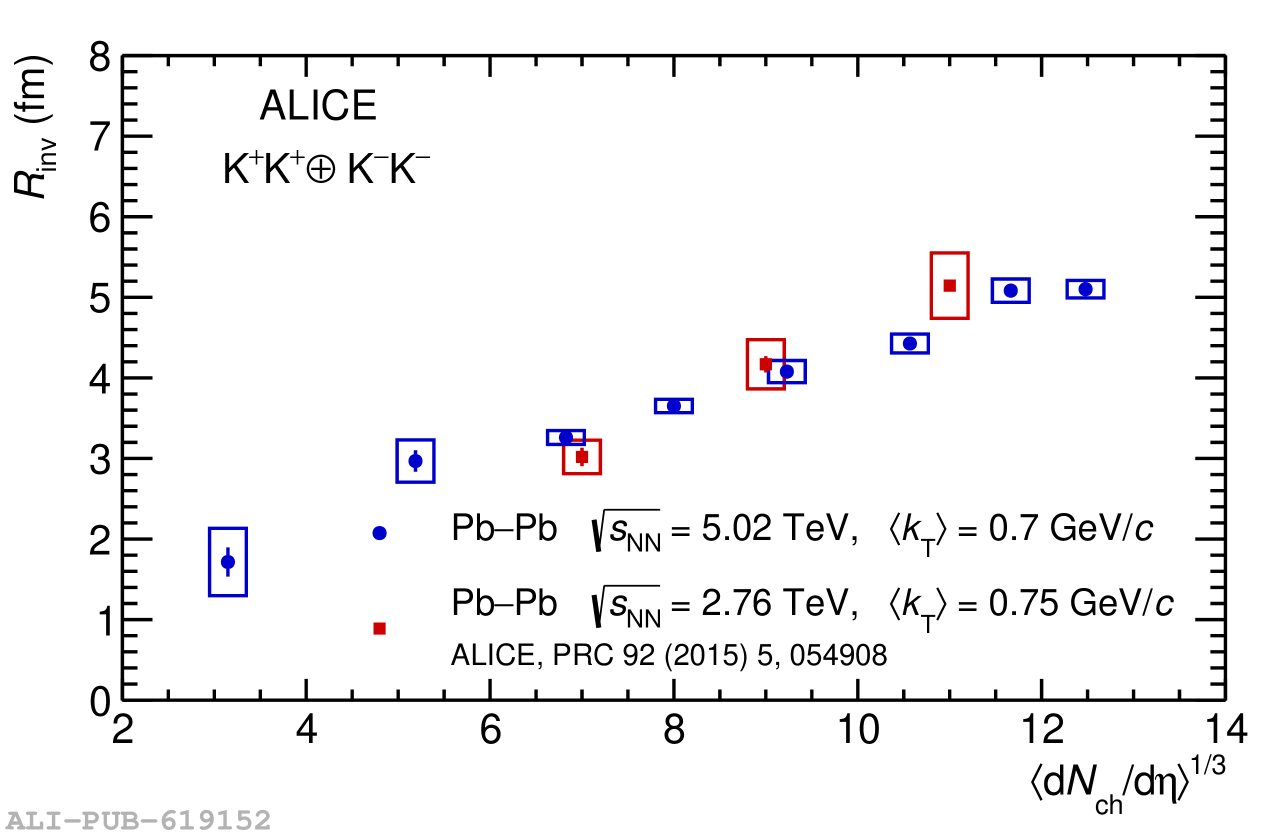 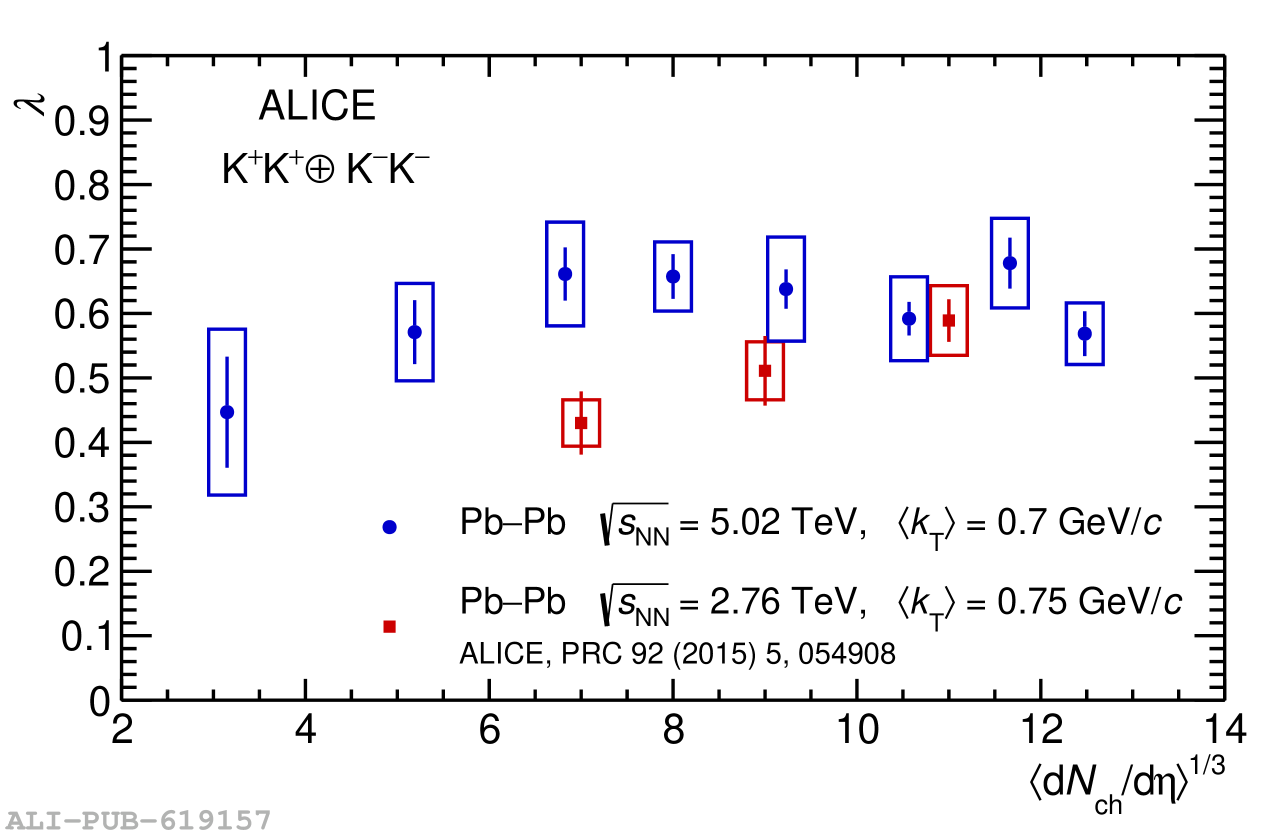 |
Figure 7
K$^{\pm}$K$^{\pm}$ 3D radii and $\lambda$ parameters as a function of the pair transverse mass $m_\mathrm{T}$ fitted with a power-law function $R_\mathrm{out, side, long}(m_\mathrm{T}) = a \cdot m_\mathrm{T}^b$. Points for the 5-10%, 20-30%, and 50-70% centrality classes are slightly shifted in the $x$ direction for clarity. Statistical uncertainties of the experimental points are shown with bars, and systematic uncertainties are depicted with boxes. The width of the bands represents the uncertainties of the power-law fit. | 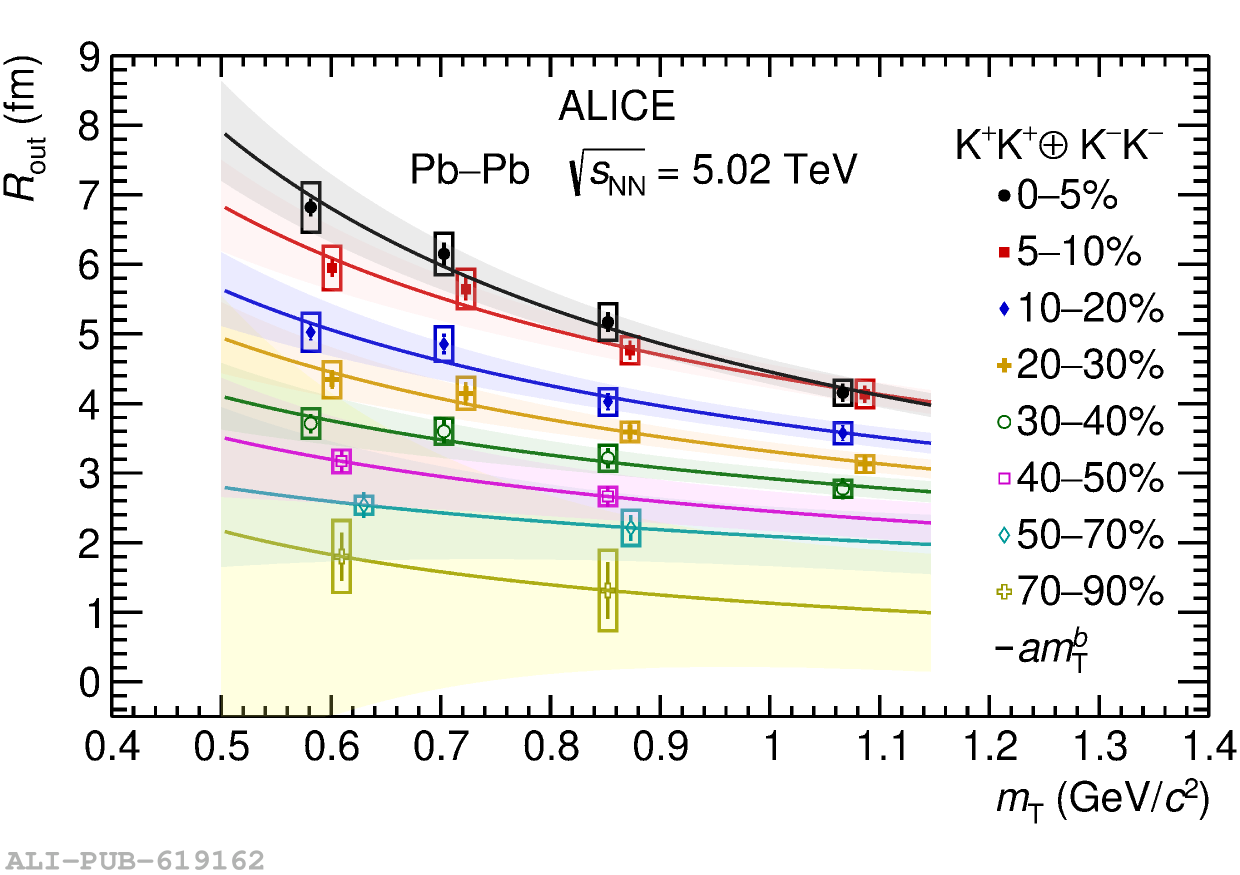 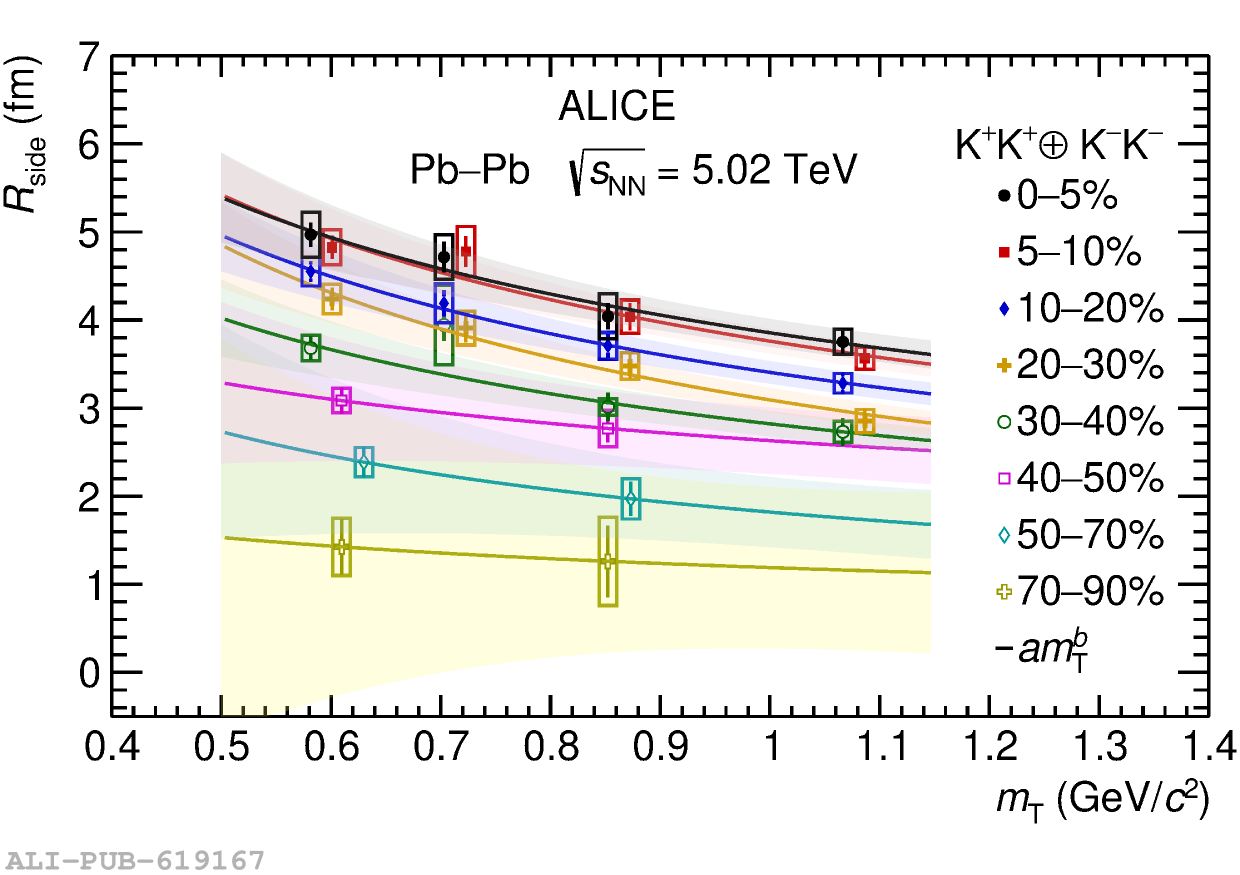 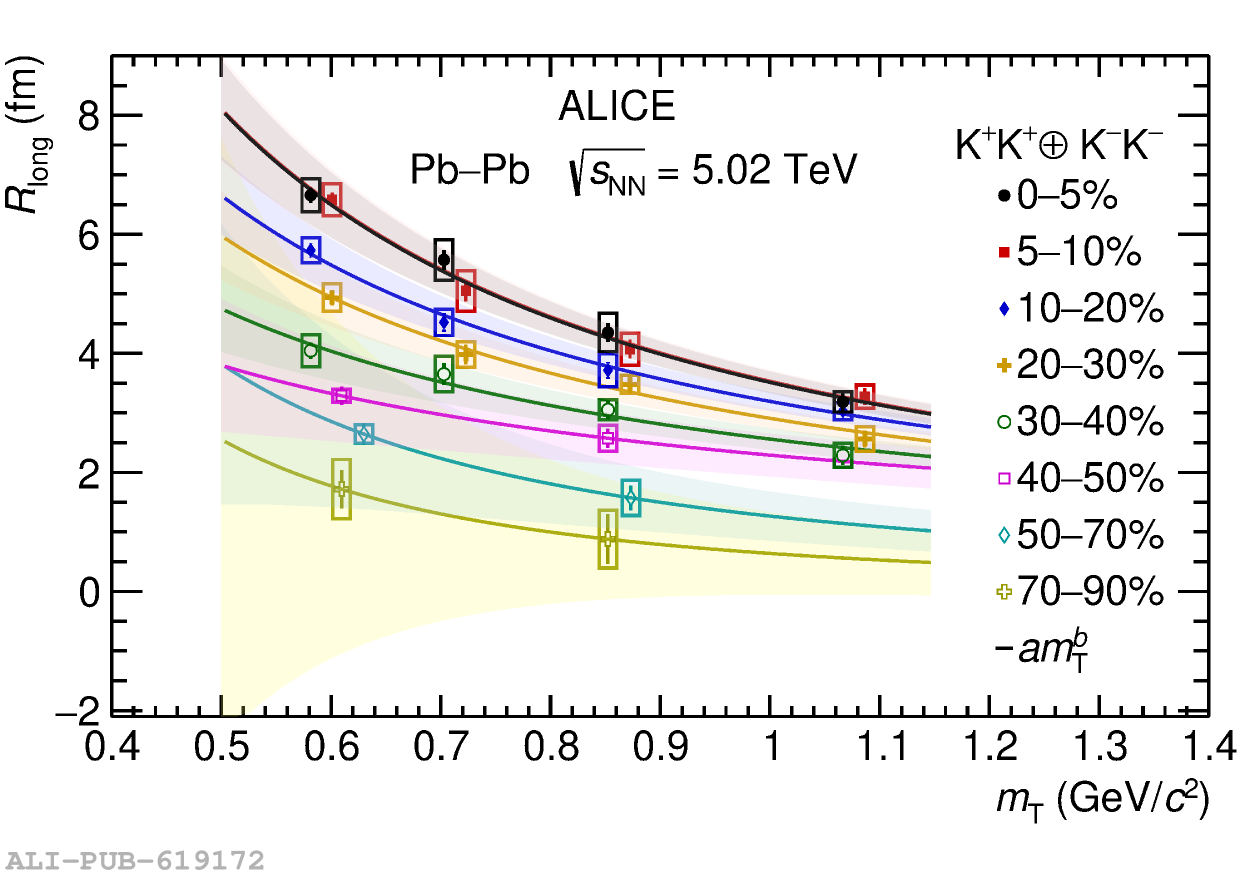 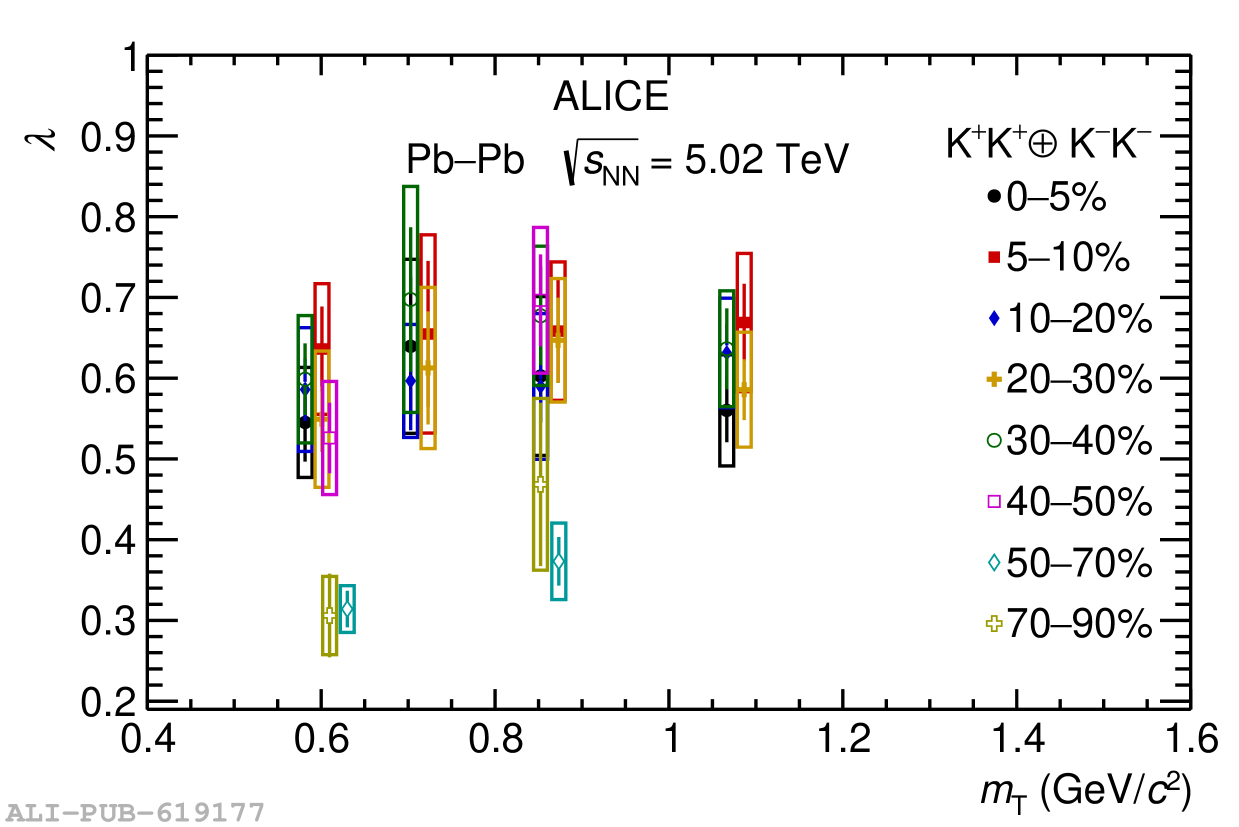 |
Figure 8
Experimental 3D radii (markers) as a function of the pair transverse momentum $k_\mathrm{T}$ compared with iHKM calculations (lines) for the 0-5%, 20-30%, and 40-50% centrality classes. Statistical uncertainties of the experimental points are shown with bars and systematic uncertainties are depicted with boxes. The solid line presents the calculations with the particlization temperature $T_{\rm p}=165$ MeV and the dotted line corresponds to the temperature $T_{\rm p}=156$ MeV. | 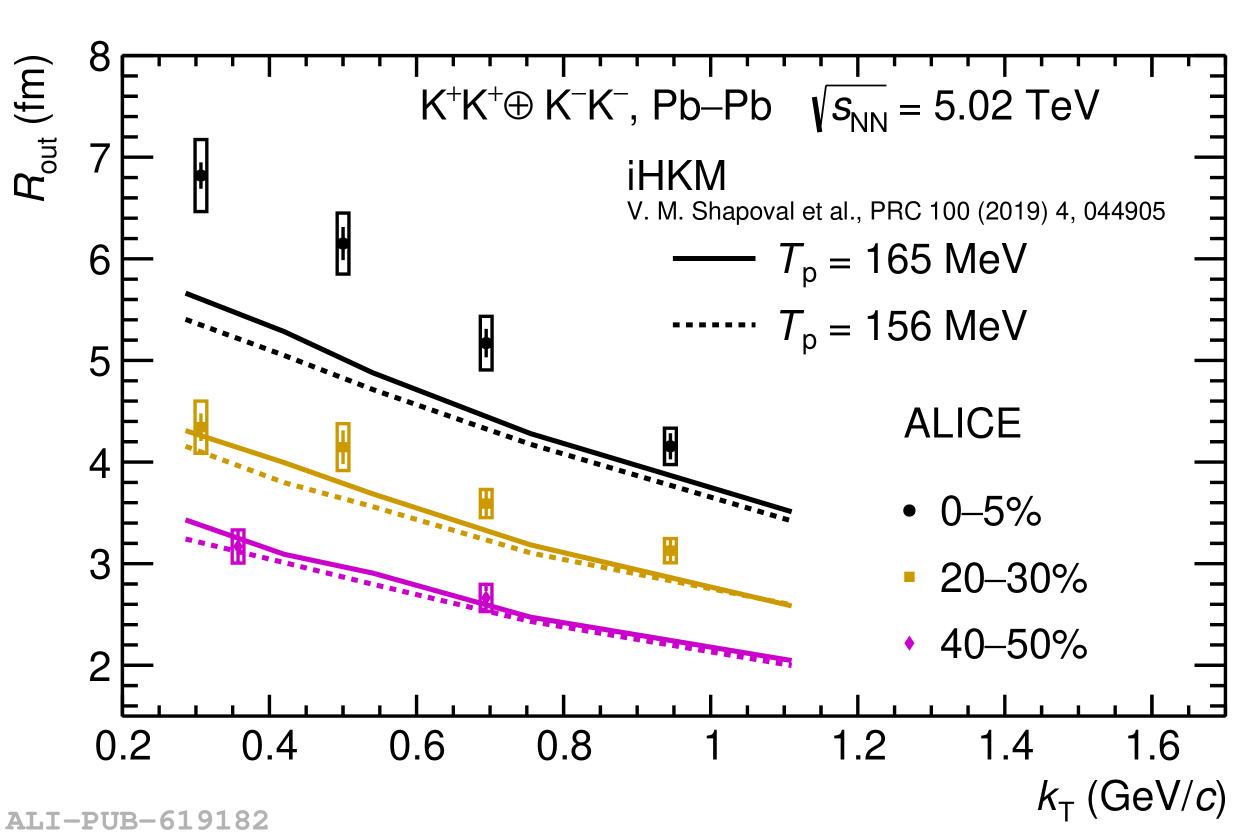 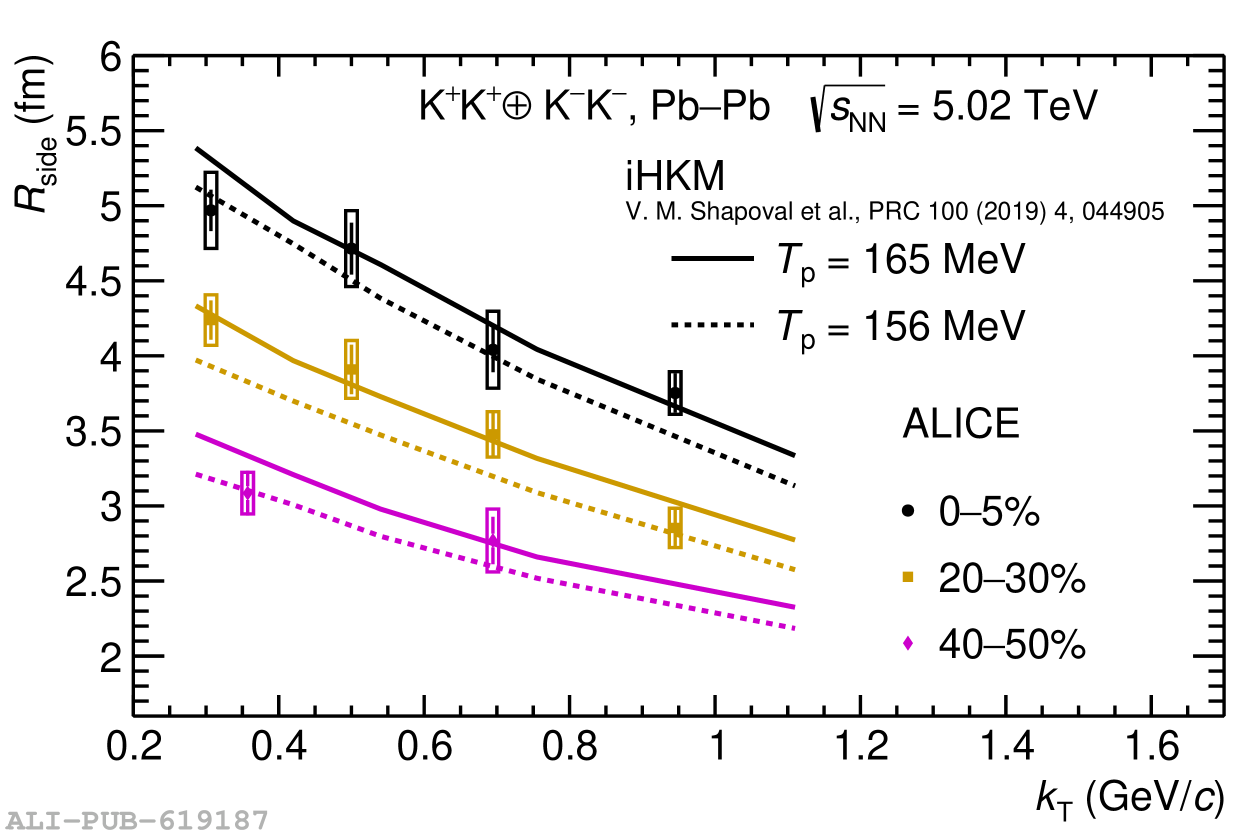 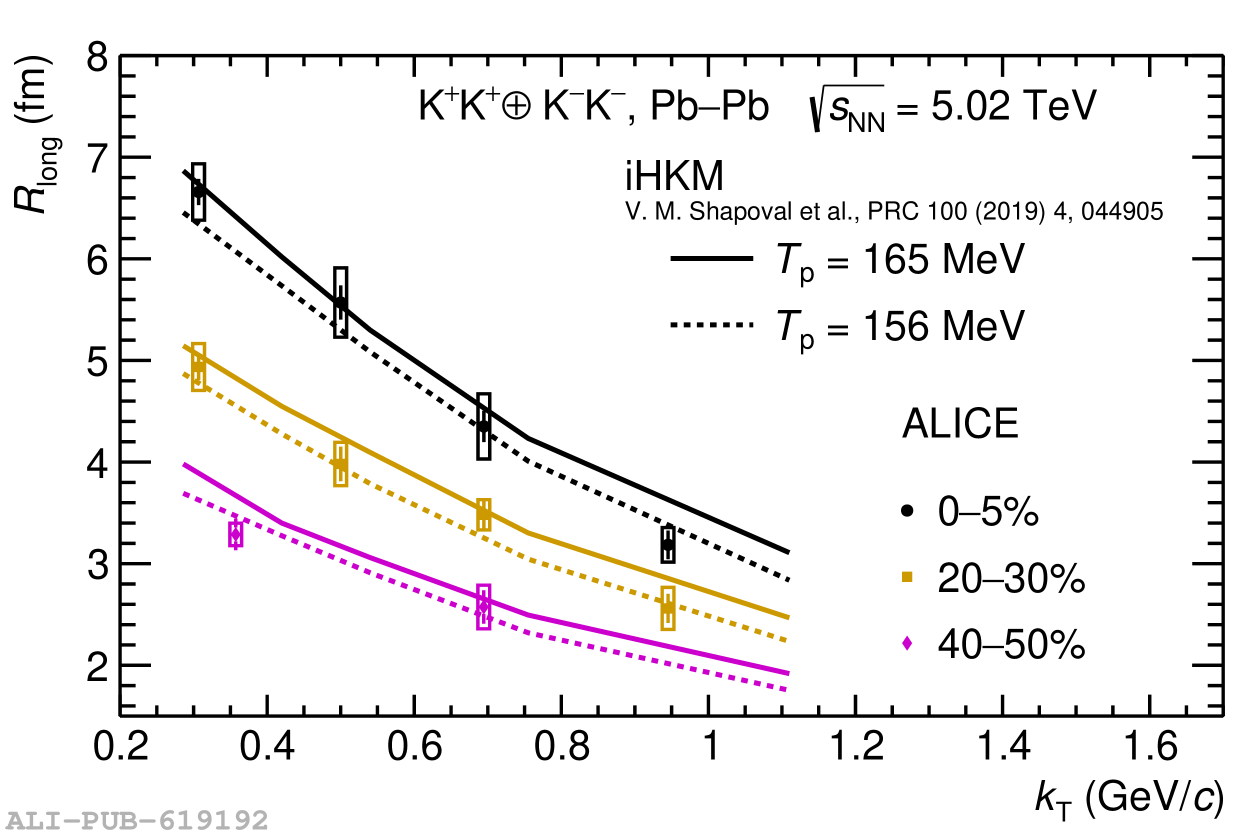 |
Figure 9
Maximal emission temperature $T$ for charged kaons in Pb$-$Pb collisions at $\sqrt{s_{\rm NN}}=5.02$ TeV as a function of the cube root of the charged-particle multiplicity density $\langle {\rm d}N_{\rm ch}/{\rm d}\eta\rangle^{1/3}$ Statistical uncertainties are shown as bars and systematic uncertainties are depicted as boxes. | 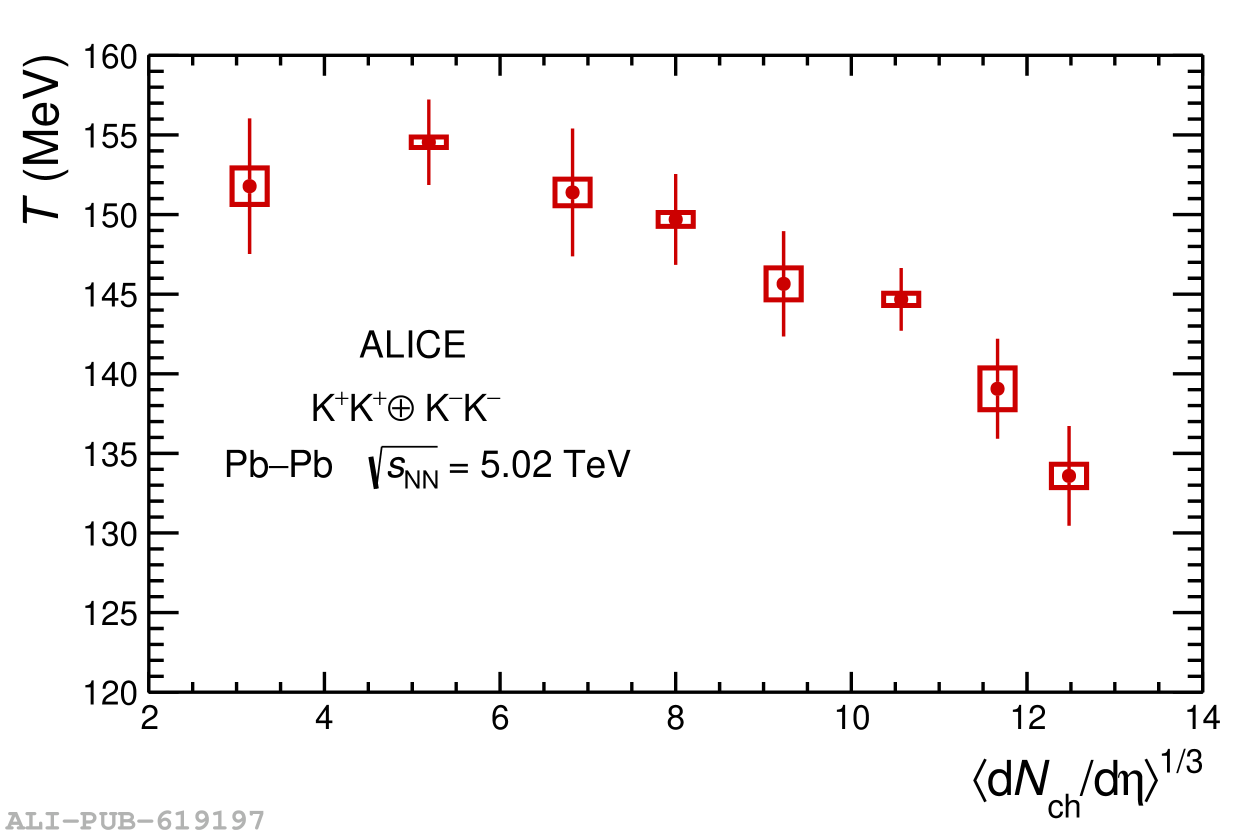 |
Figure 10
$R_\mathrm{long}^2$ fitted with Eq.(10) for eight centrality classes: 0-5%, 5-10%, 10-20%, 20-30%, 30-40%, 40-50%, 50-70%, and 70-90%. Statistical uncertainties are shown as bars and systematic uncertainties are depicted as boxes. The width of the bands represents the uncertainties of the power-law fit. | 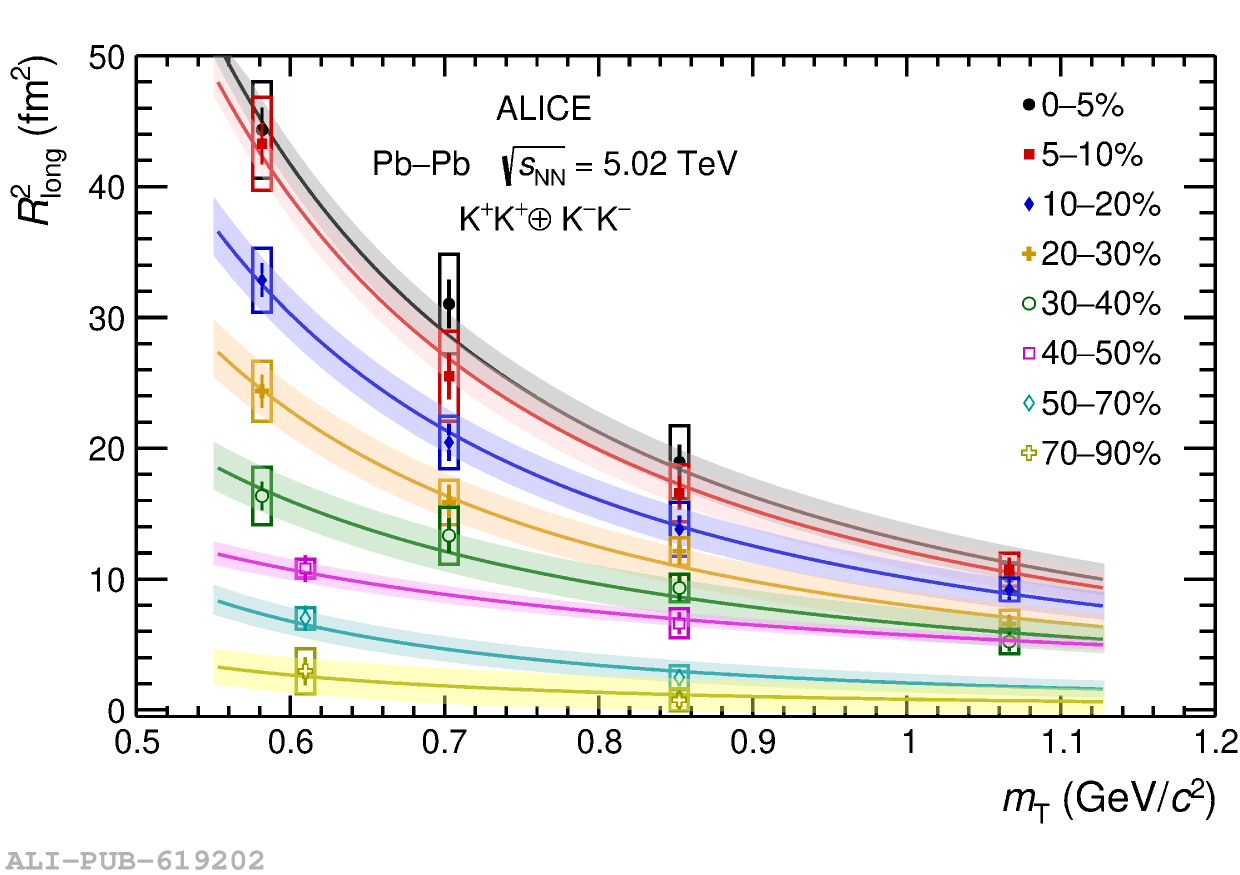 |
Figure 11
Time of maximal emission $\tau_{\rm K}$ for charged kaons in Pb--Pb collisions at $\sqrt{s_{\rm NN}}=5.02$ TeV compared with the iHKM calculations and the result of the K$^\pm$K$^\pm$ analysis in Pb$-$Pb collisions at $\sqrt{s_{\rm NN}}=2.76$ TeV. Statistical uncertainties are shown as bars and systematic uncertainties are depicted as boxes. | 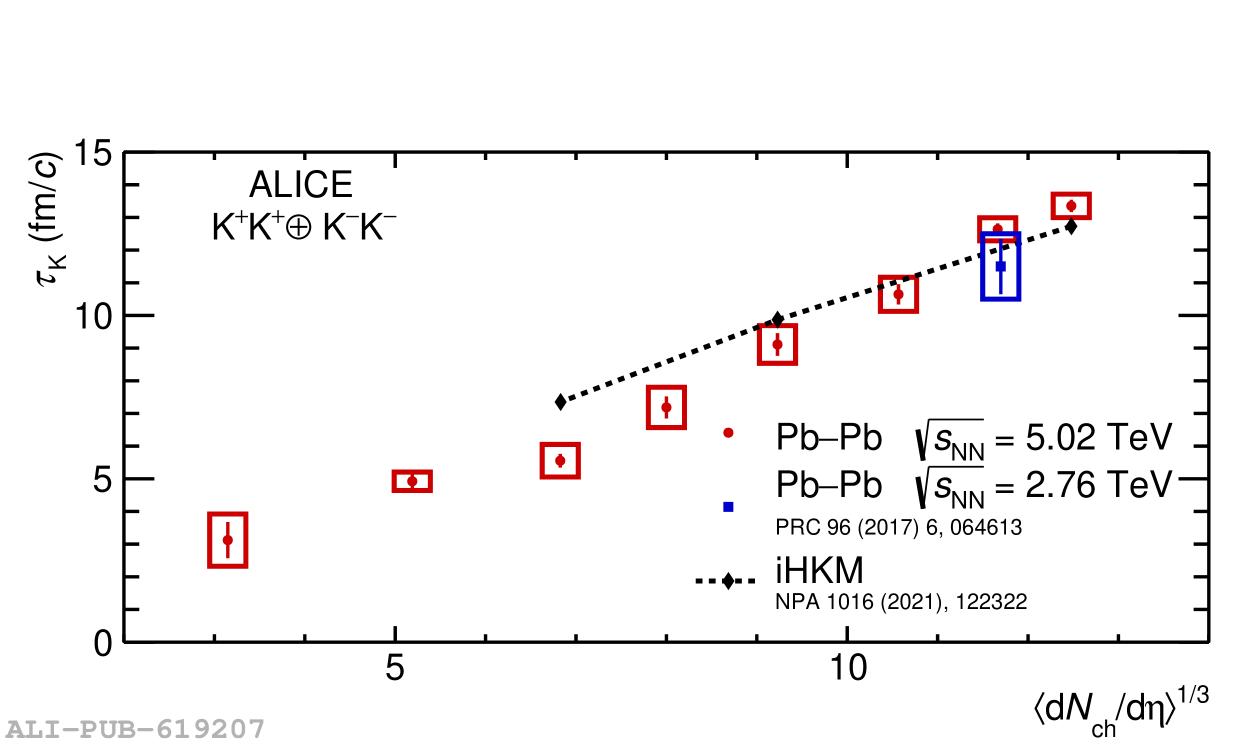 |