The transverse momentum spectra and integrated yields of anti-$Σ$ hyperons ($\overlineΣ^{\pm}$) have been measured in pp and p-Pb collisions at $\sqrt{s_{\mathrm{NN}}}=5.02$ TeV with the ALICE experiment. Measurements are performed via the newly accessed decay channel $\overlineΣ^{\pm} \rightarrow {\rm\overline{n}}π^{\pm}$. A new method of antineutron reconstruction with the PHOS electromagnetic spectrometer is developed and applied to this analysis. The $p_{\rm T}$ spectra of $\overlineΣ^{\pm}$ are measured in the range $0.5 <~ p_{\rm T} <~ 3$ GeV/$c$ and compared to predictions of the PYTHIA 8, DPMJET, PHOJET, EPOS LHC and EPOS4 models. The EPOS LHC and EPOS4 models provide the best descriptions of the measured spectra both in pp and p-Pb collisions, while models which do not account for multiparton interactions provide a considerably worse description at high $p_{\rm T}$. The total yields of $\overlineΣ^{\pm}$ in both pp and p-Pb collisions are compared to predictions of the Thermal-FIST model and dynamical models PYTHIA 8, DPMJET, PHOJET, EPOS LHC and EPOS4. All models reproduce the total yields in both colliding systems within uncertainties. The nuclear modification factors $R_\mathrm{pPb}$ for both $\overlineΣ^{+}$ and $\overlineΣ^{-}$ are evaluated and compared to those of protons, $Λ$ and $Ξ$ hyperons, and predictions of EPOS LHC and EPOS4 models. No deviations of $R_\mathrm{pPb}$ for $\overlineΣ^{\pm}$ from the model predictions or measurements for other hadrons are found within uncertainties.
Eur. Phys. J. C (2026) 86:132
HEP Data
e-Print: arXiv:2507.13183 | PDF | inSPIRE
CERN-EP-2025-151
Figure group
Figure 3
Decay topology of the $\overline{\Sigma}^{\pm} \to {\rm \overline{n}} \pi^\pm$ decay. In the reconstruction procedure, the direction of the ${\rm \overline{n}}$ momentum is approximated by the vector pointing from the the PV to the cluster in the PHOS. DCA of $\pi^\pm$ is not used in the analysis. |  |
Figure 4
Same event, mixed event, signal from data, and MC true signal invariant mass distributions of ${\rm \overline{n}}\pi^+$ (top row) and ${\rm \overline{n}}\pi^-$ (bottom row) pairs in pp (left column) and p--Pb (right column) collisions for two selected $p_{\rm{T}}$ bins. Solid and dashed vertical lines represent integration ranges at 1/4 and 1/3 of the maximum, respectively. The PYTHIA 8 and DPMJET 3.0-5 event generators were used for Monte-Carlo simulations. | 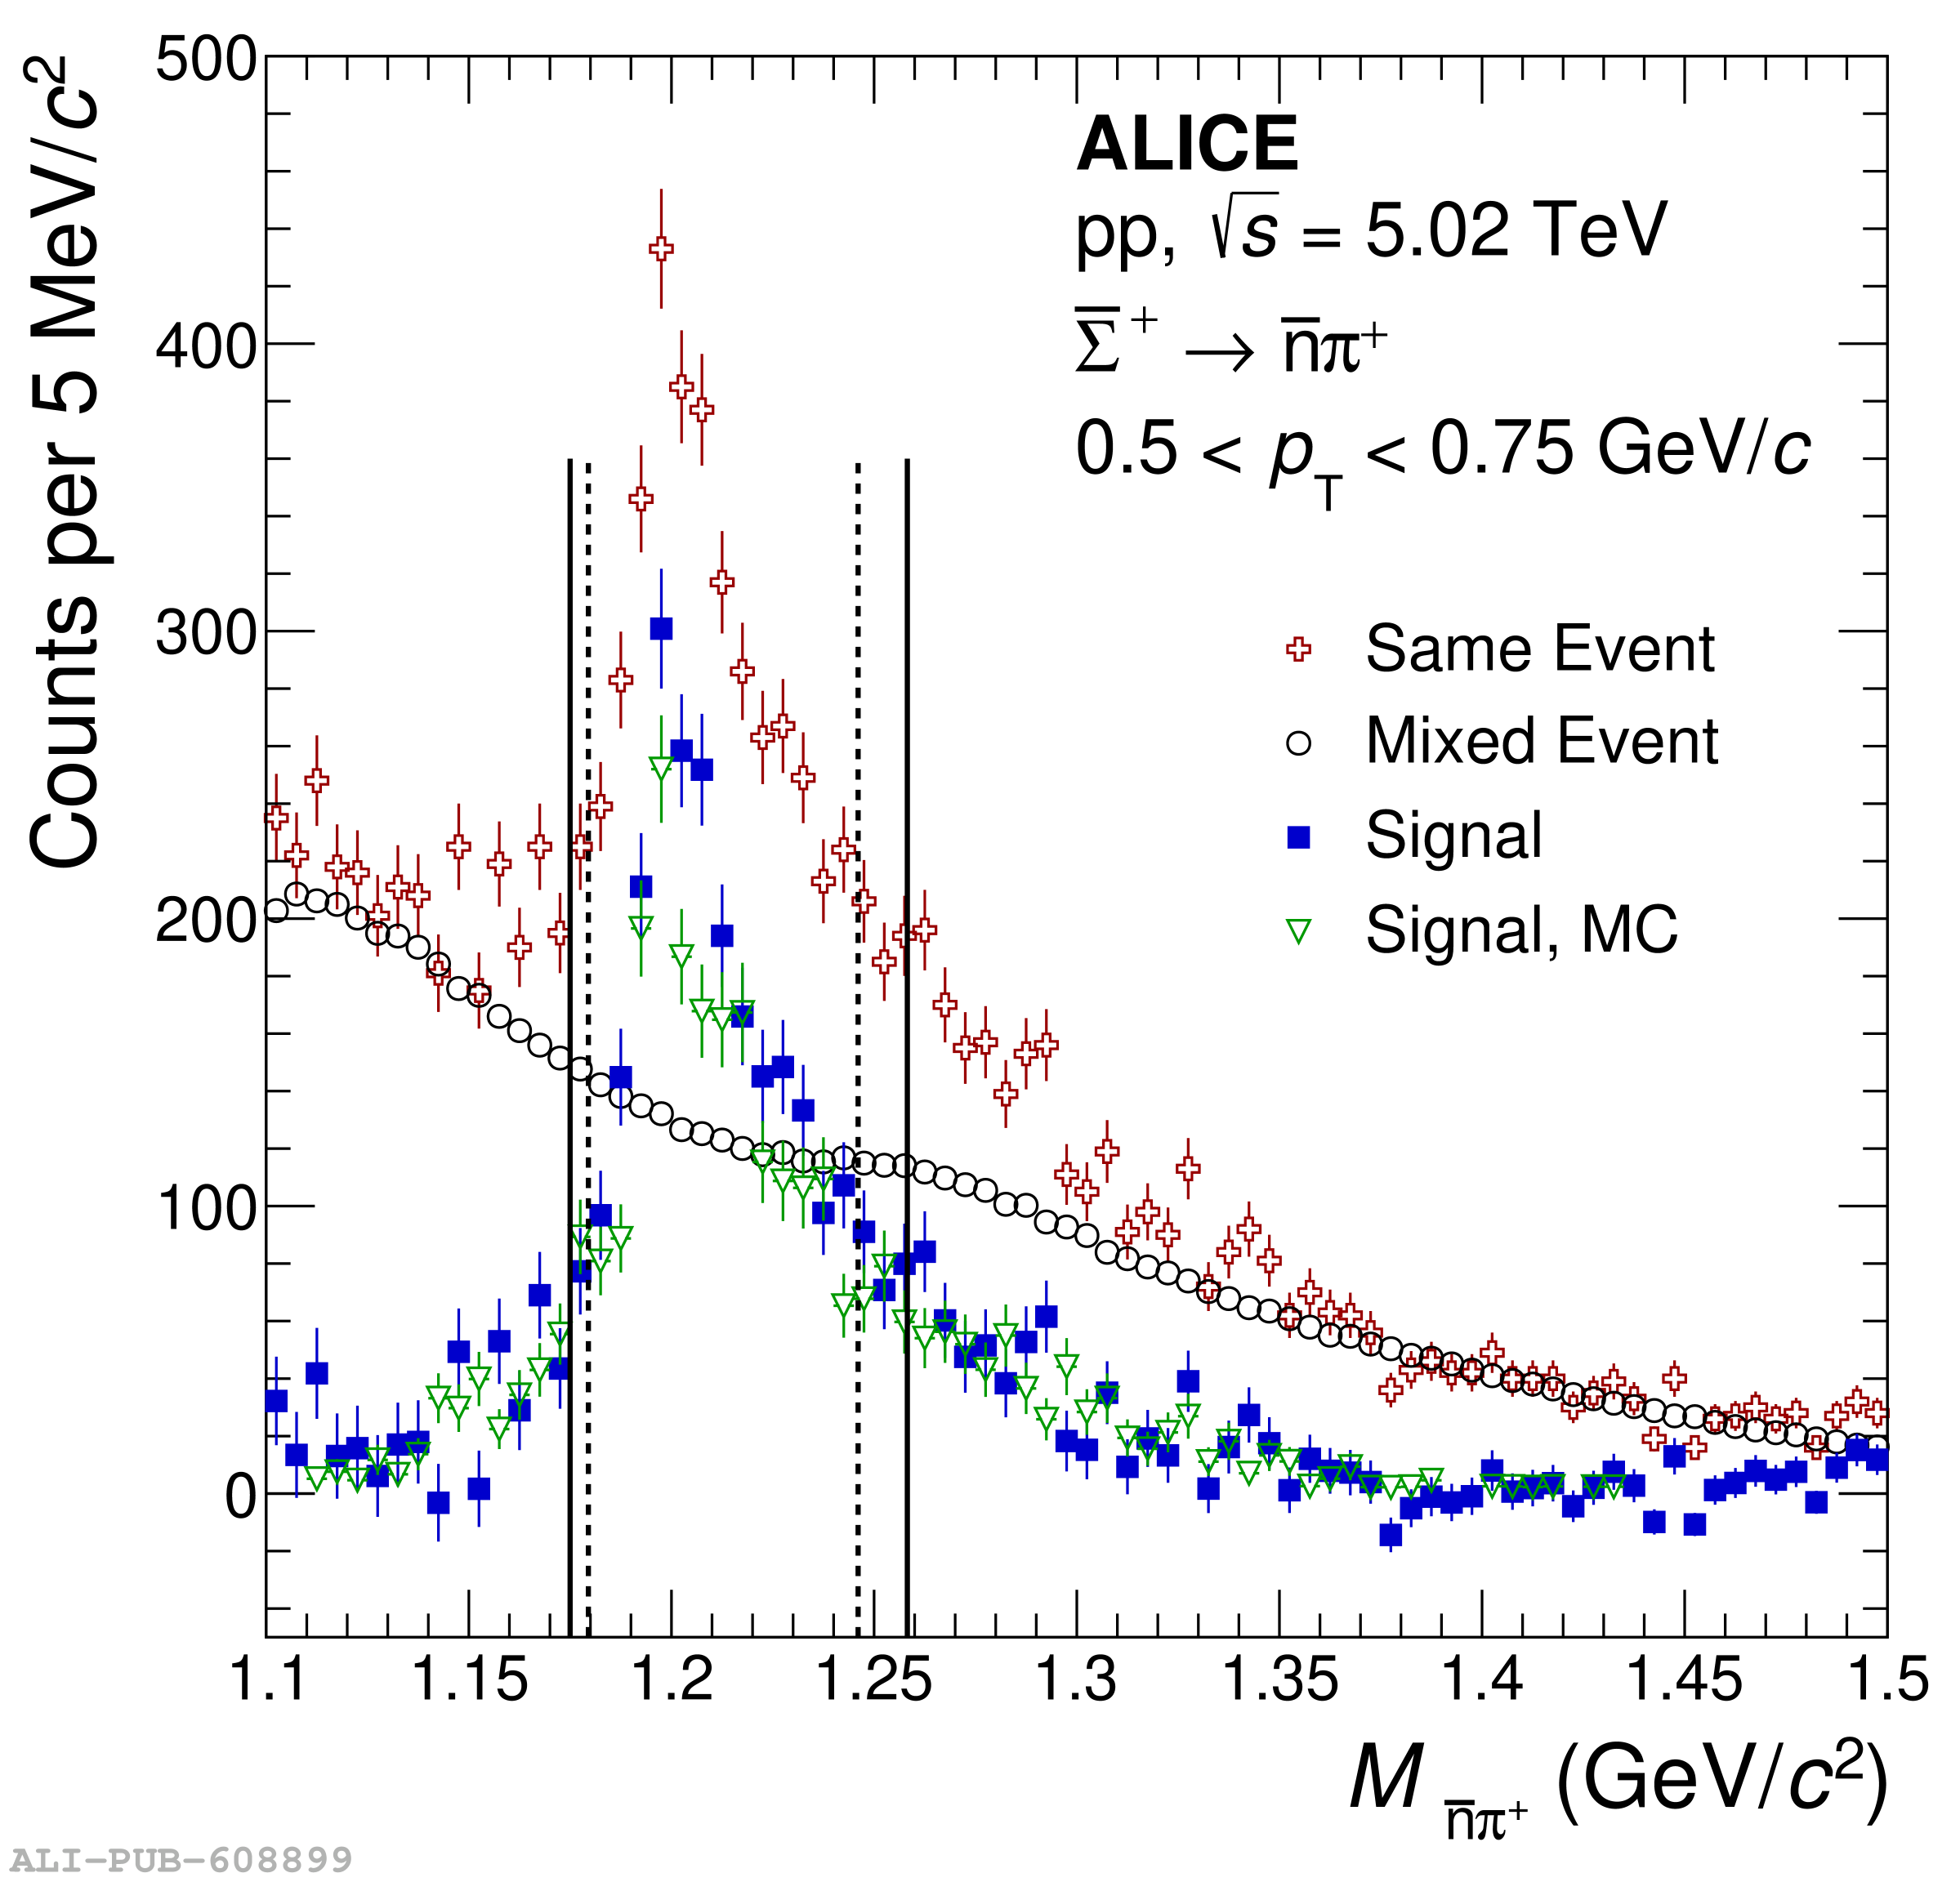 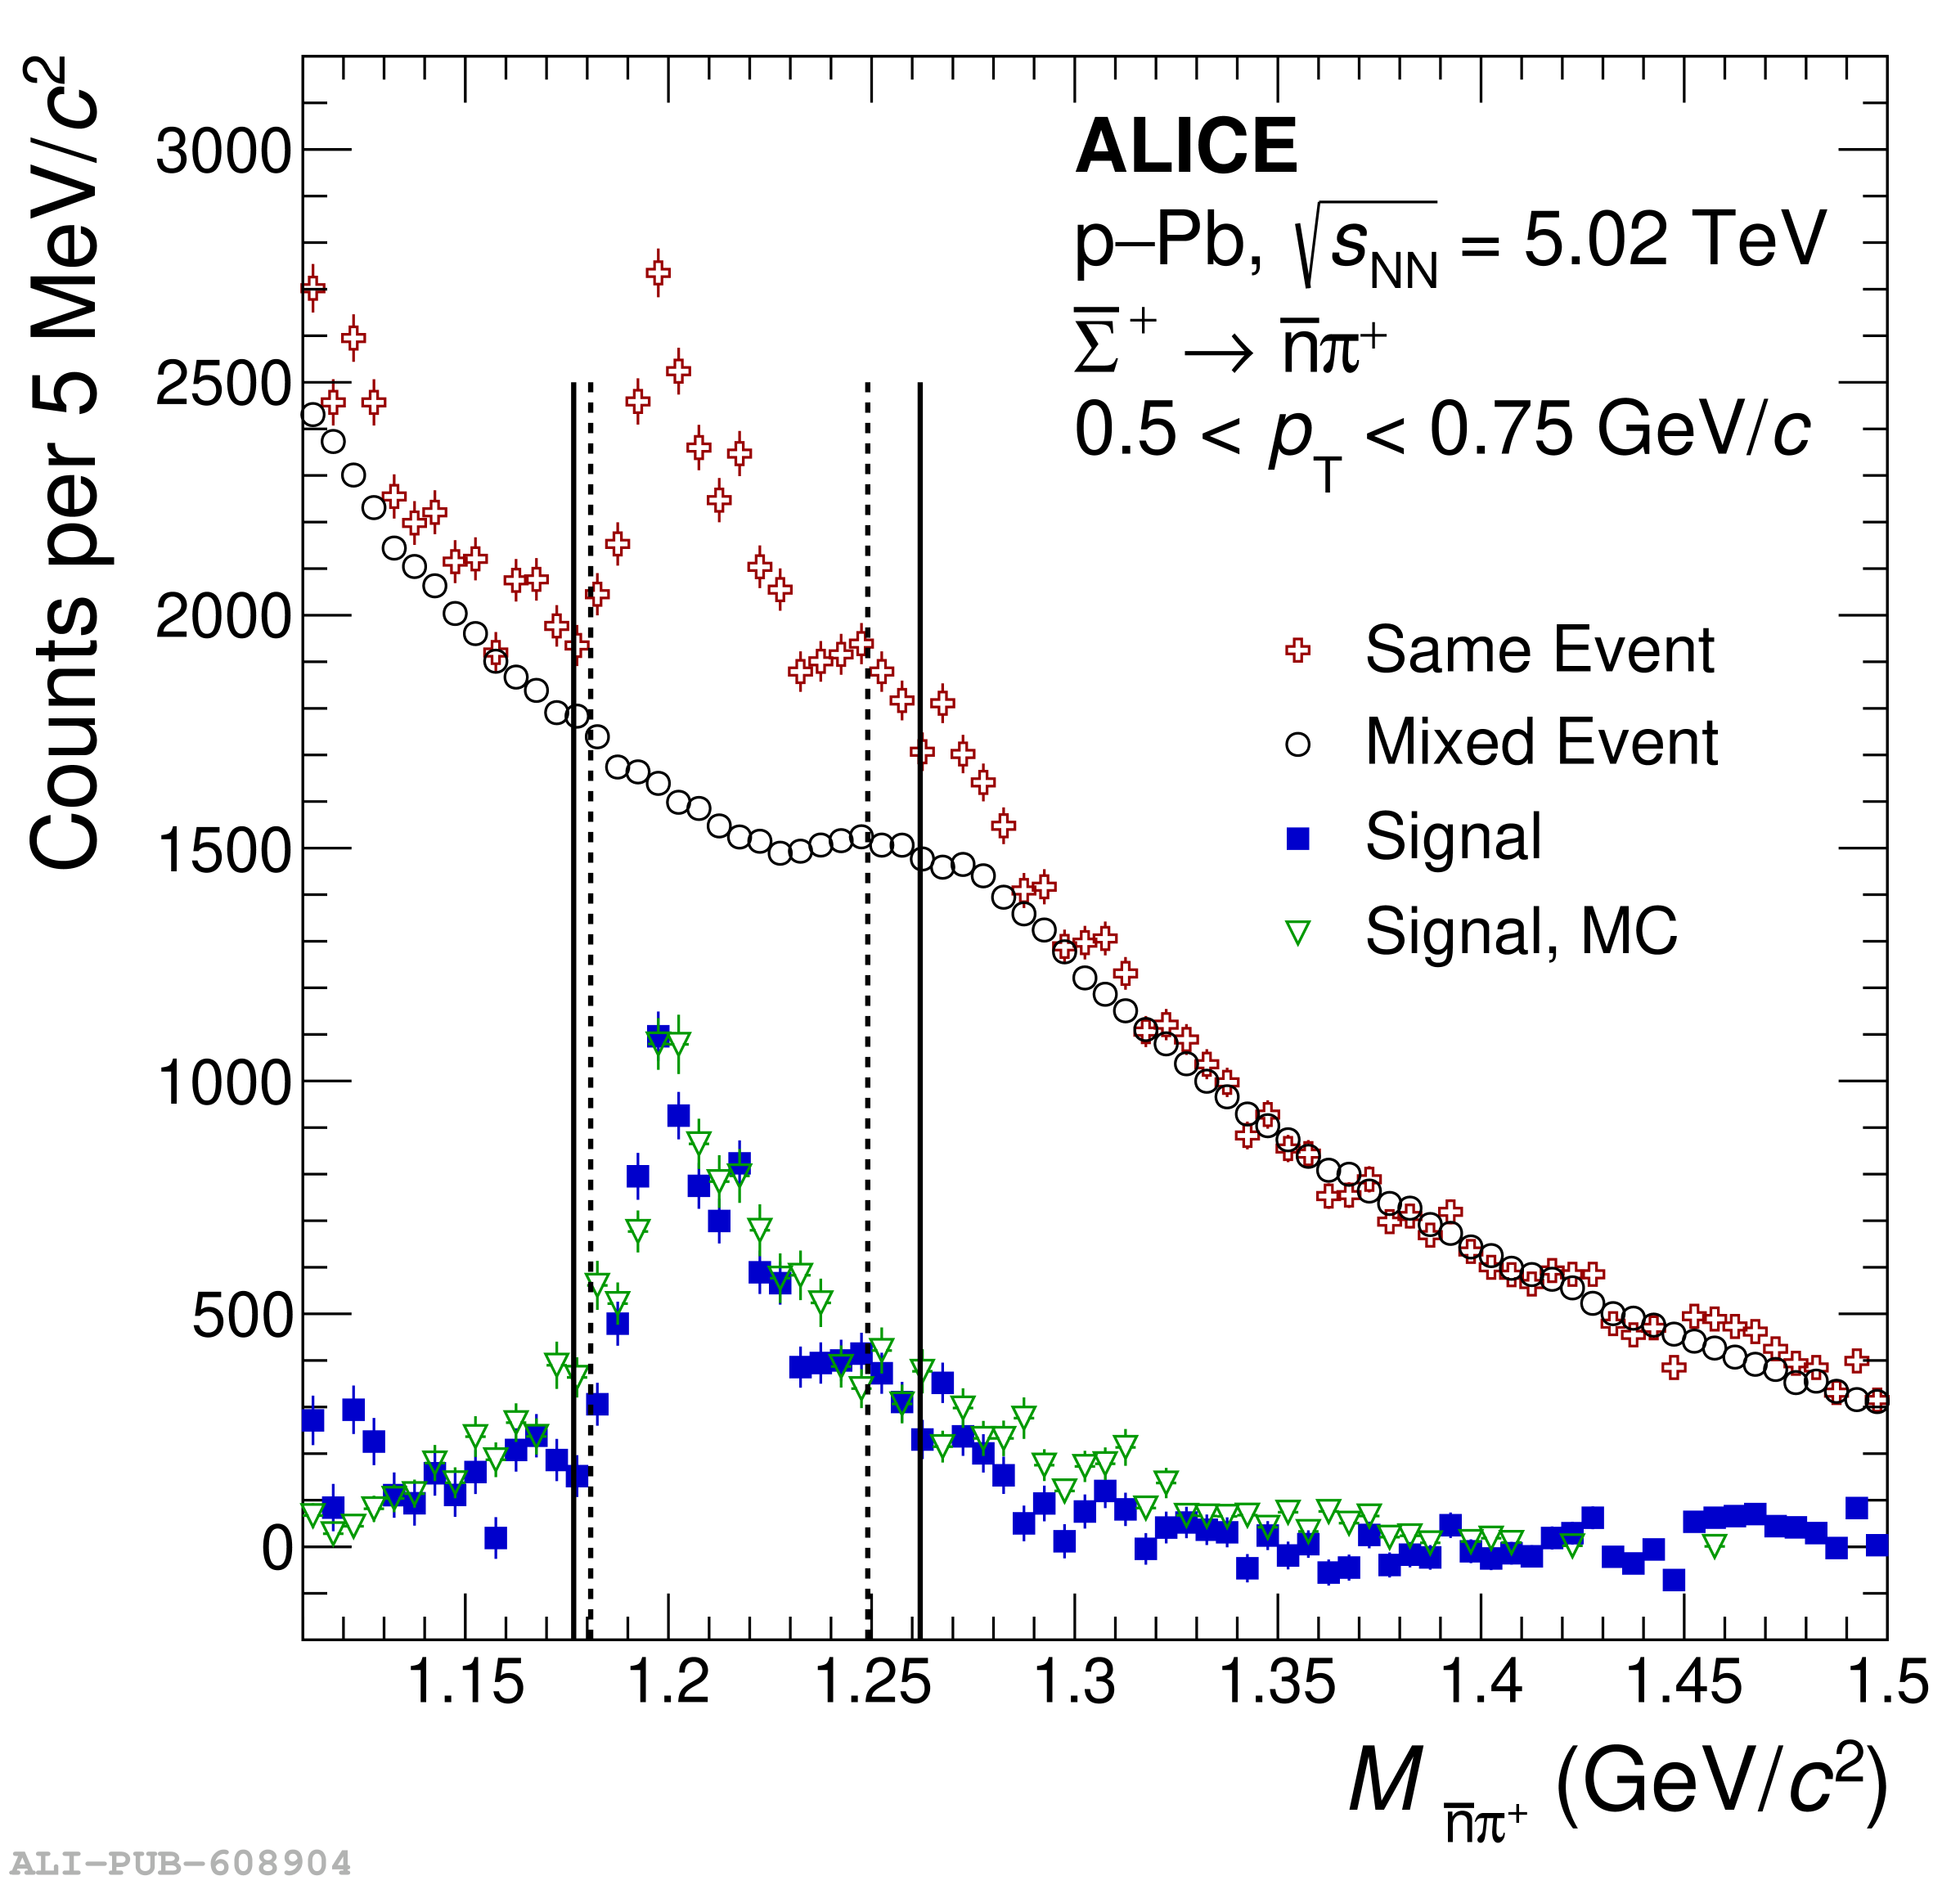   |
Figure 5
Comparison of peak position (left column) and full width at half maximum, FWHM, (right column) in pp (top row) and p--Pb collisions (bottom row) in data and MC simulations. The PYTHIA 8 and DPMJET 3.0-5 event generators were used for Monte-Carlo simulations. The PDG mass values of $\overline{\Sigma}^{+}$ and $\overline{\Sigma}^{-}$ are shown with short and long dashed lines, respectively. | 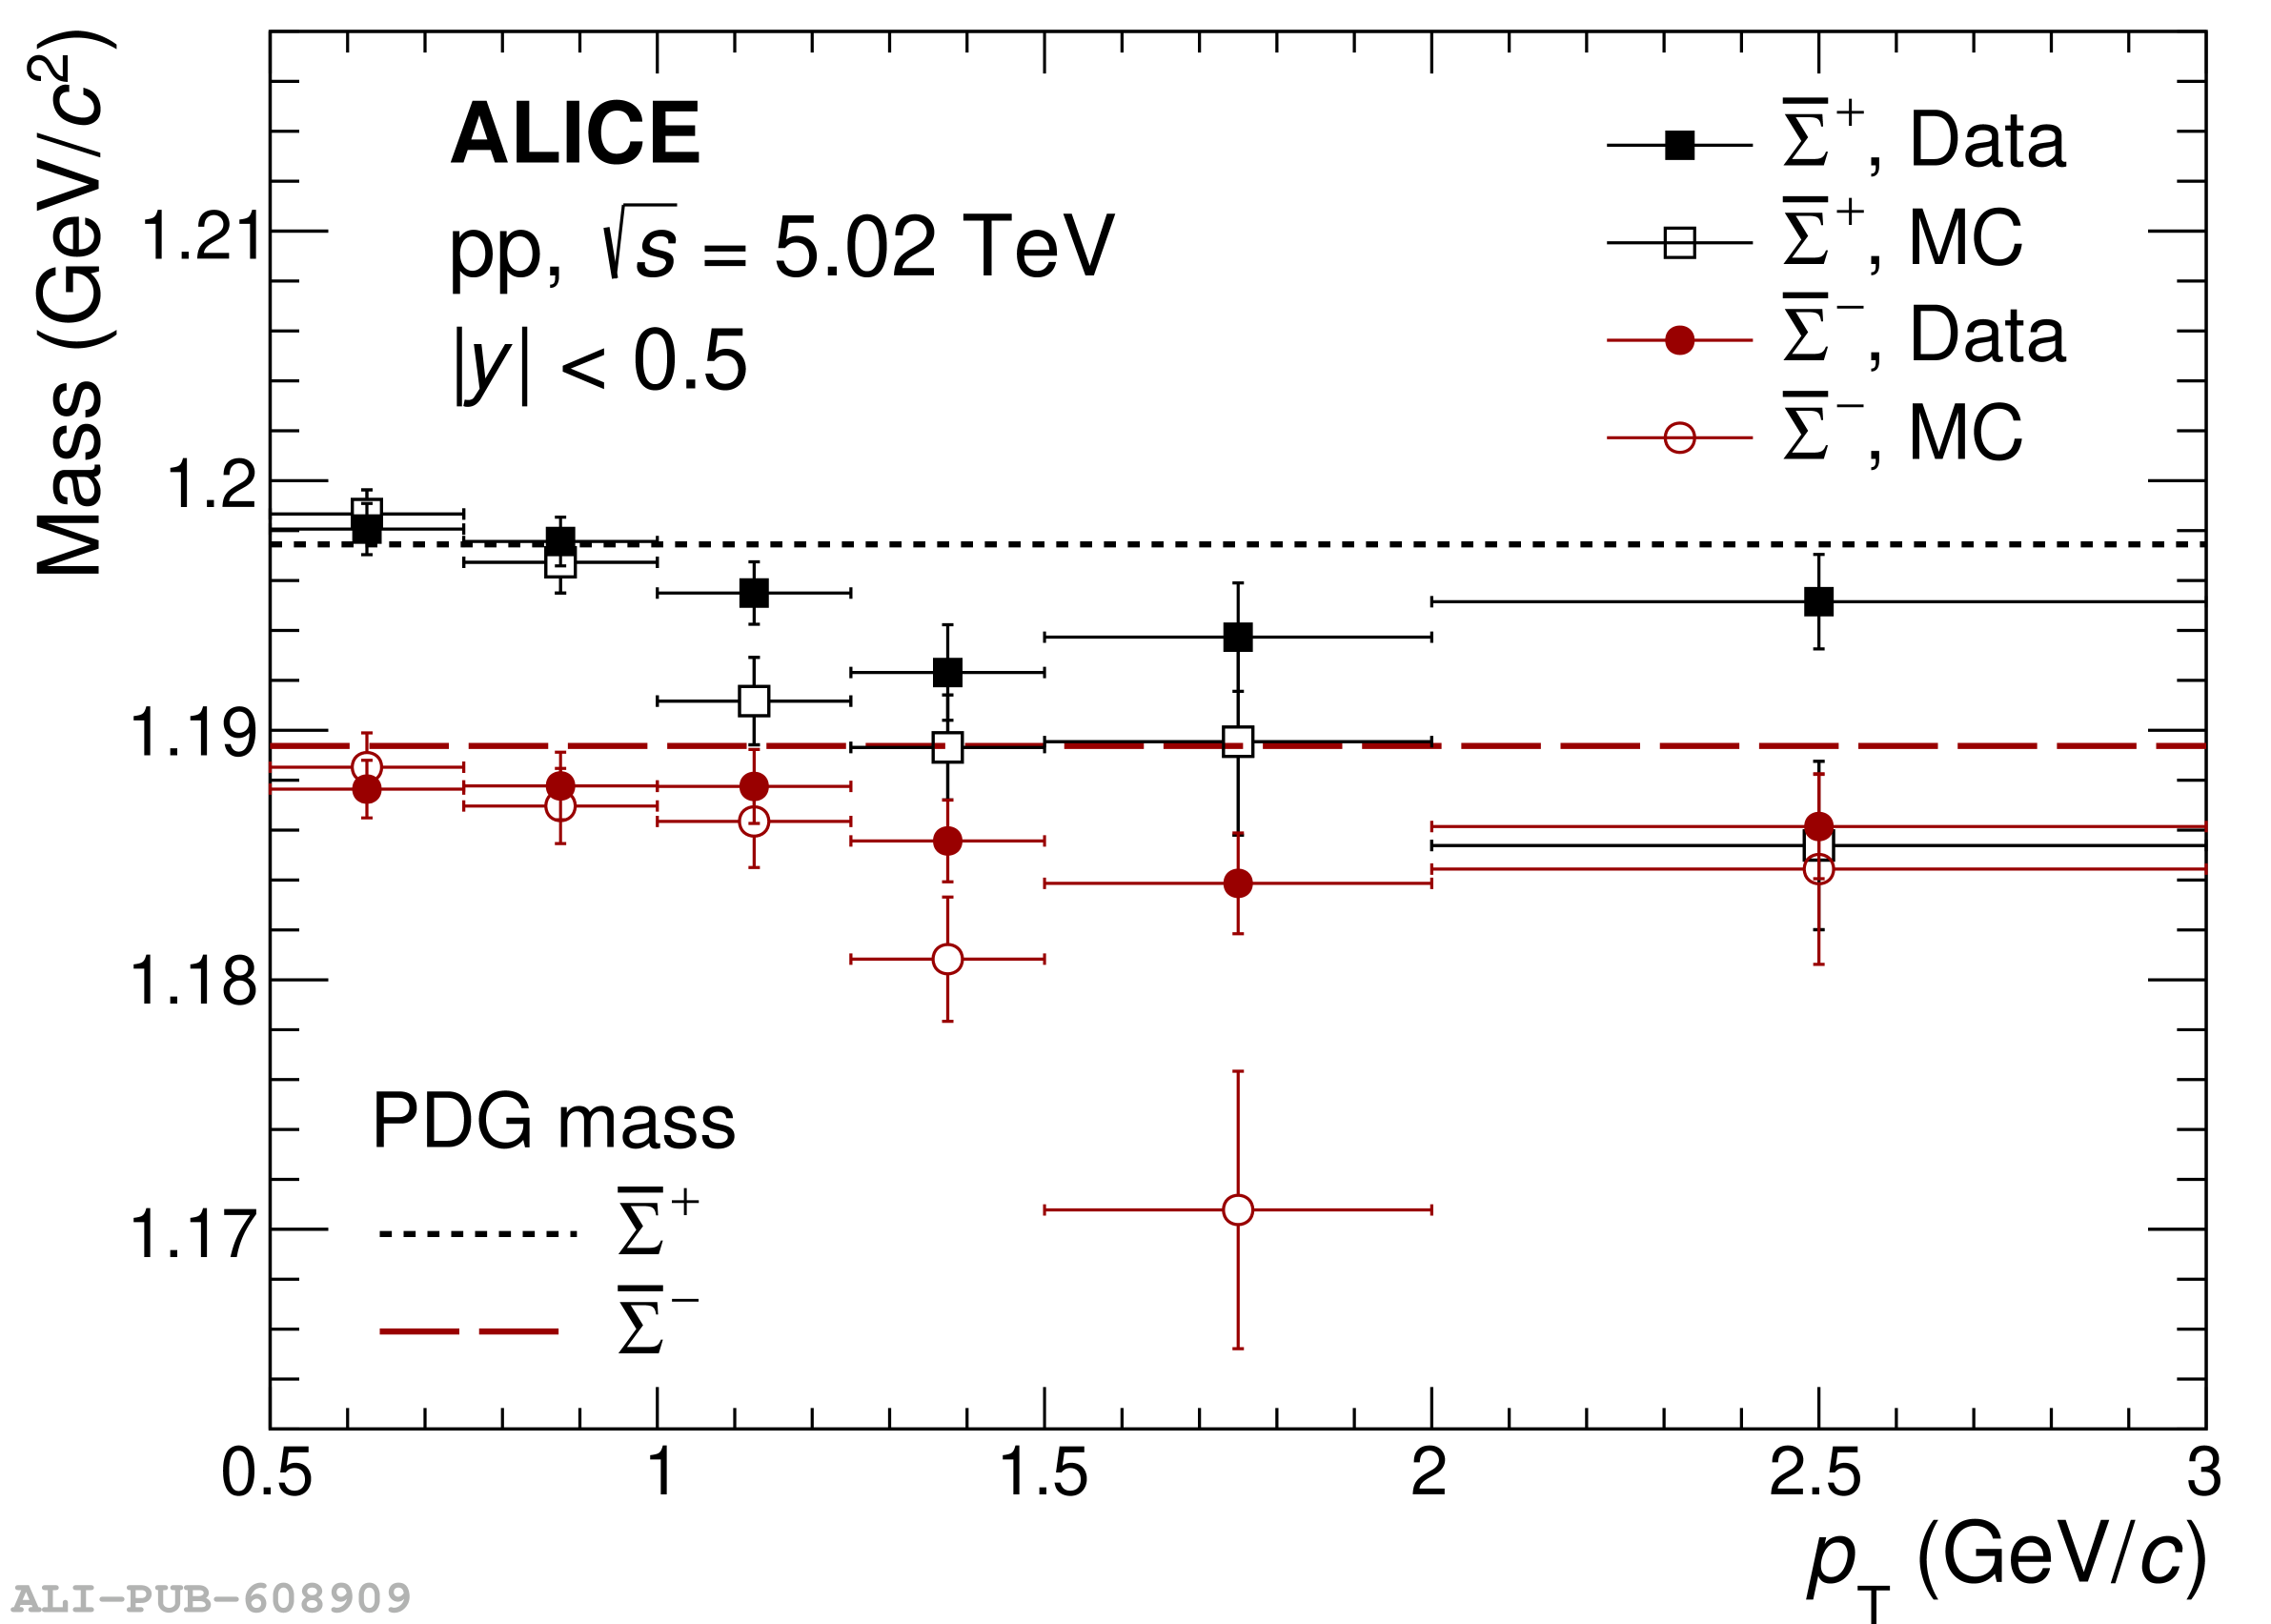 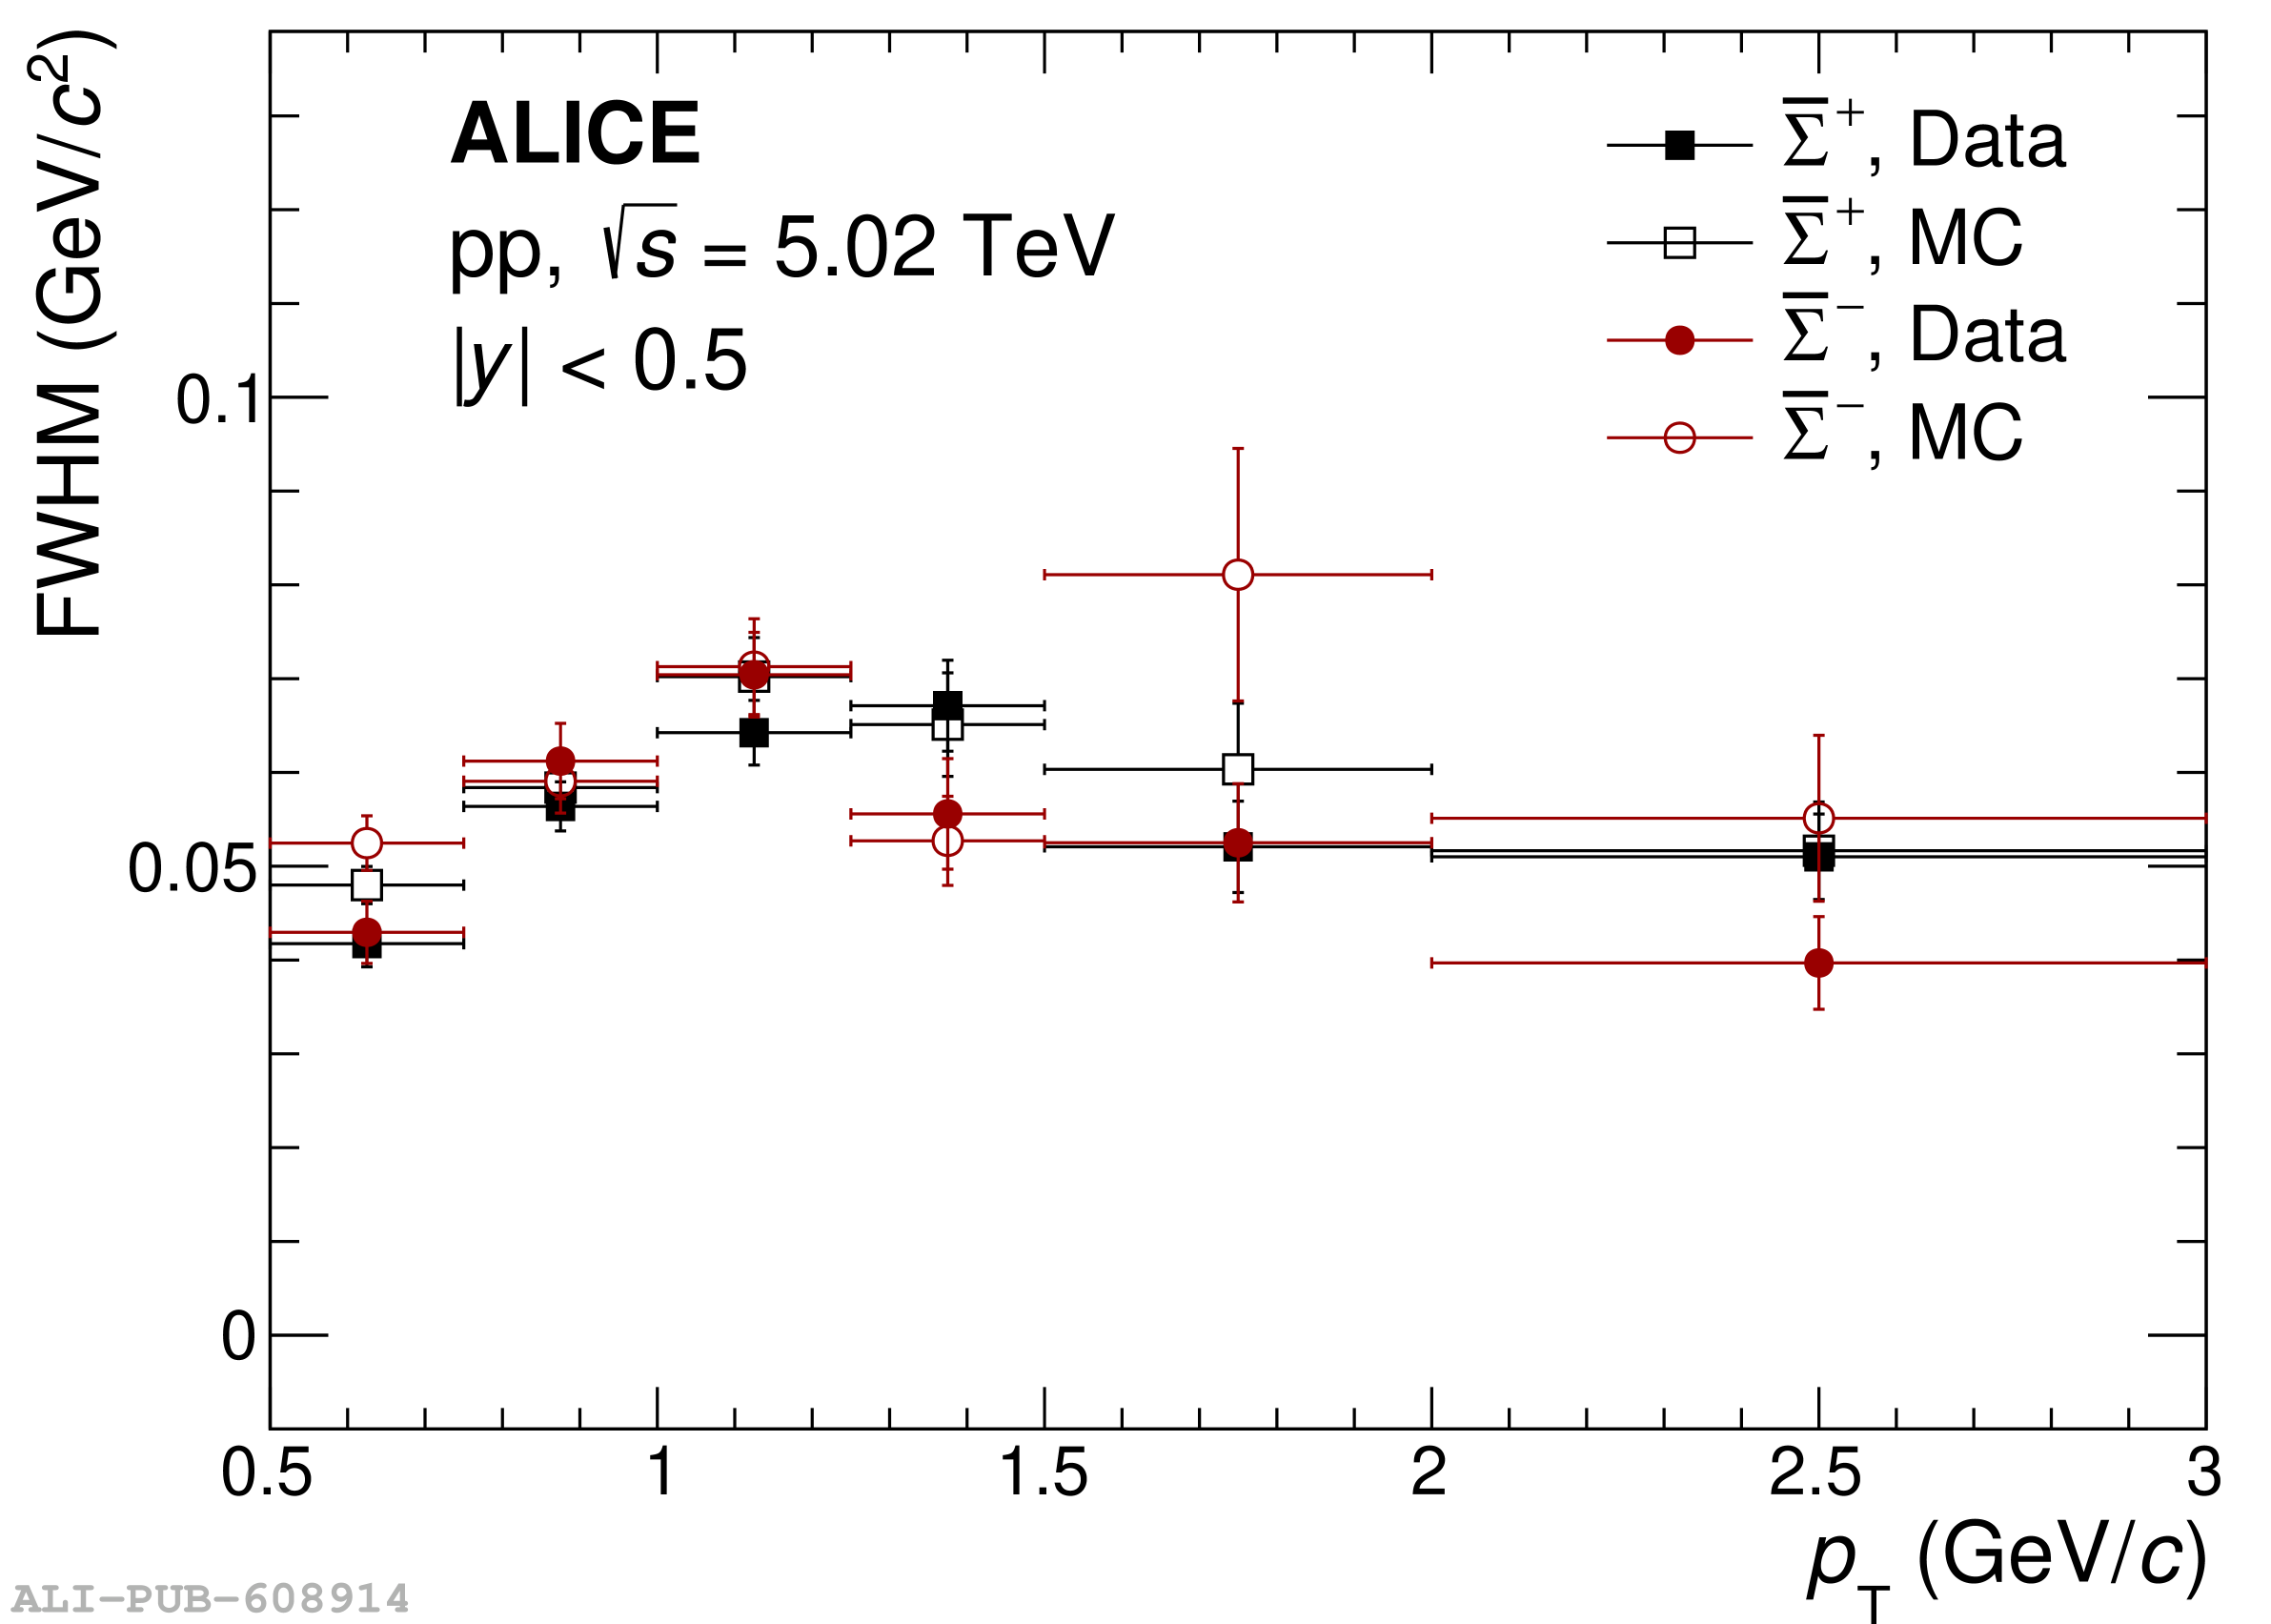 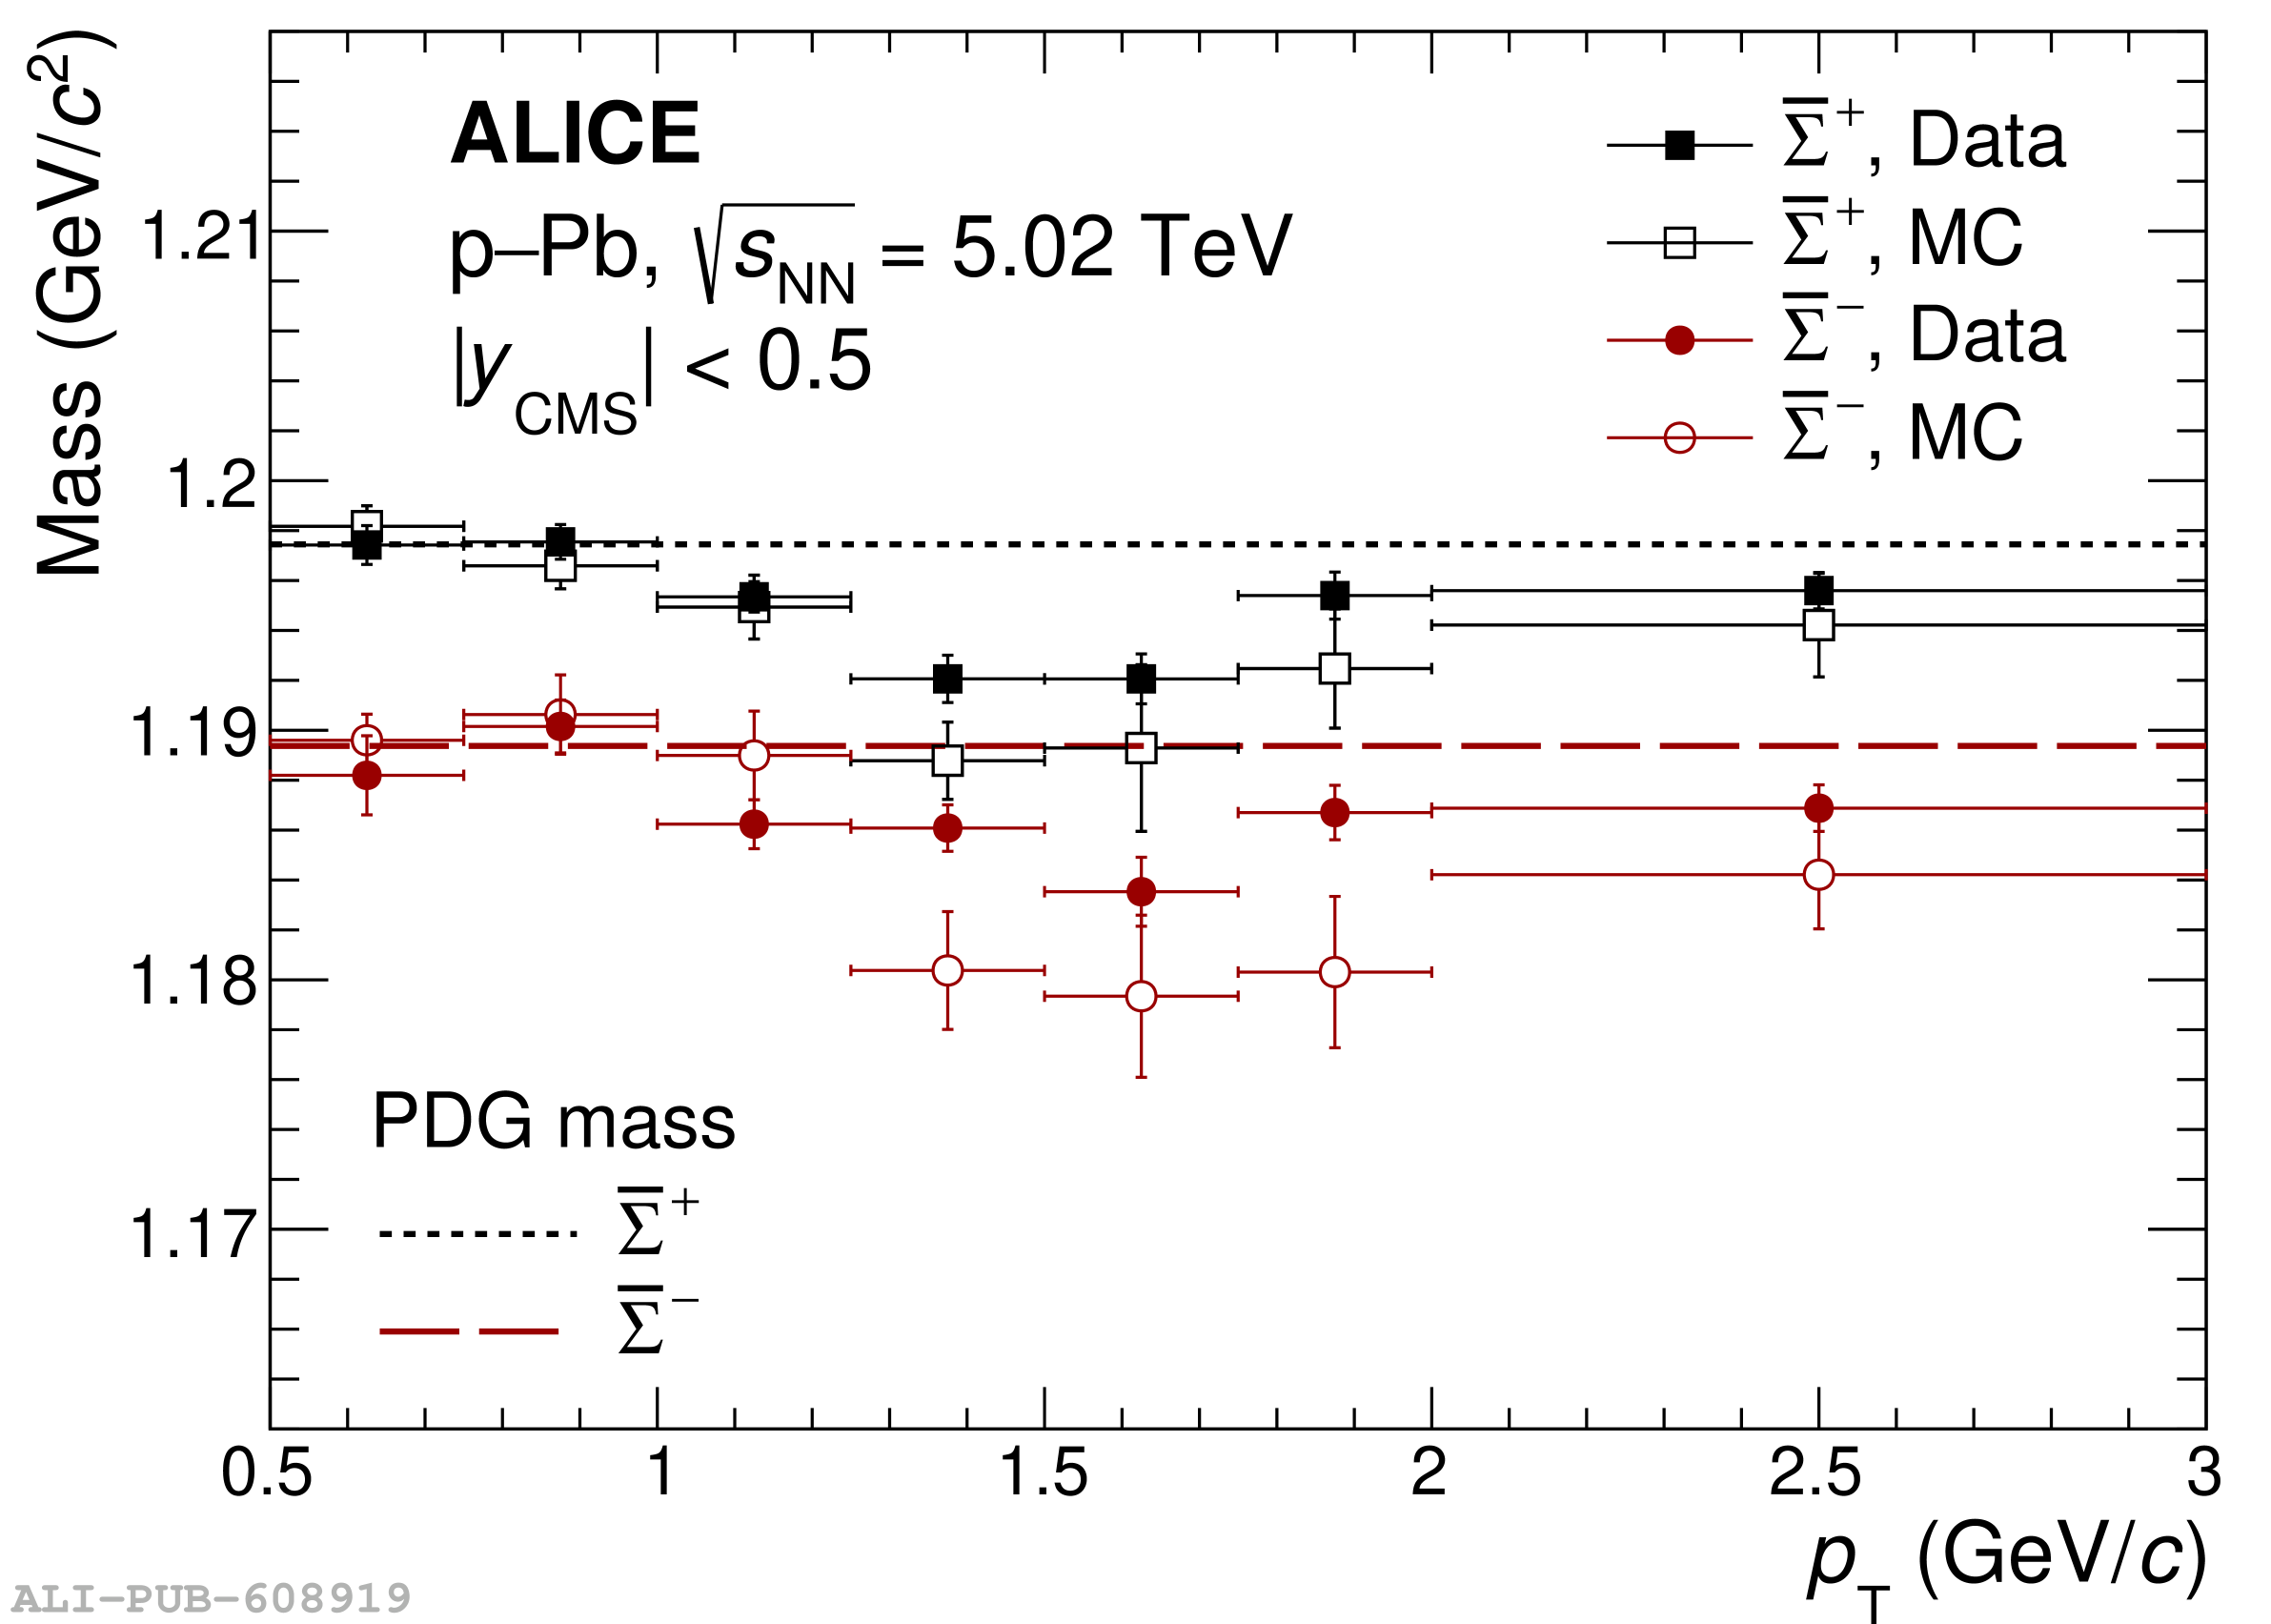  |
Figure 7
Spectra of $\overline{\Sigma}^{+}$ (left column) and $\overline{\Sigma}^{-}$ (right column) measured in pp (top row) and p--Pb (bottom row) collisions at $\sqrt{s_{\rm{NN}}} = 5.02 \text{TeV}$ compared to predictions of EPOS LHC and EPOS4 , PYTHIA 8 , PHOJET and DPMJET models. Also, Lévy-Tsallis fits to the measured spectra are shown. All models except EPOS4 have negligible statistical uncertainties. The uncertainties of the models are included as statistical ones in the data to MC ratio. | 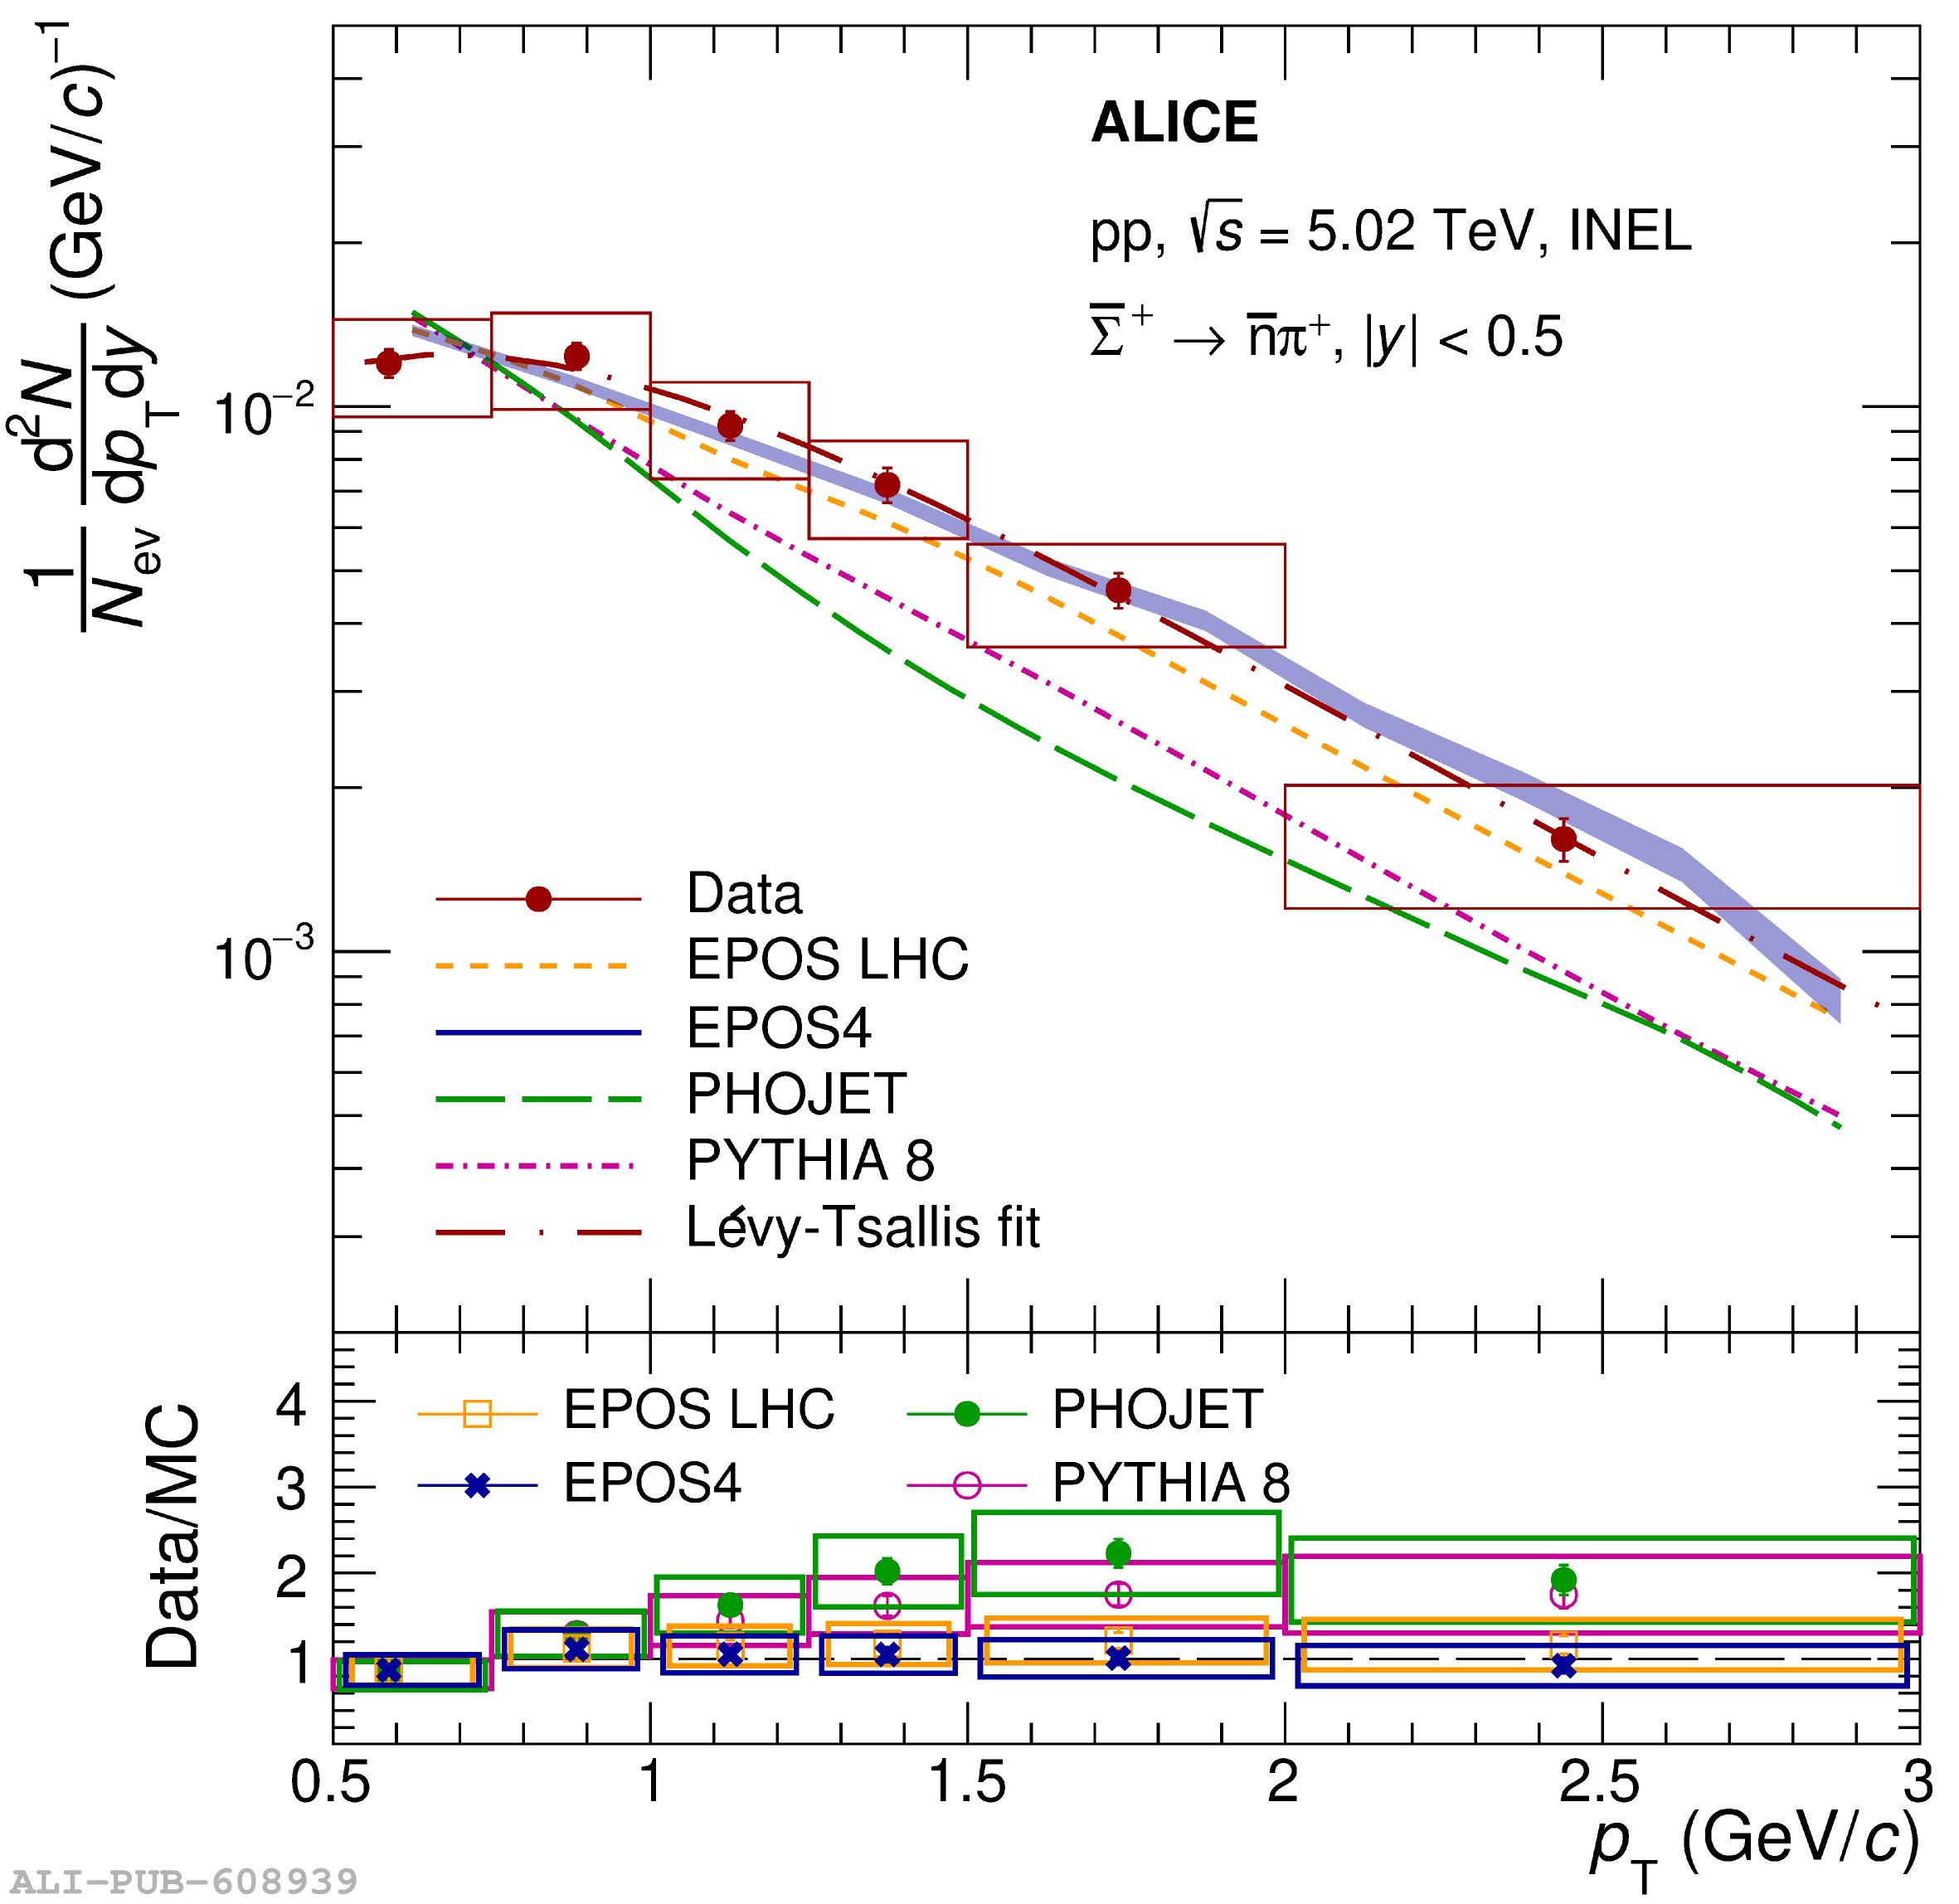 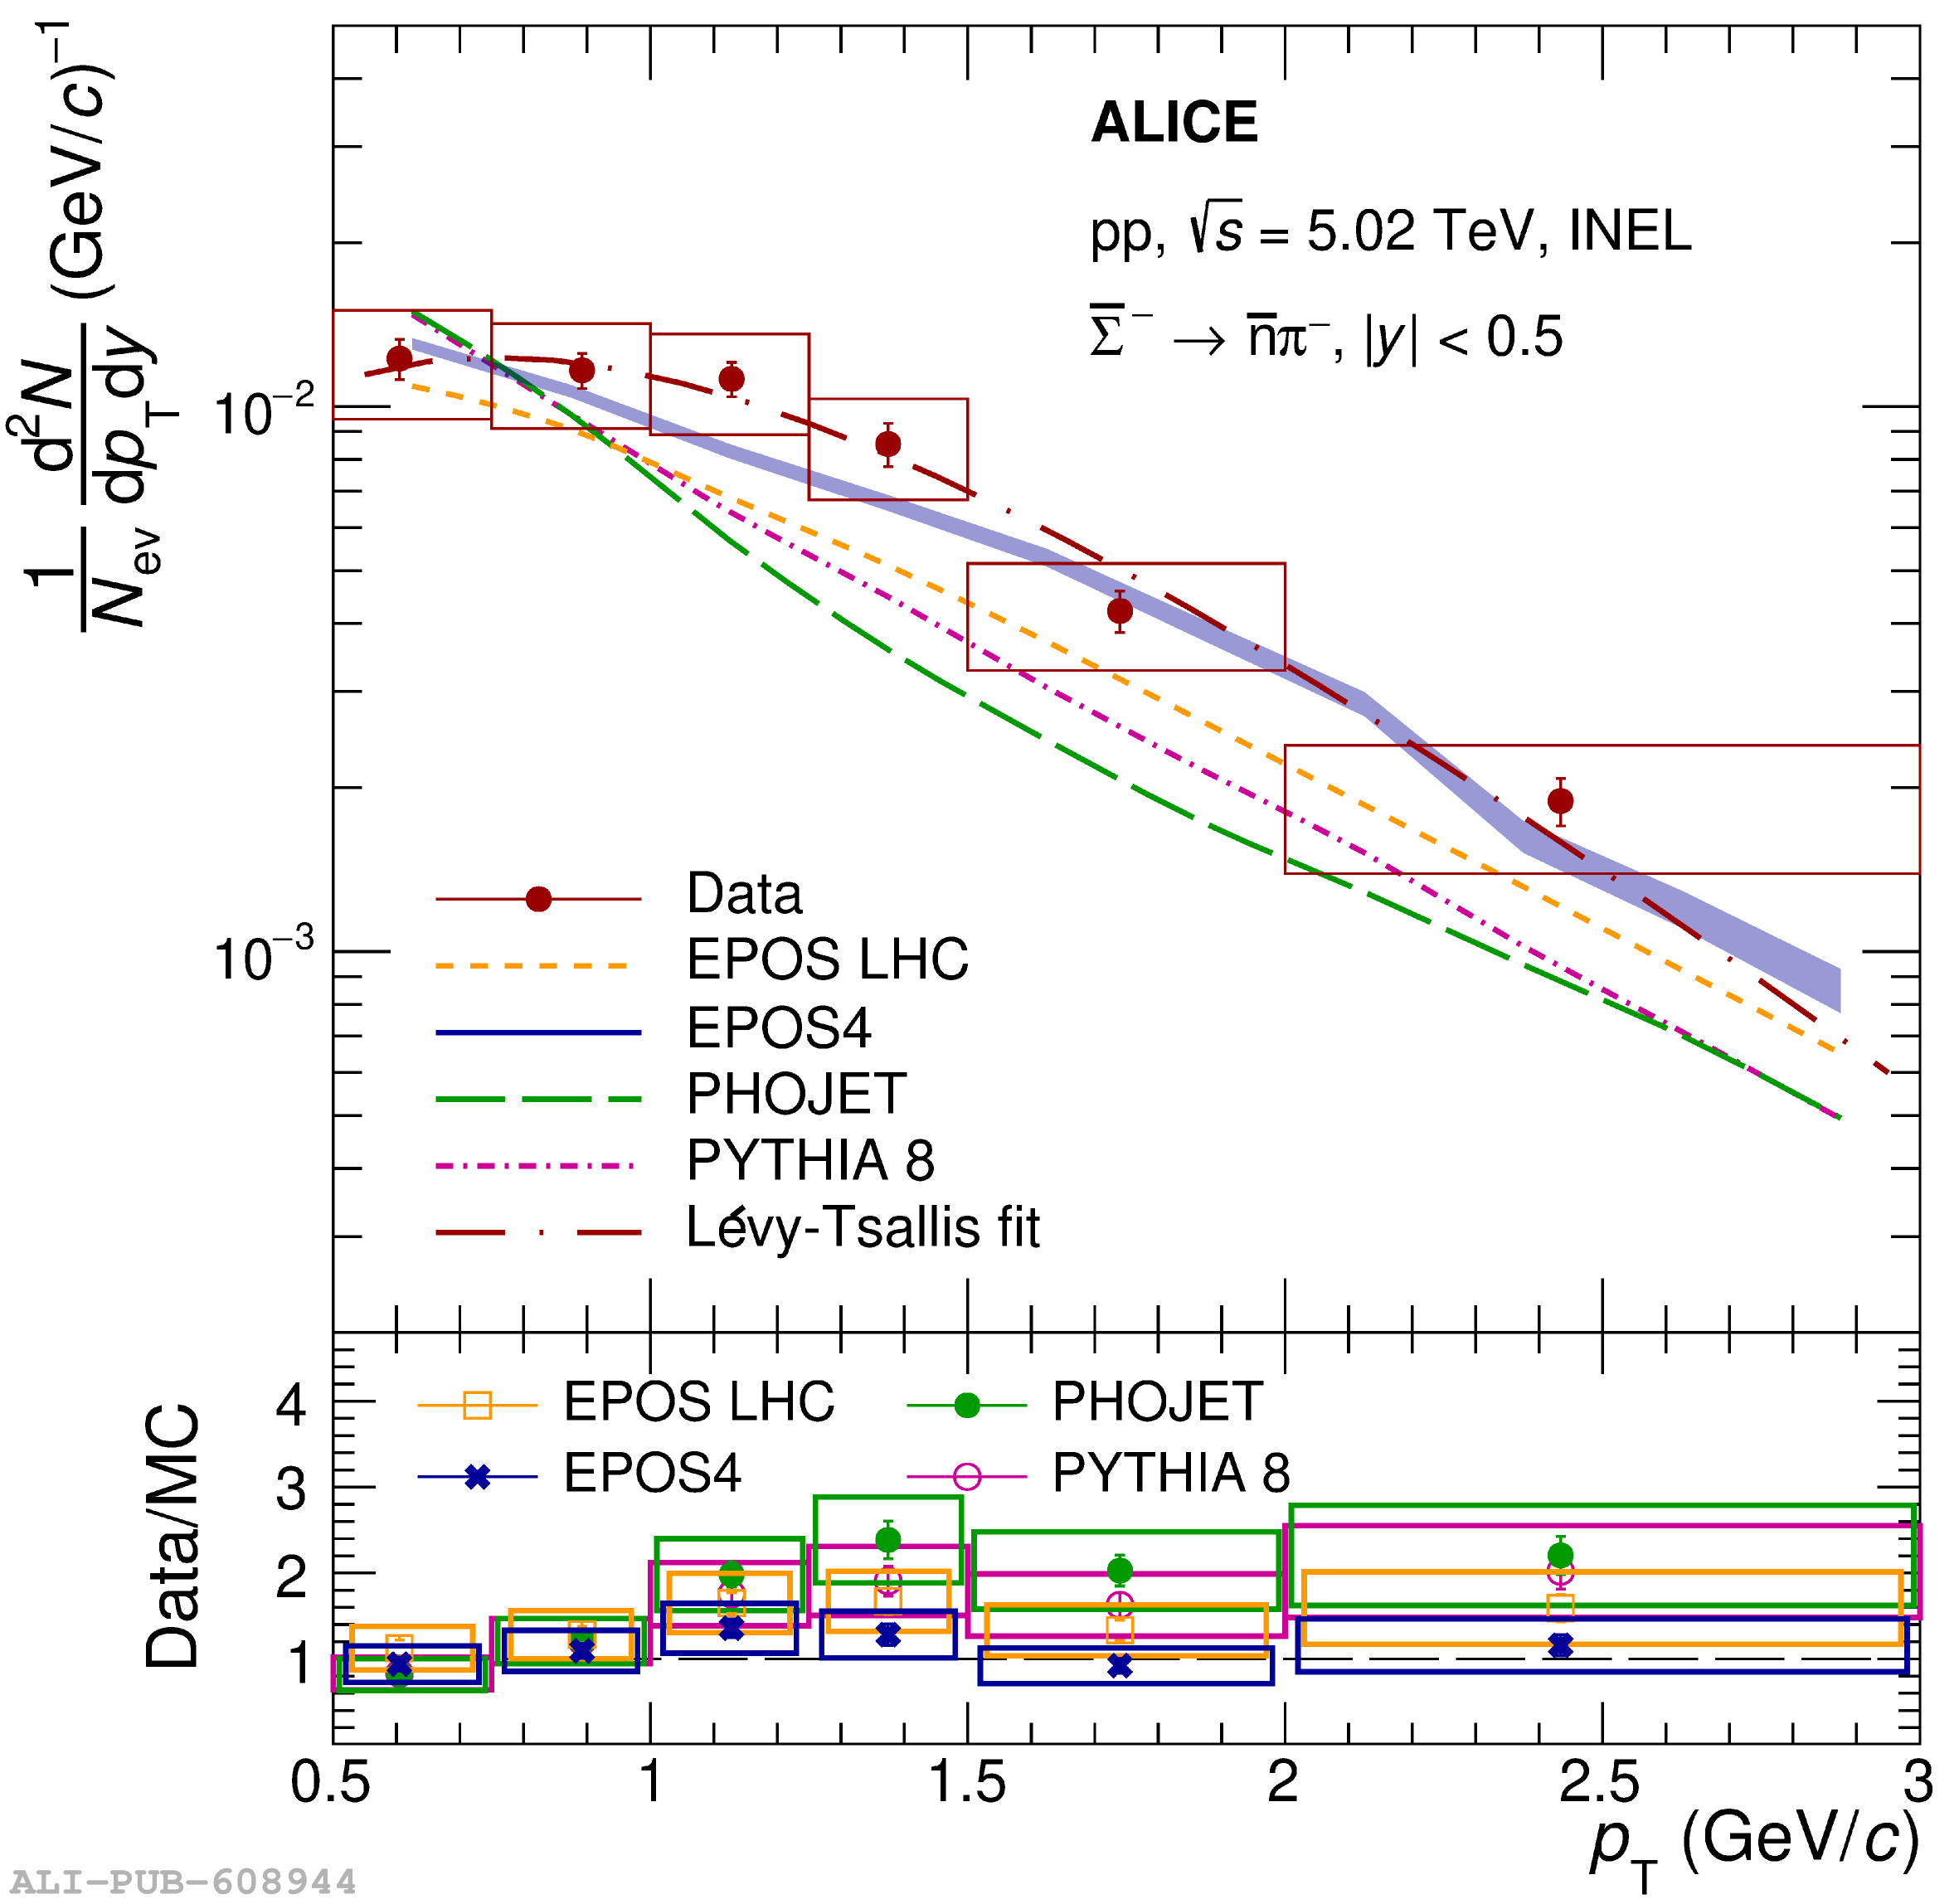 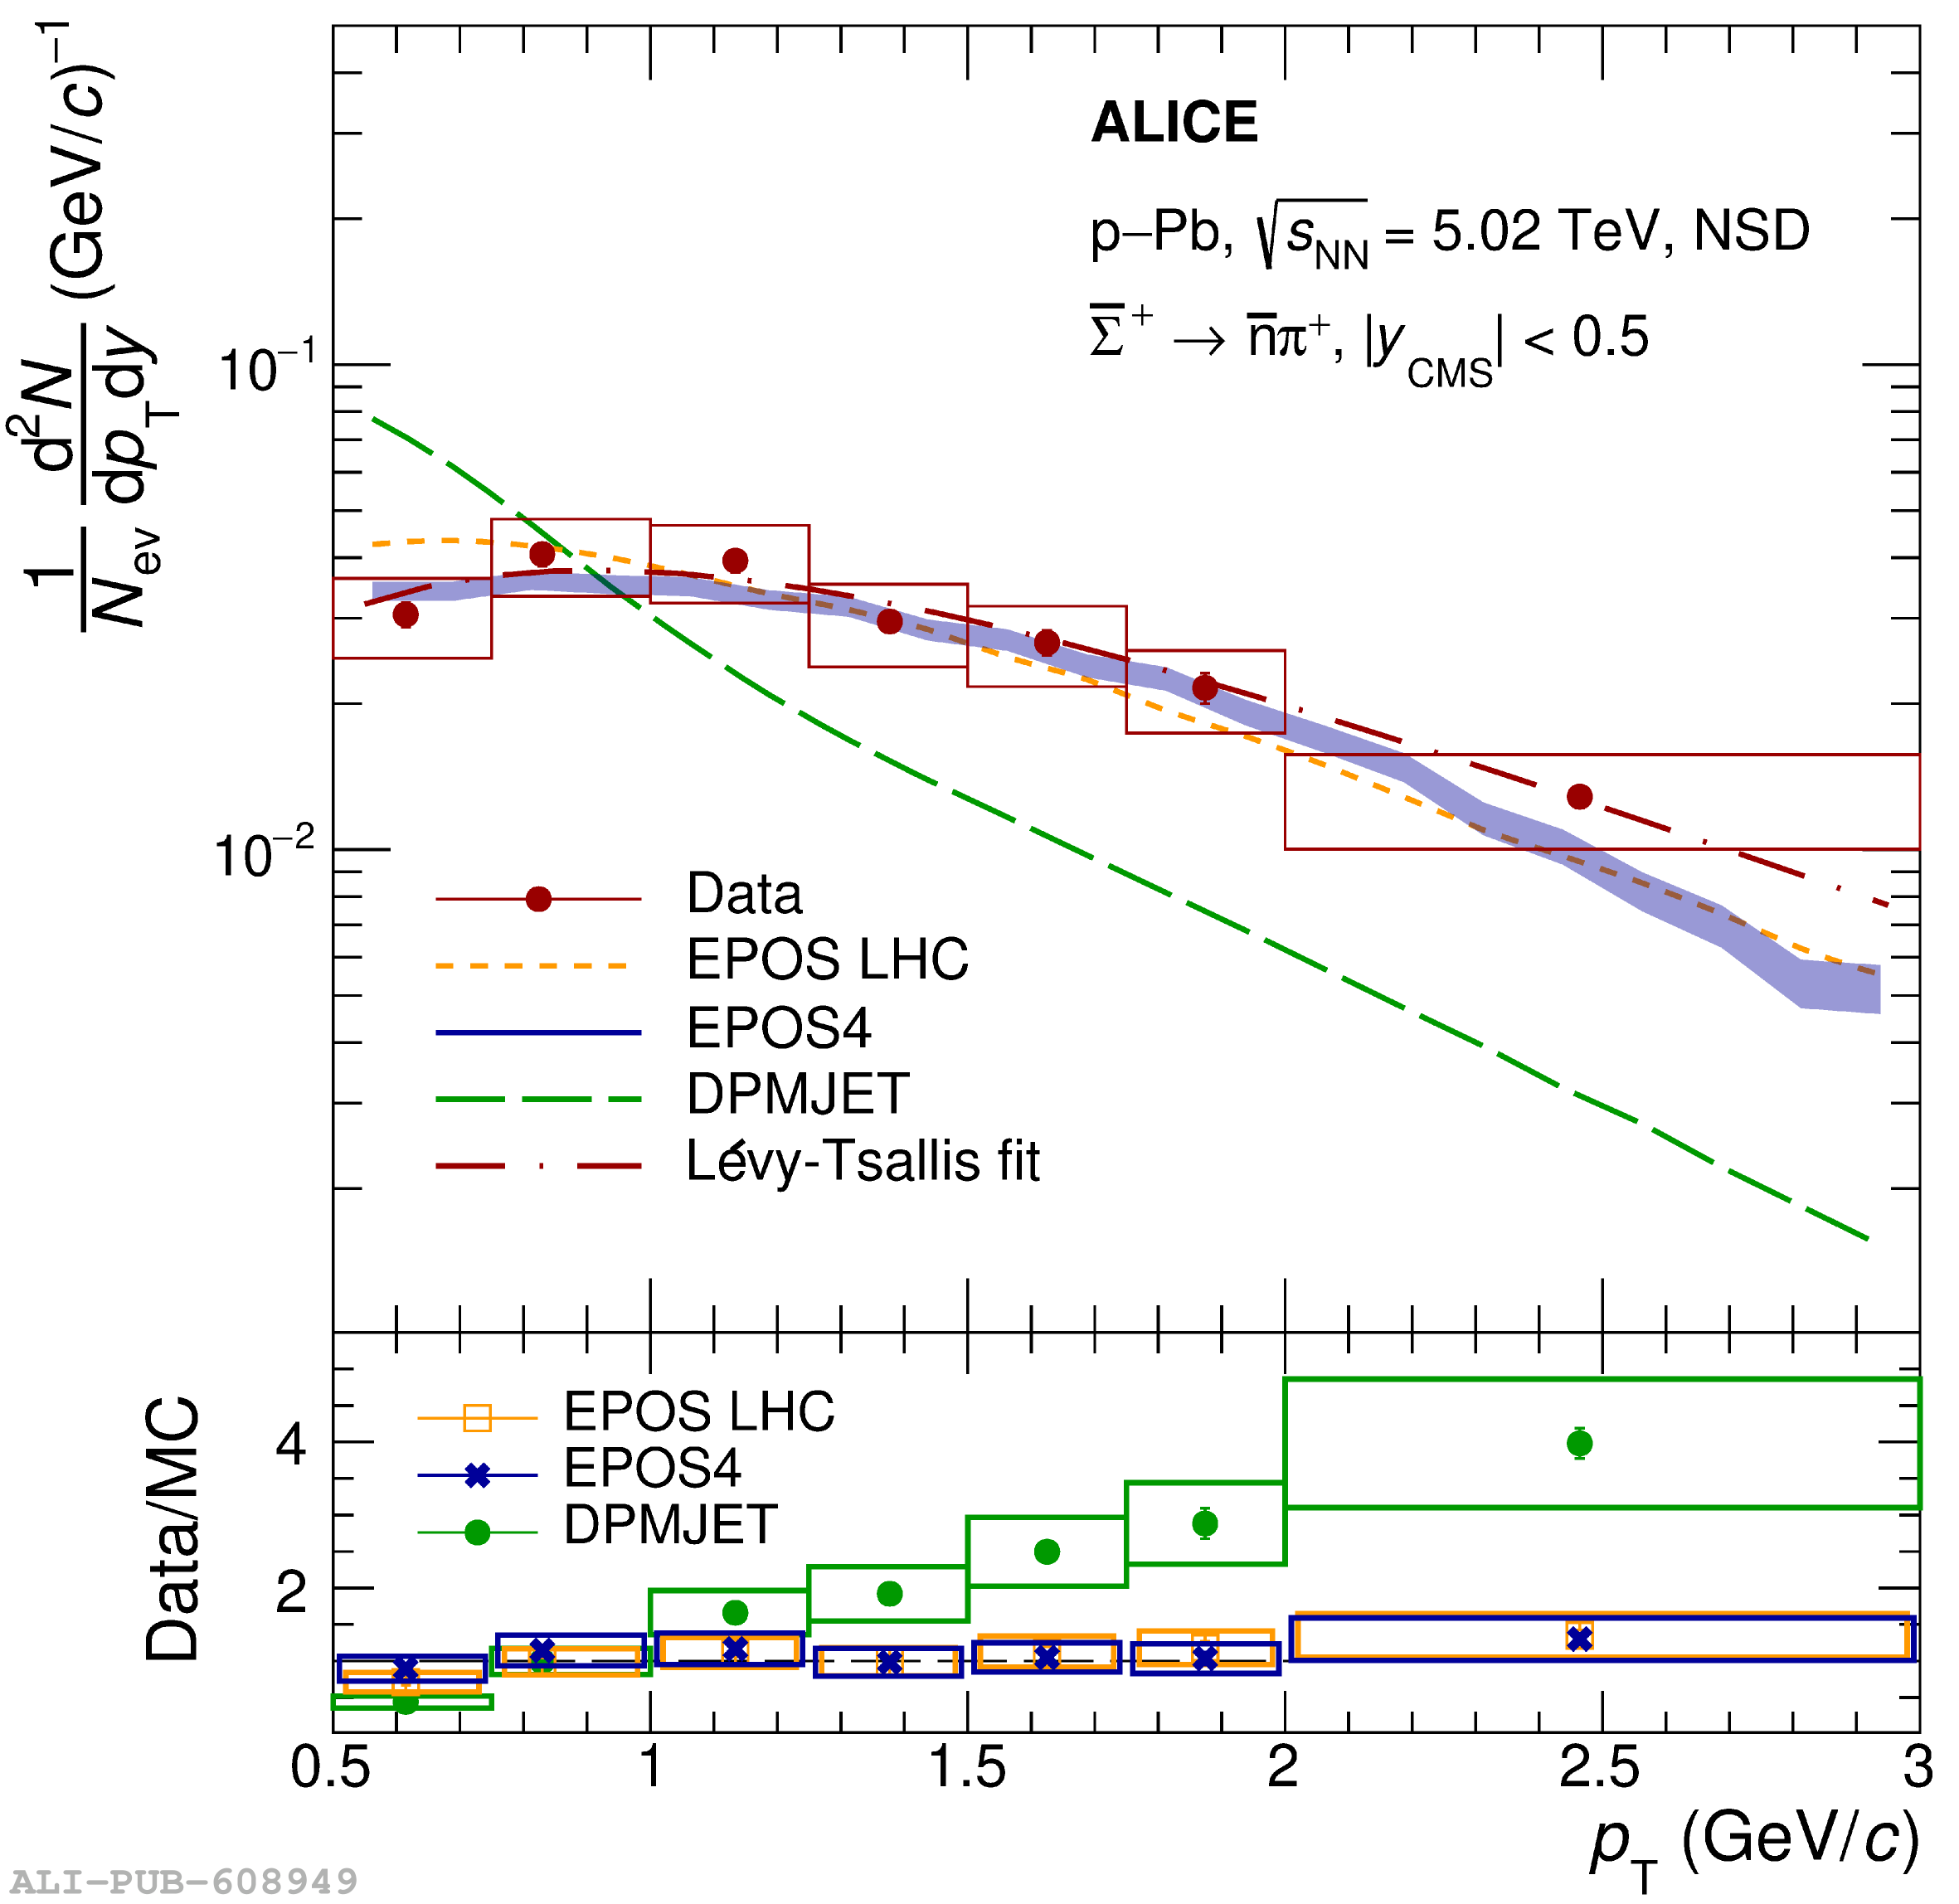 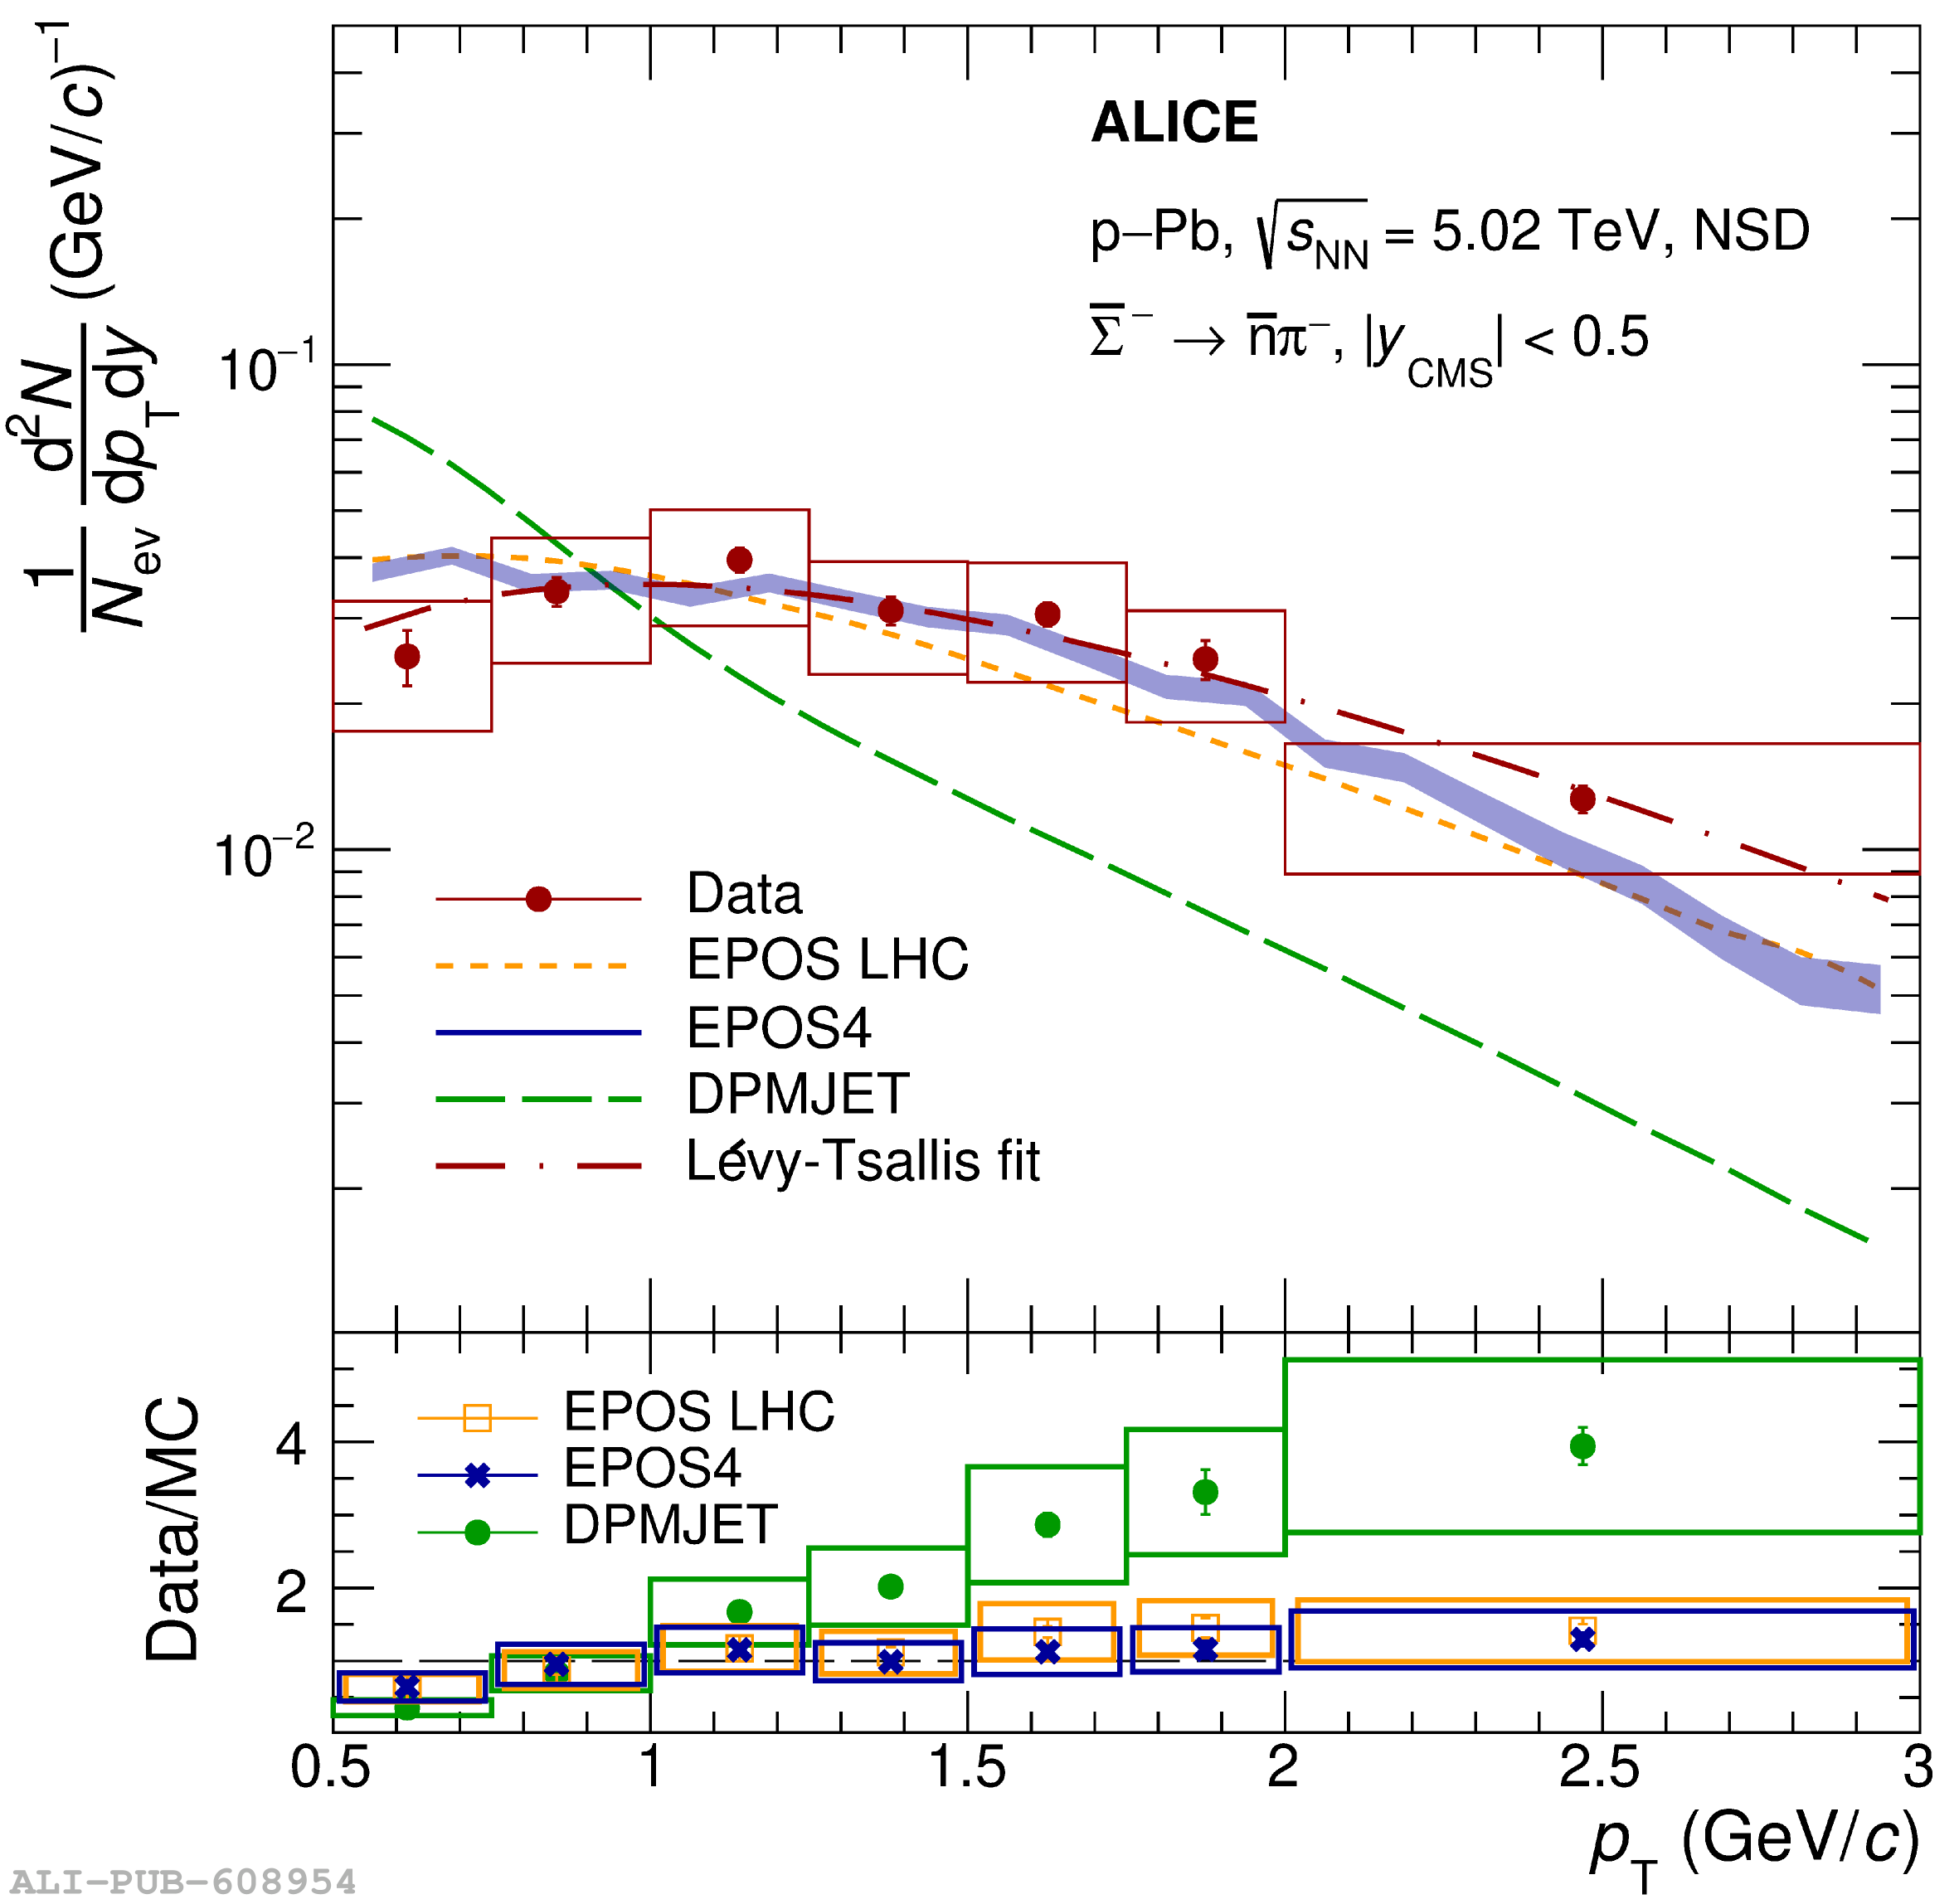 |
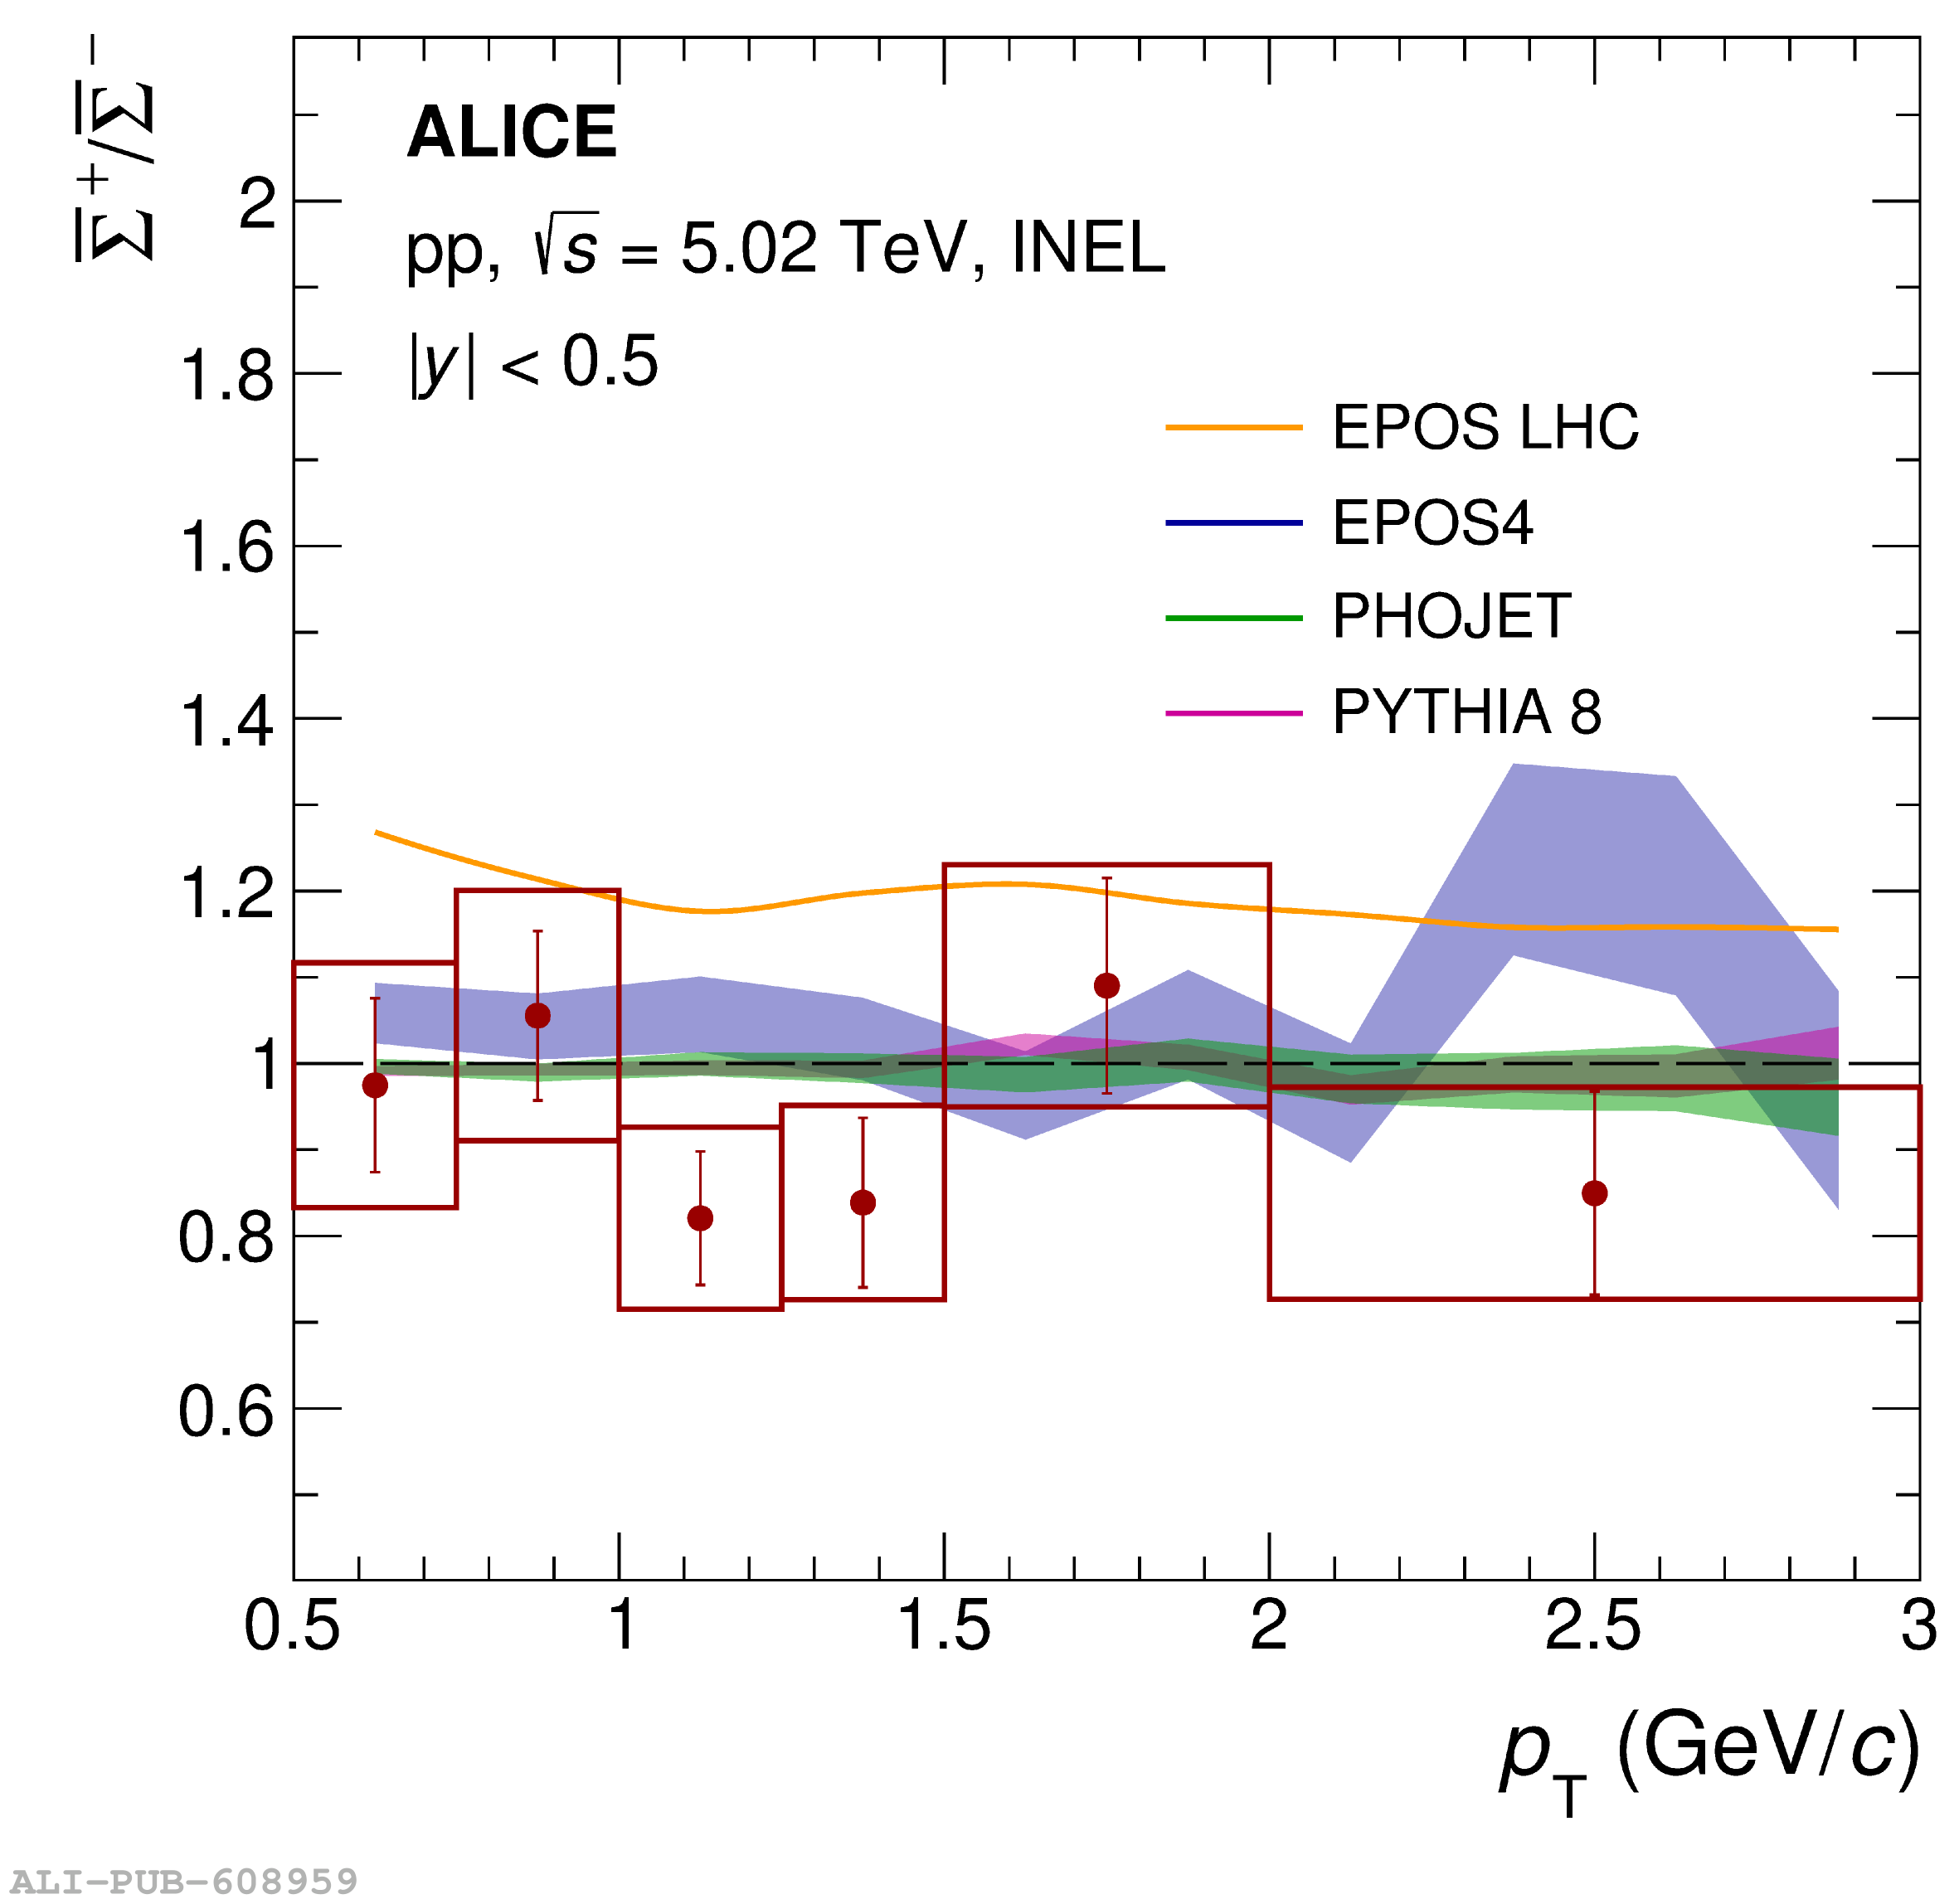
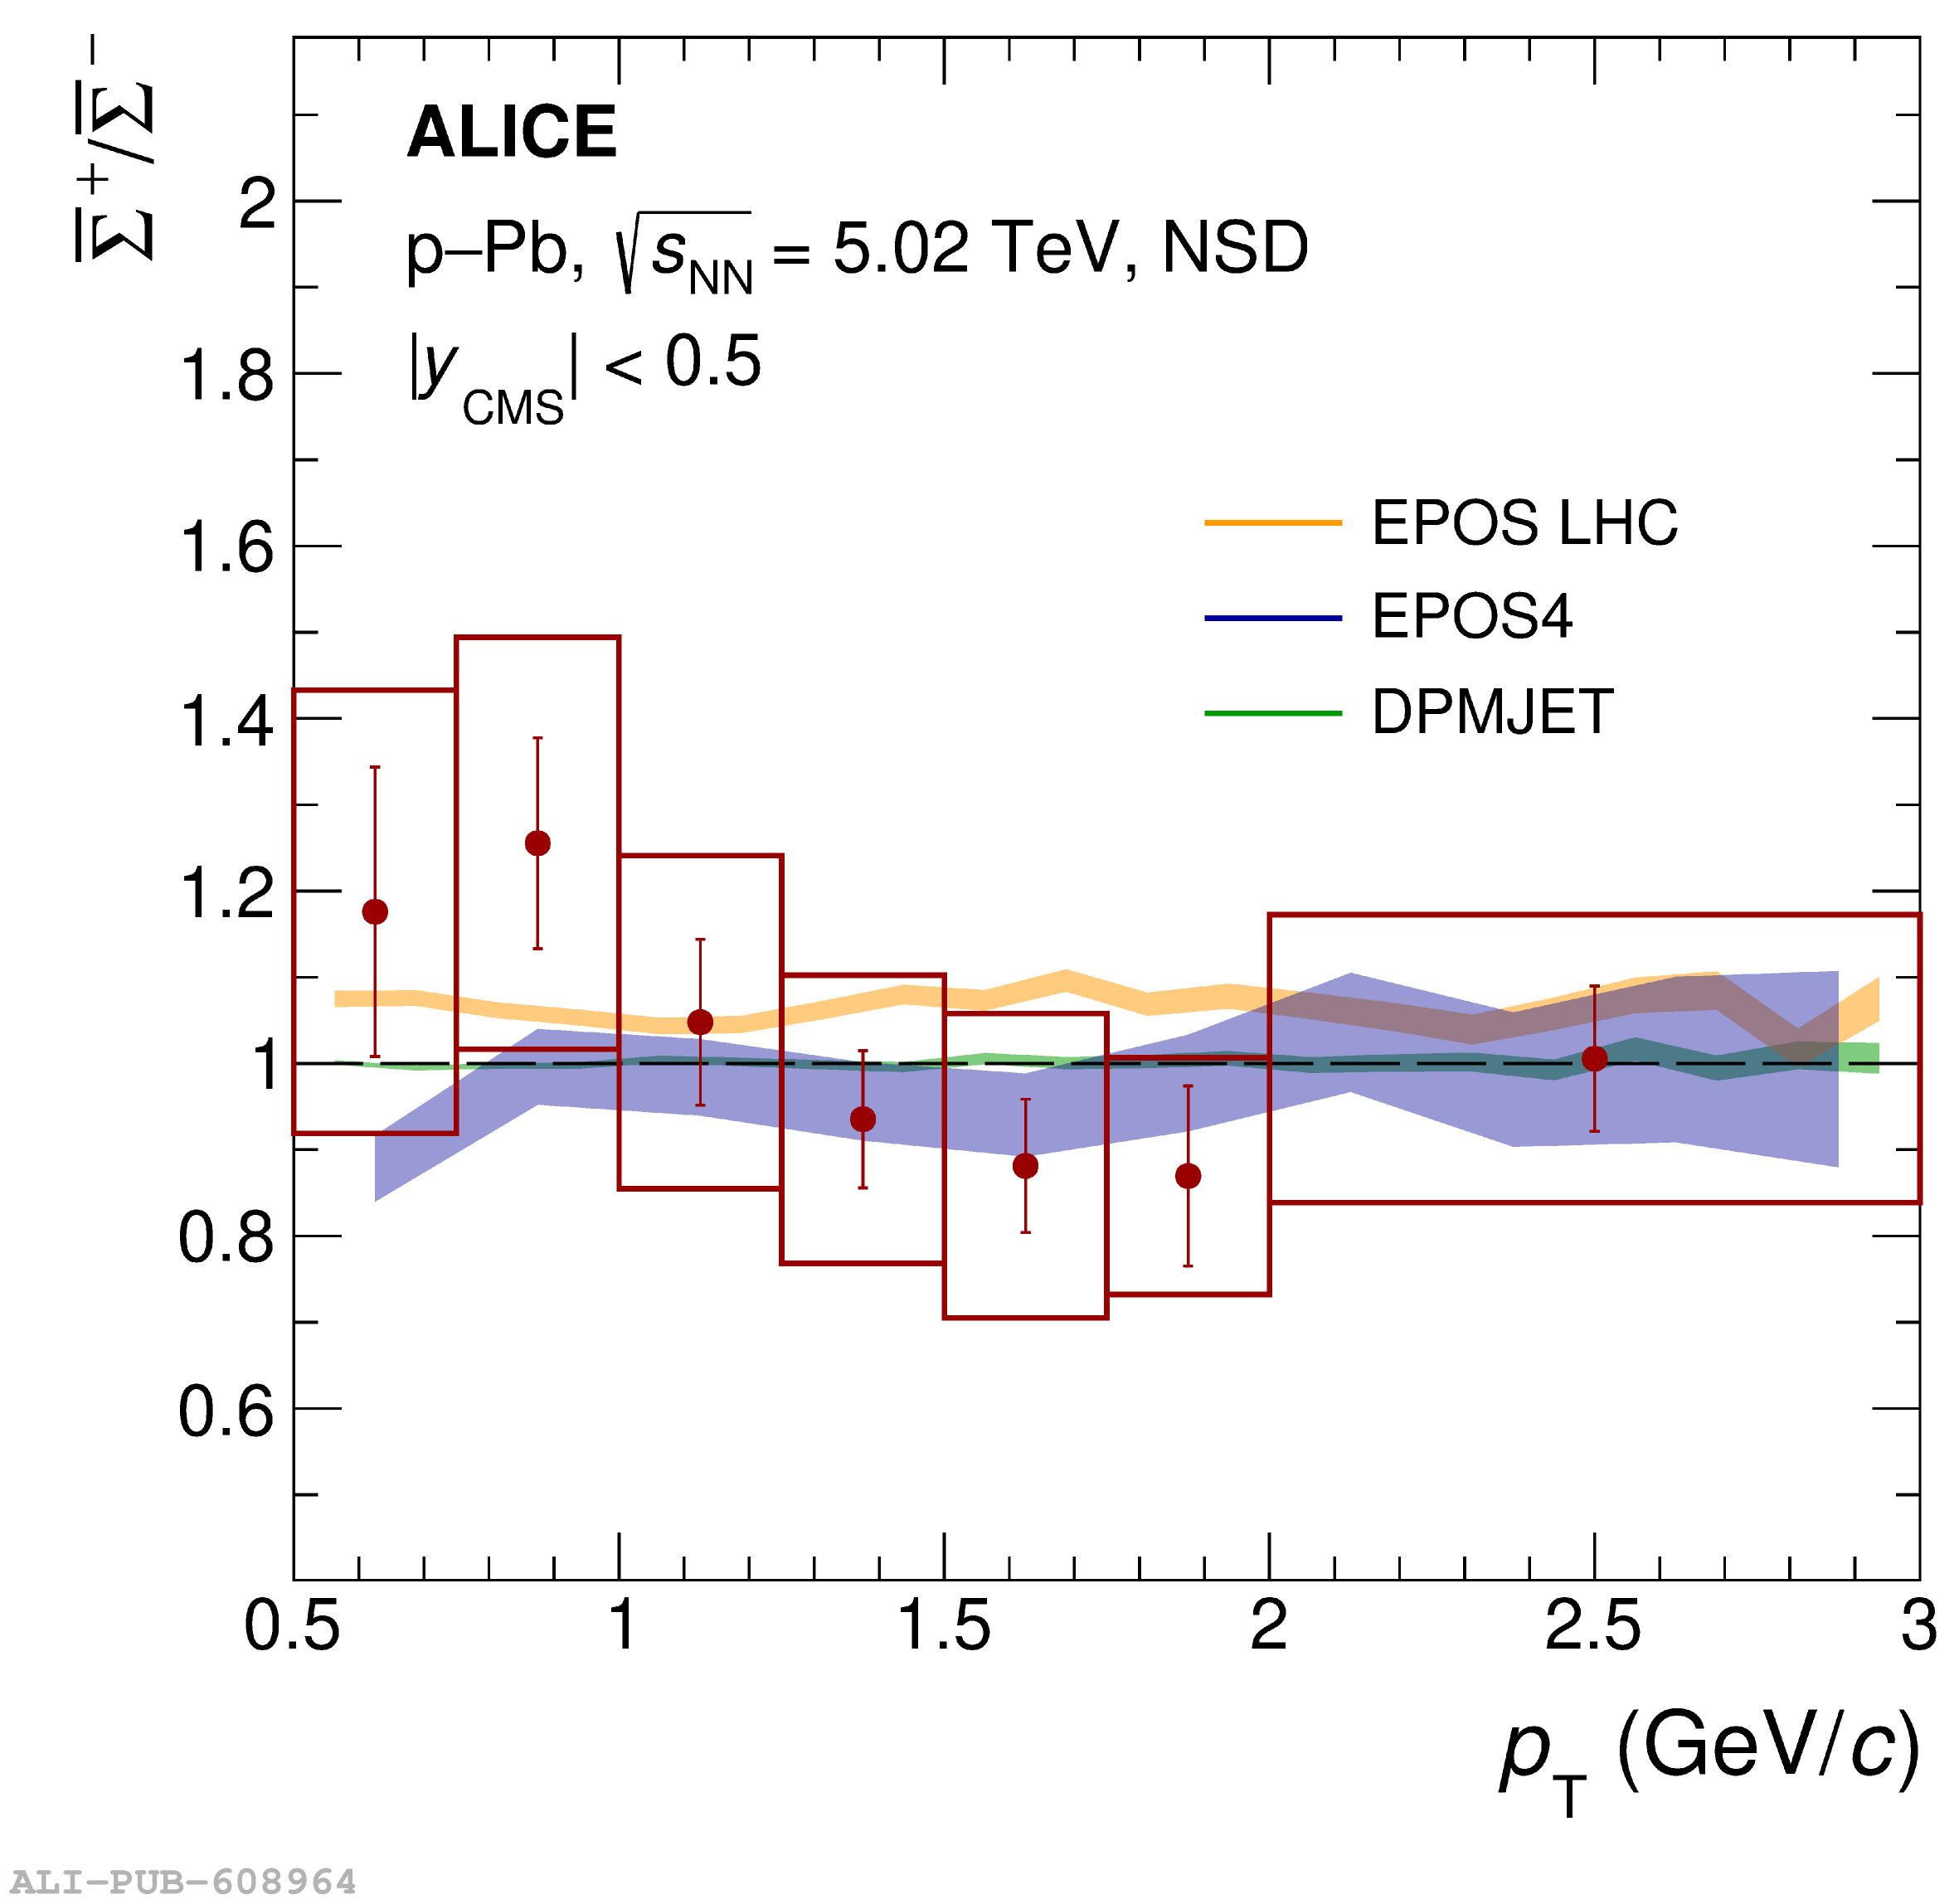
Figure 9
$p_{\rm{T}}$-differential ratios of $\overline{\Sigma}^{-}$, $\overline{\Sigma}^{+}$, $\Lambda$ and protons to pions, protons, and $\Lambda$ (in the case of p--Pb collisions) in pp (top row) and p--Pb (middle and bottom rows) collisions. In the ratios for p--Pb collisions, spectra in the denominator are taken in the rapidity range $-0.5$ $y_{\rm{CMS}}$ $0$. Ratios are compared to predictions of EPOS4 , DPMJET and PYTHIA 8 models. | 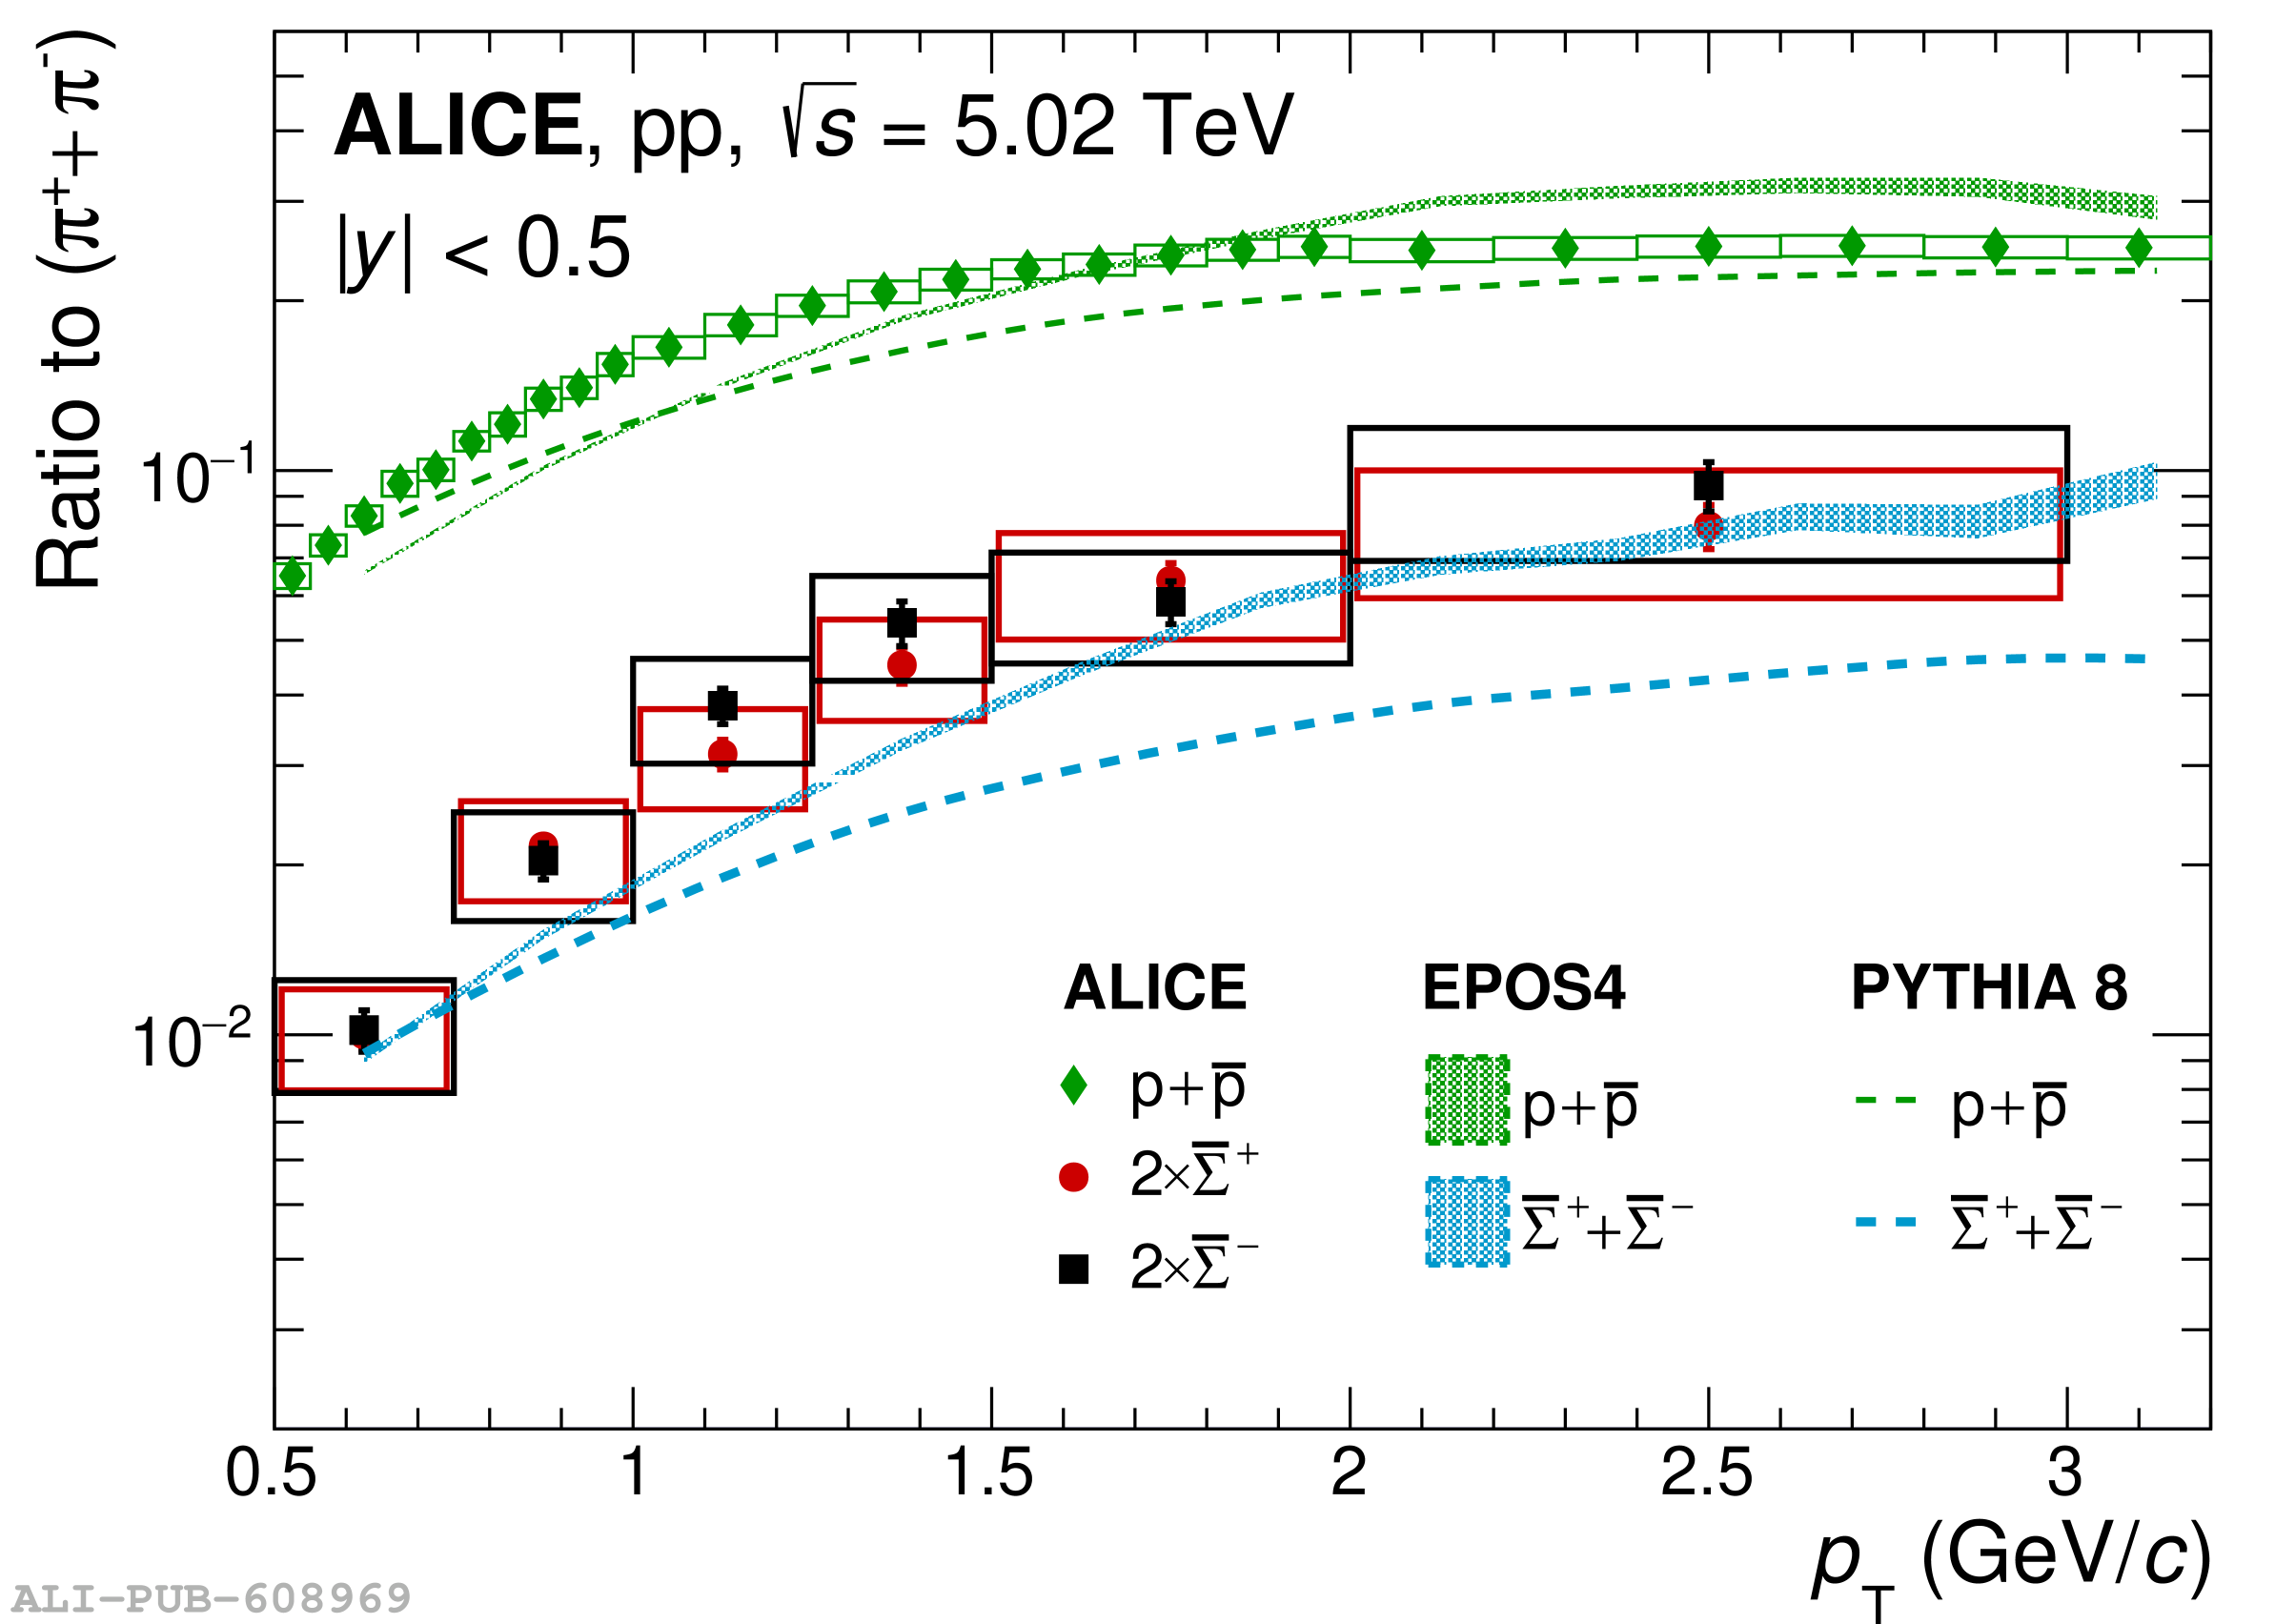 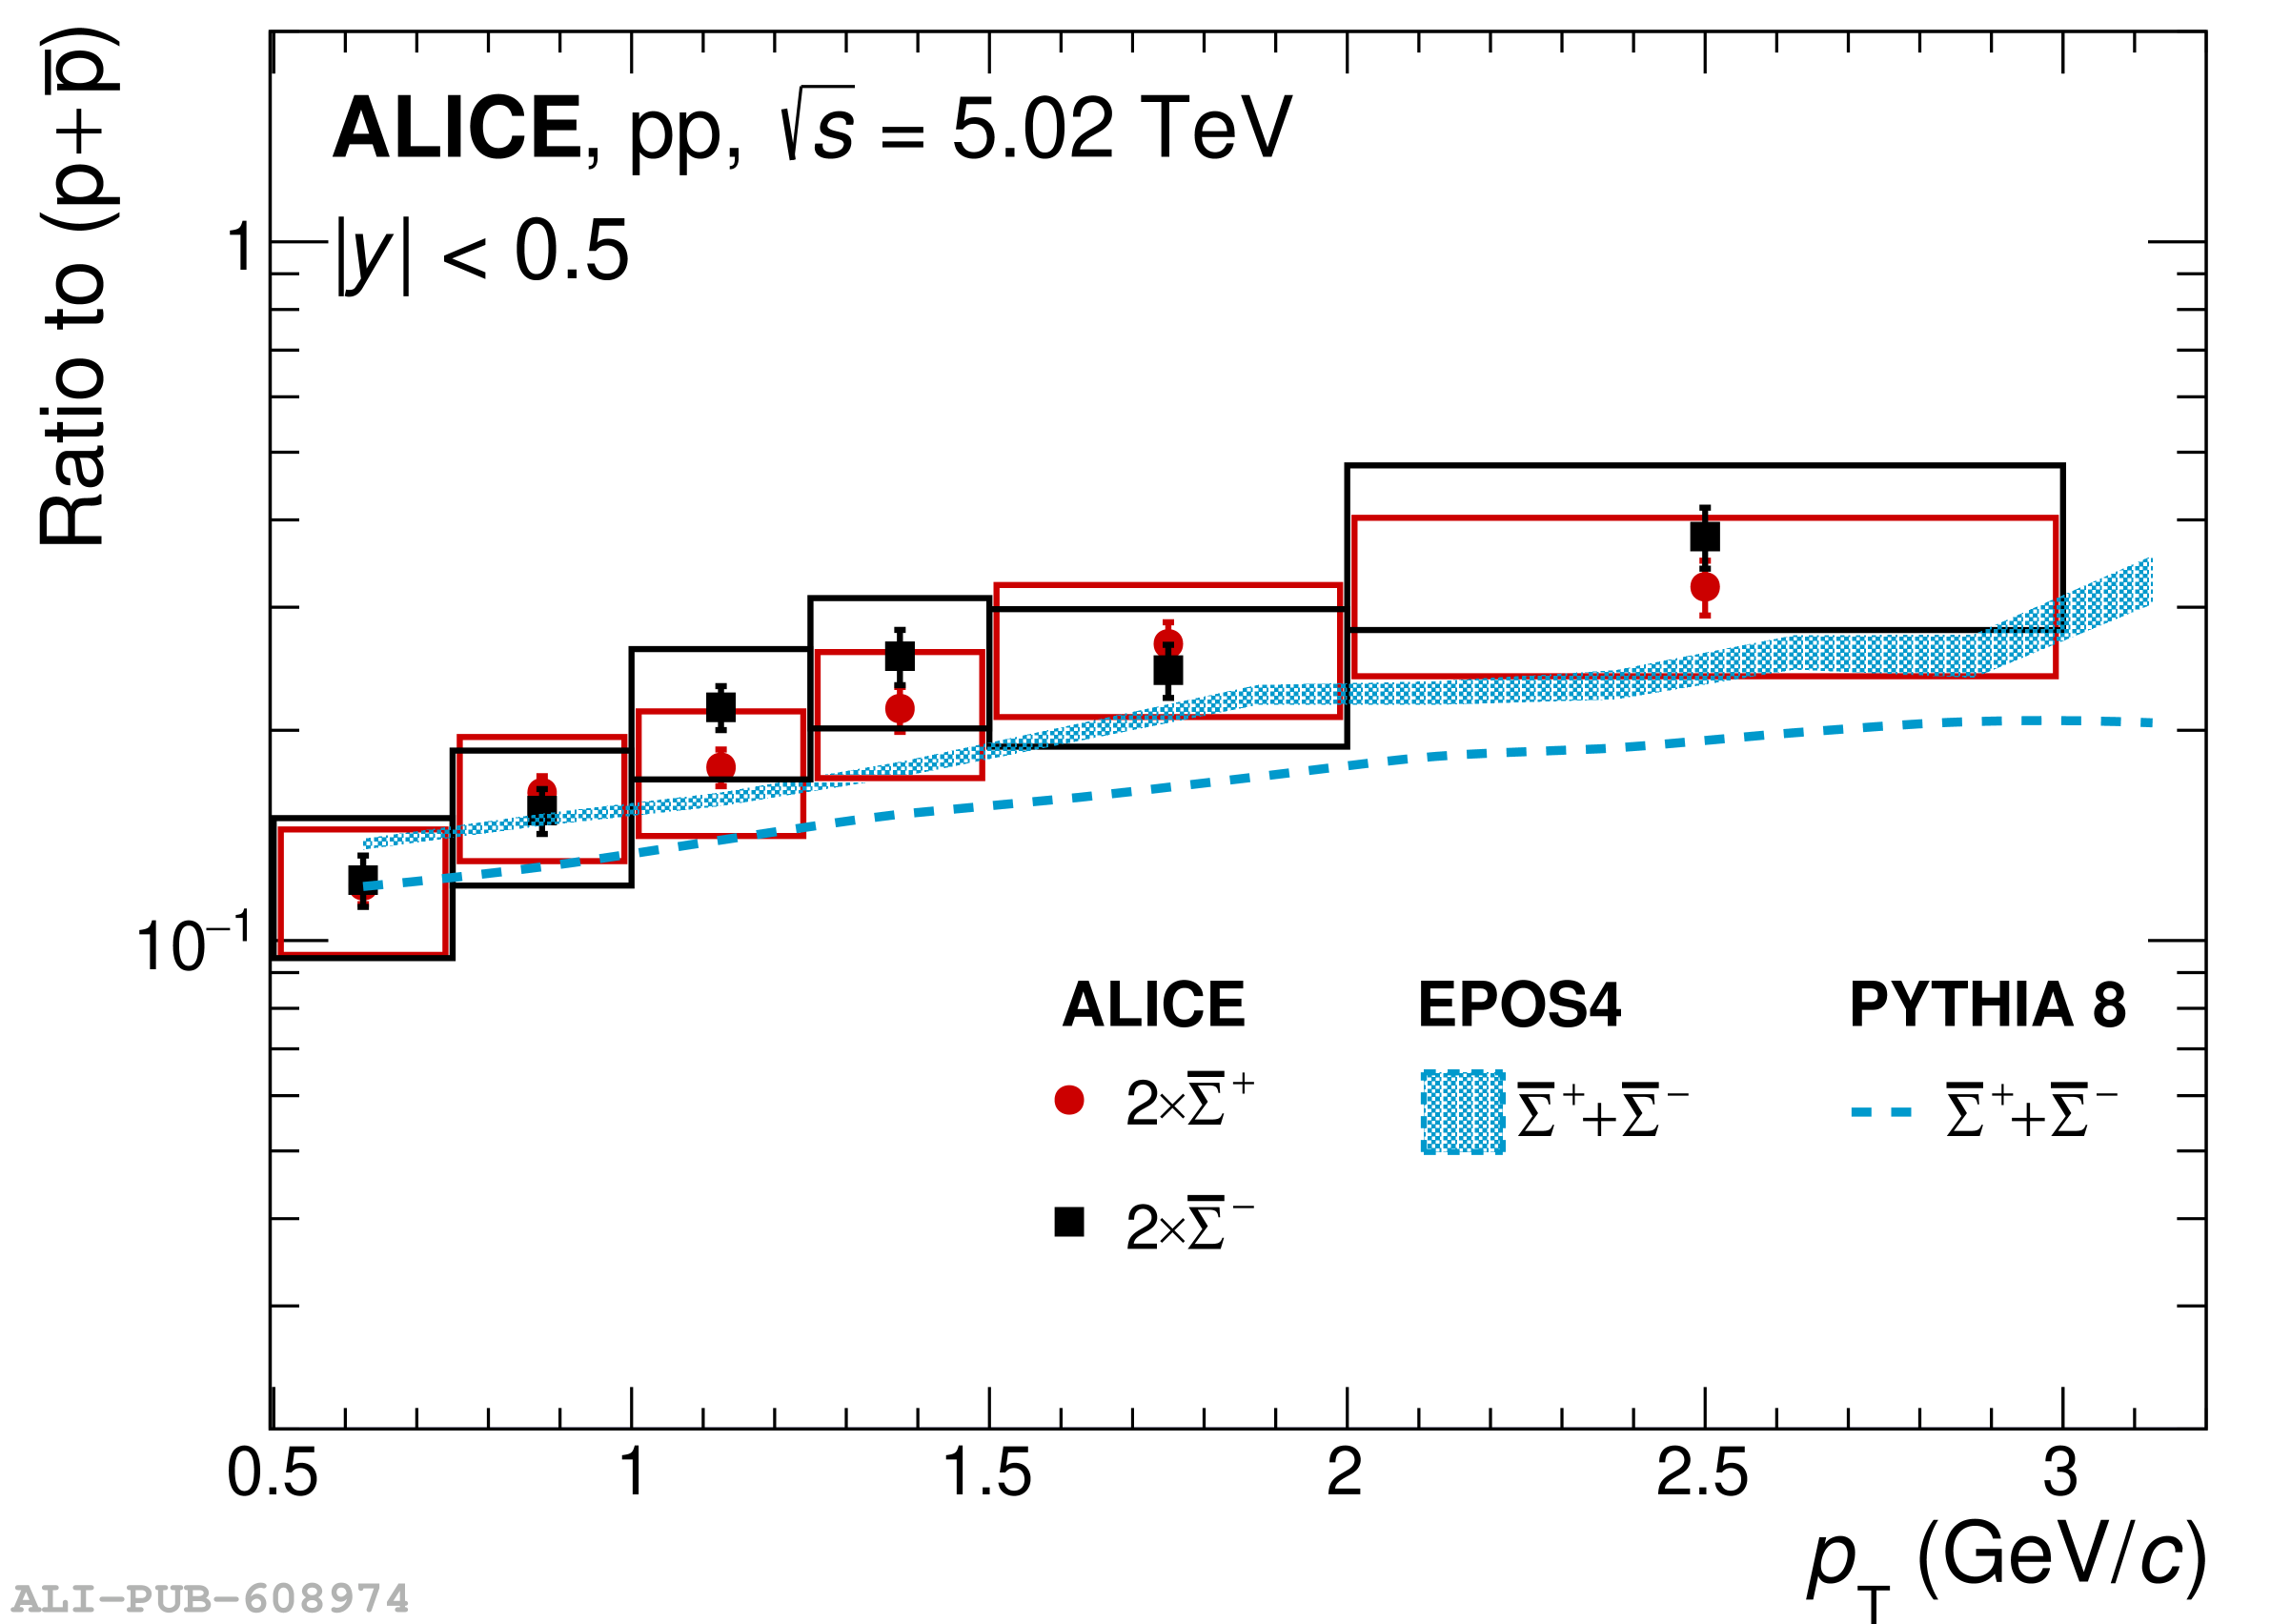 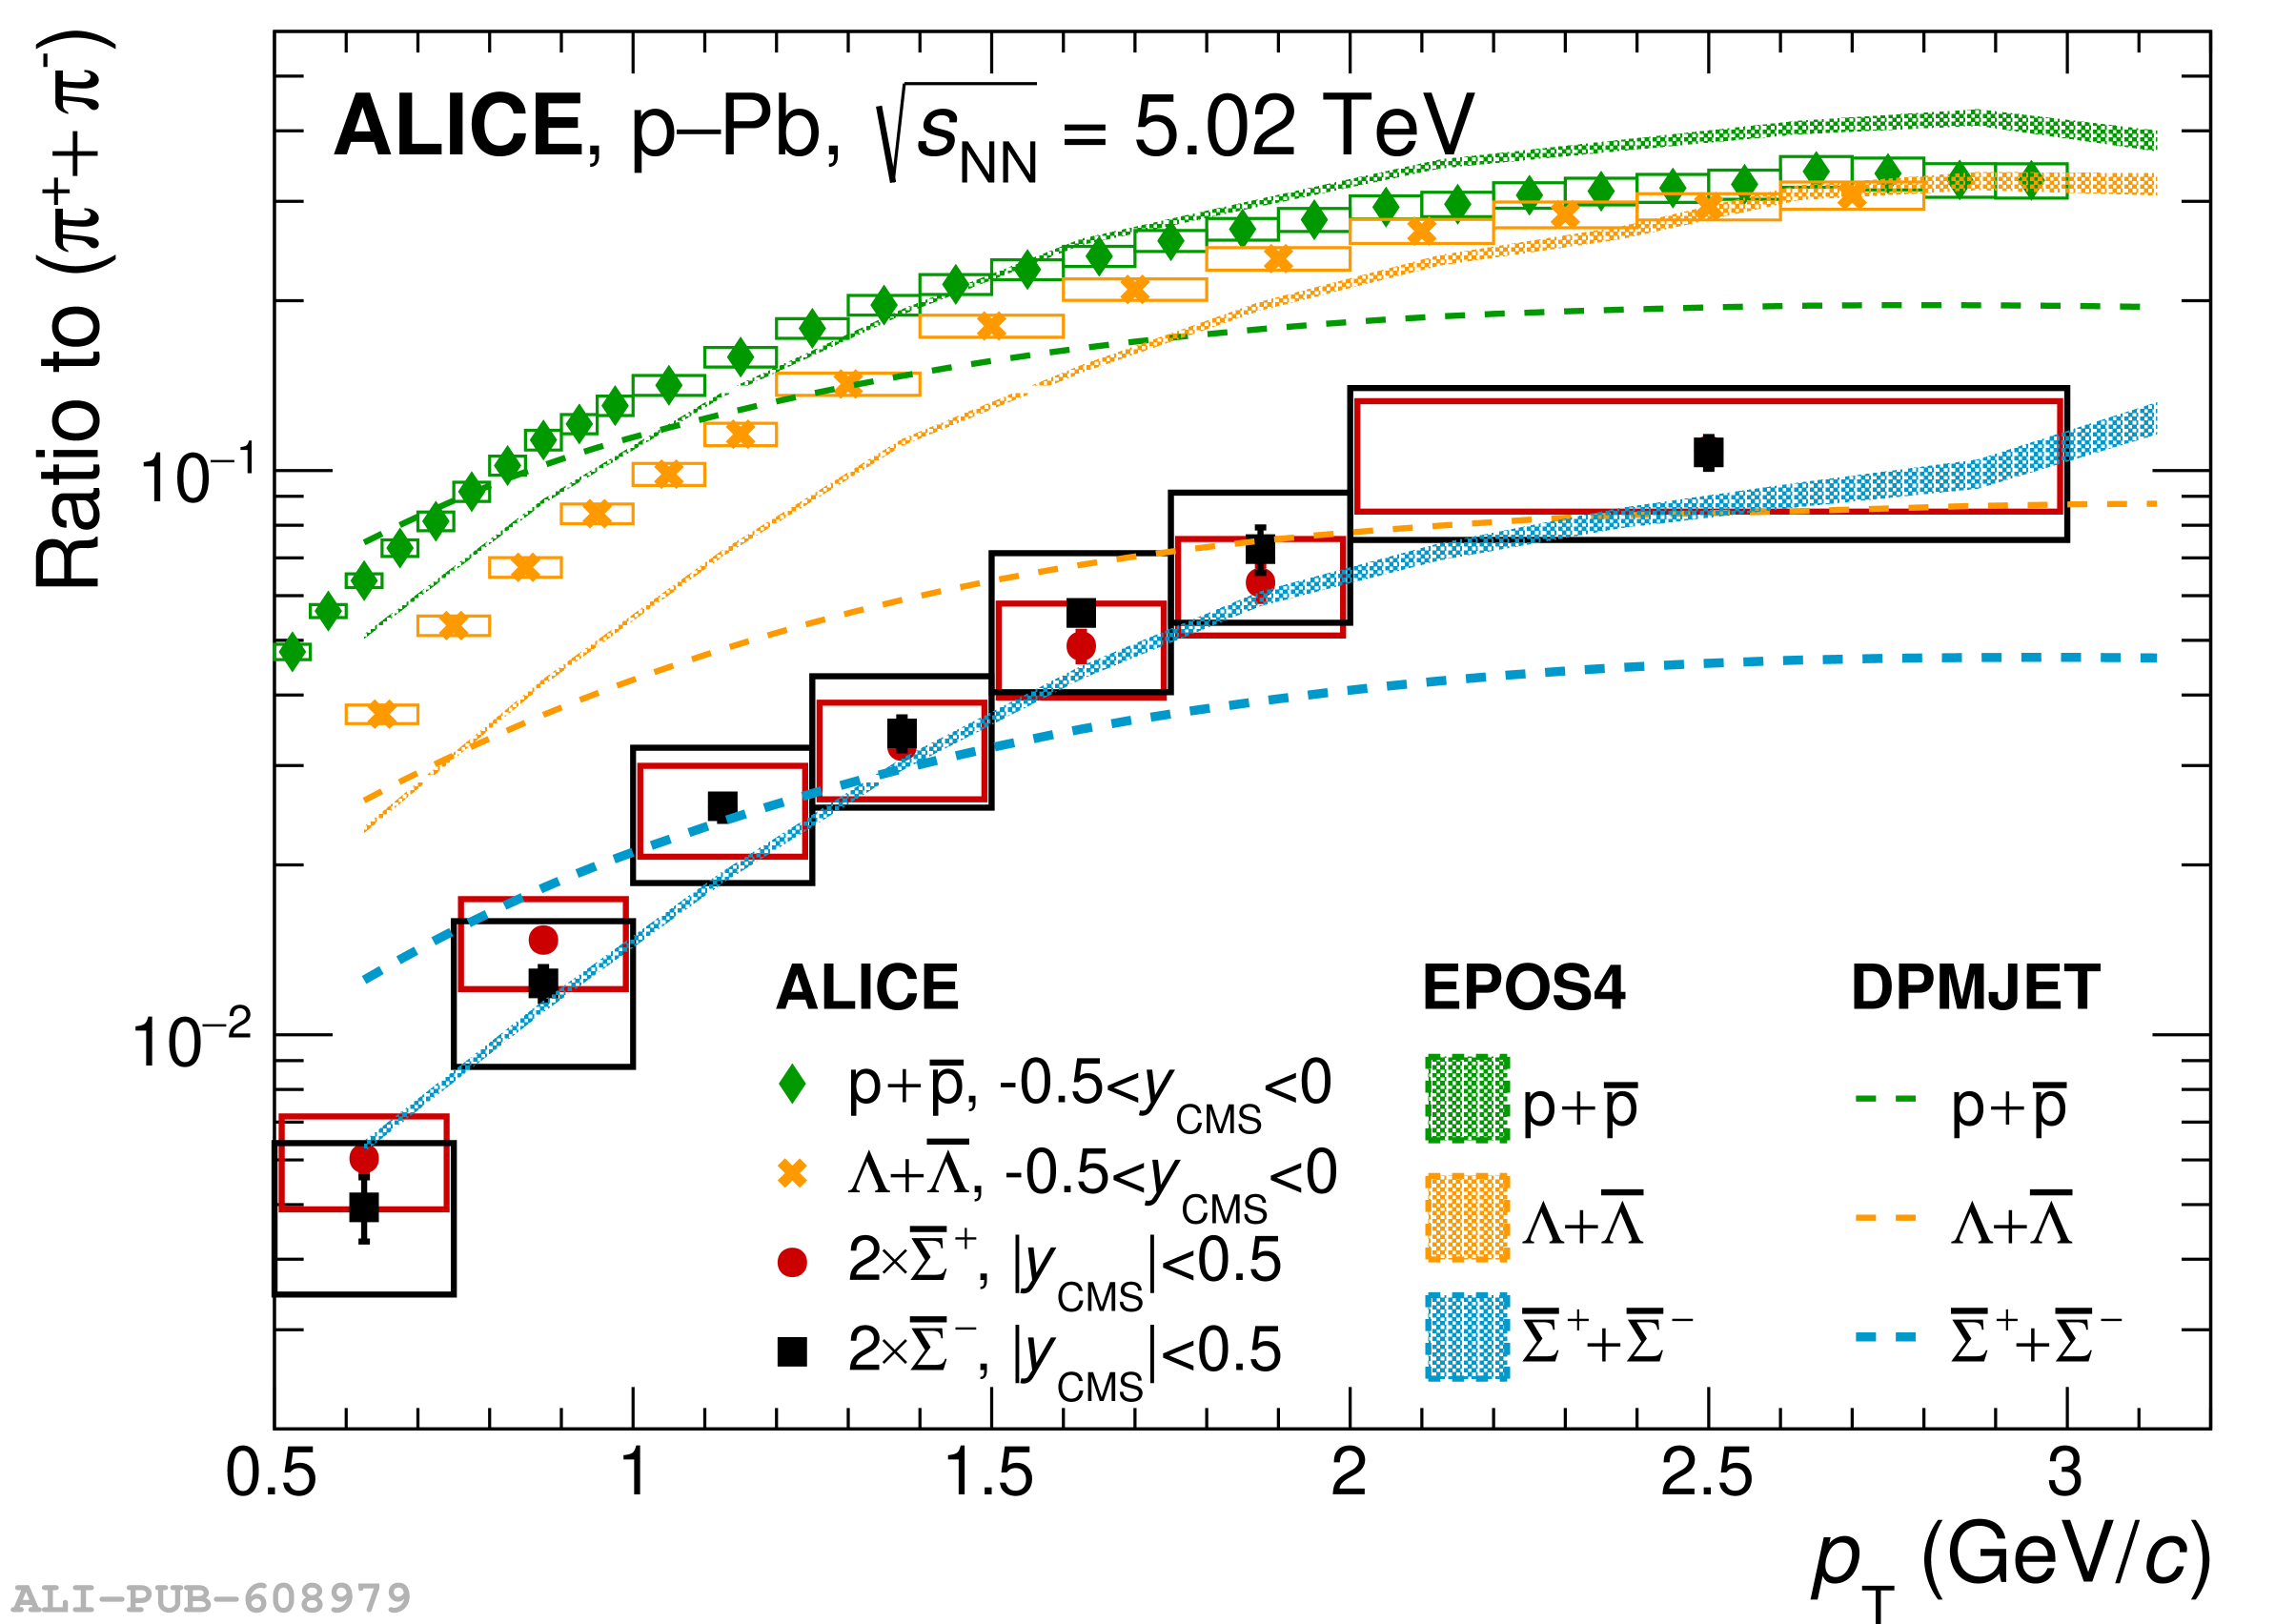 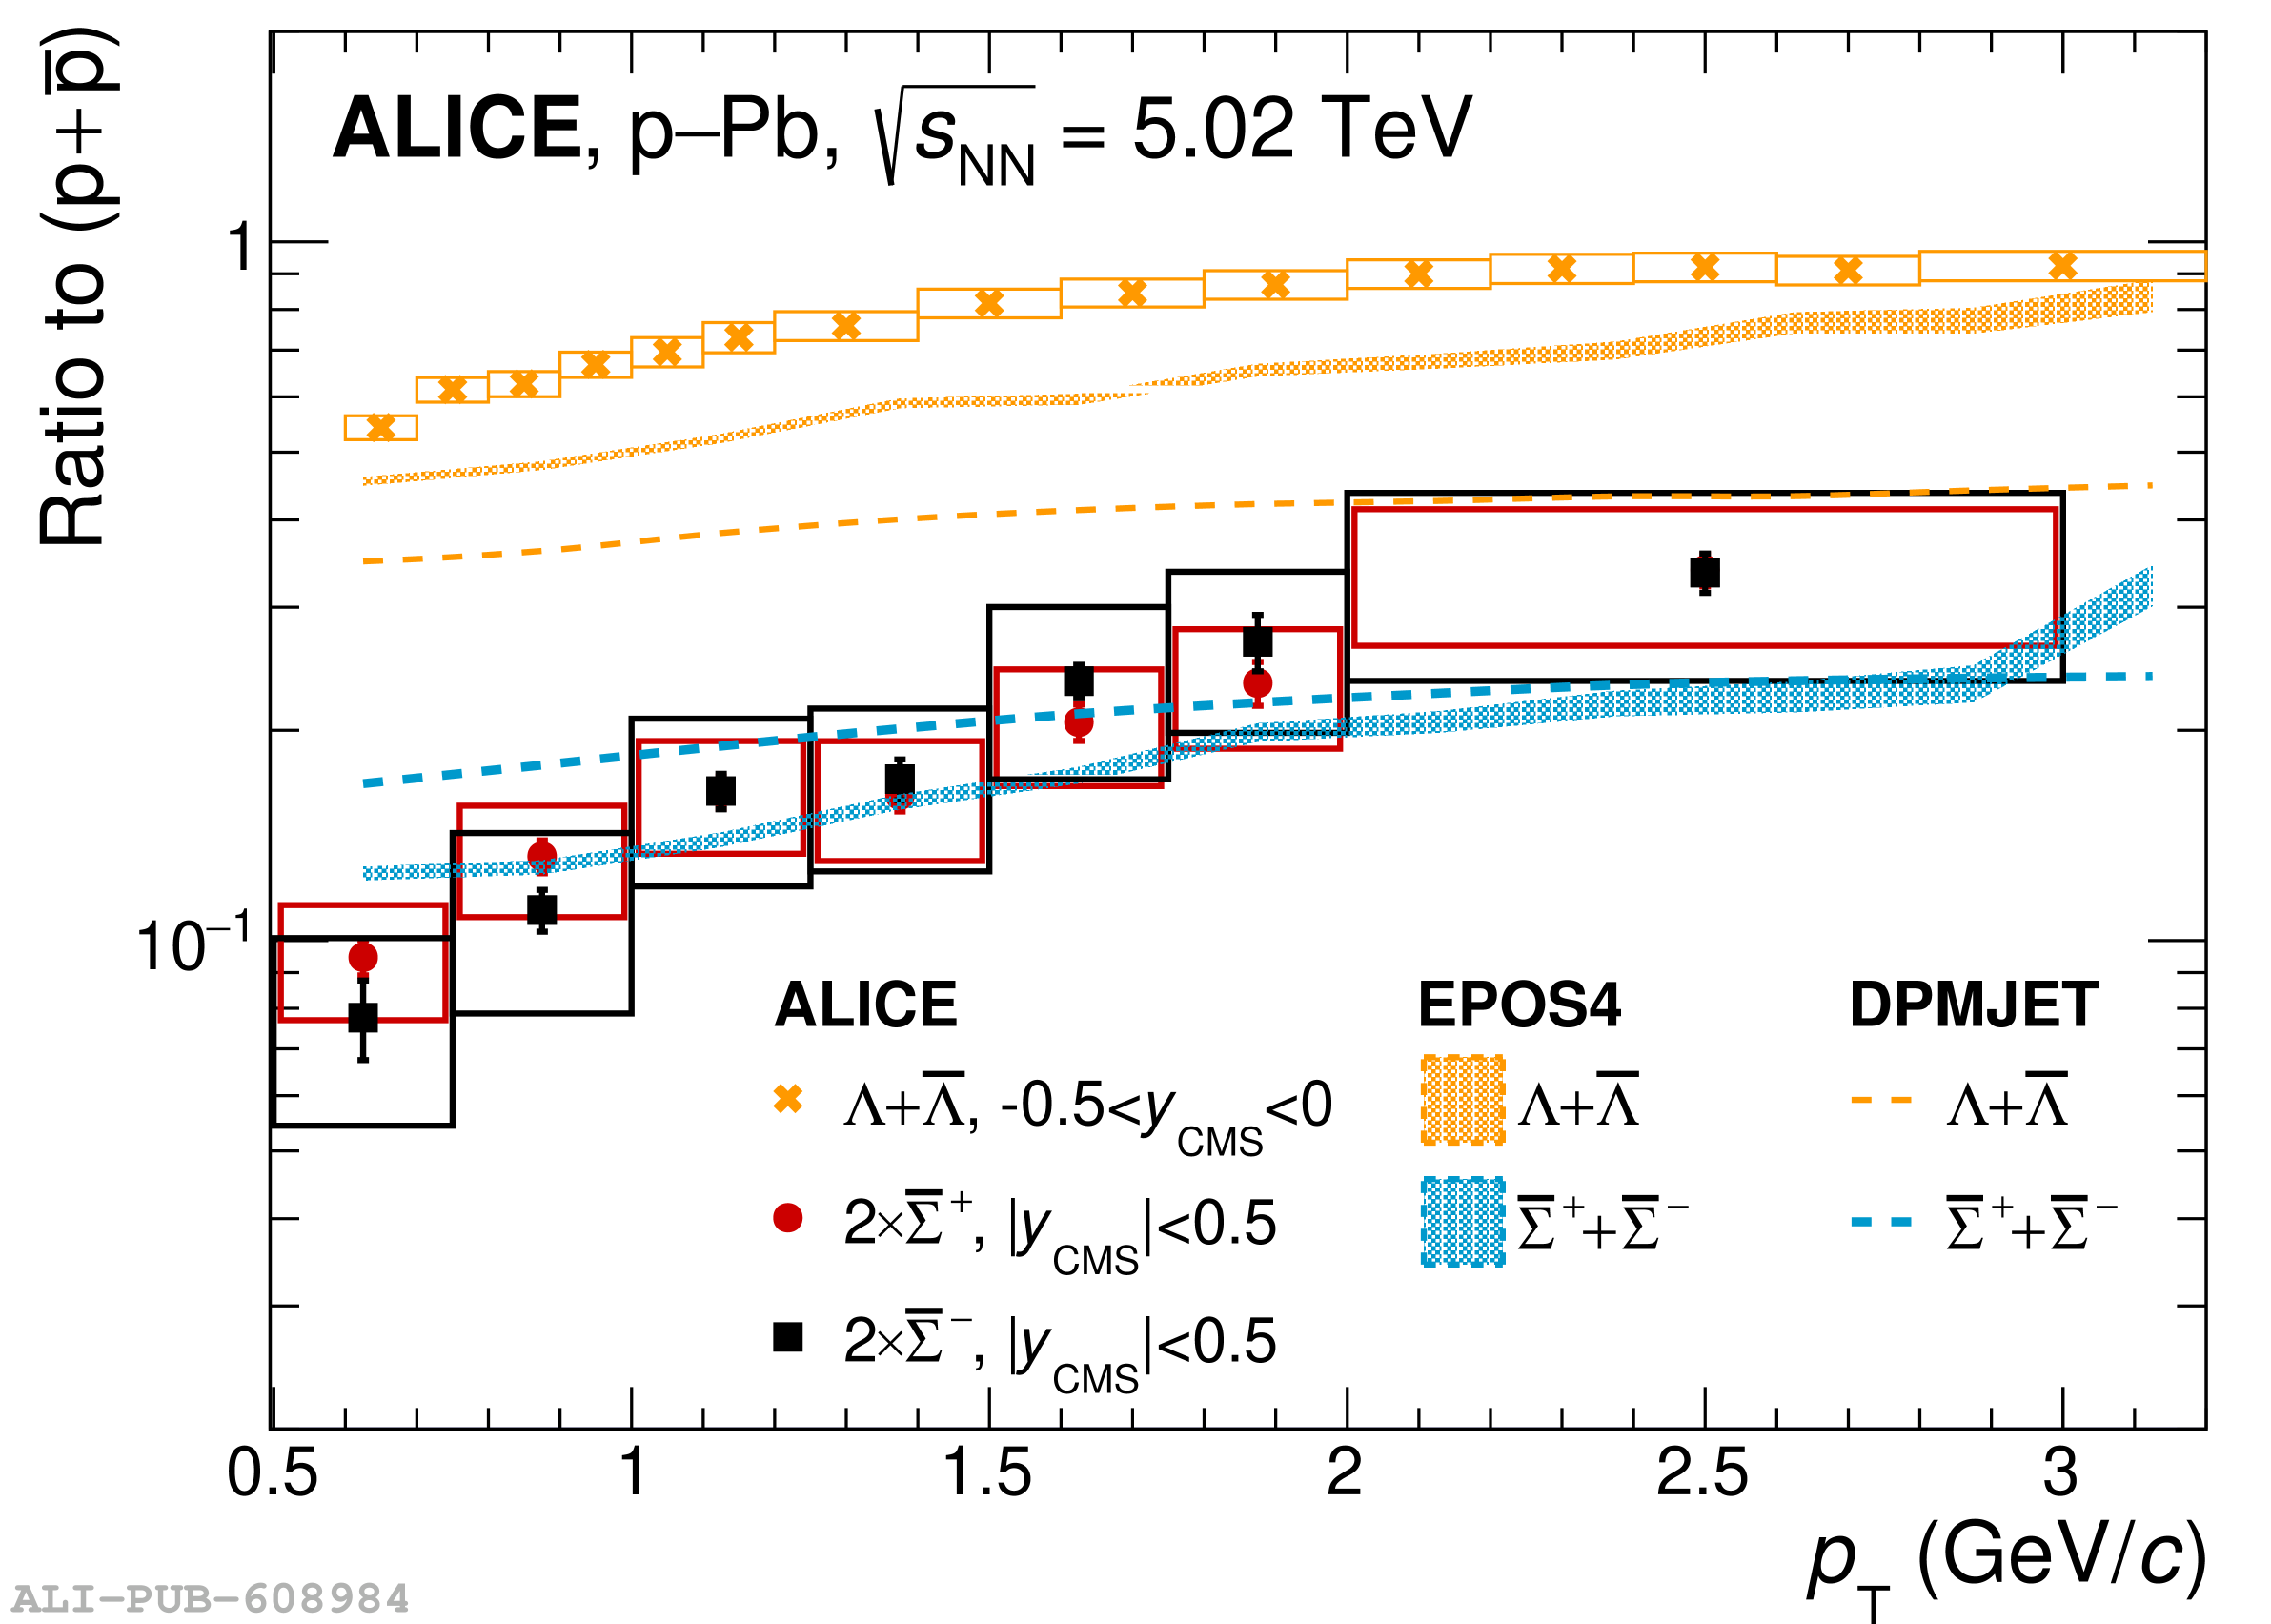 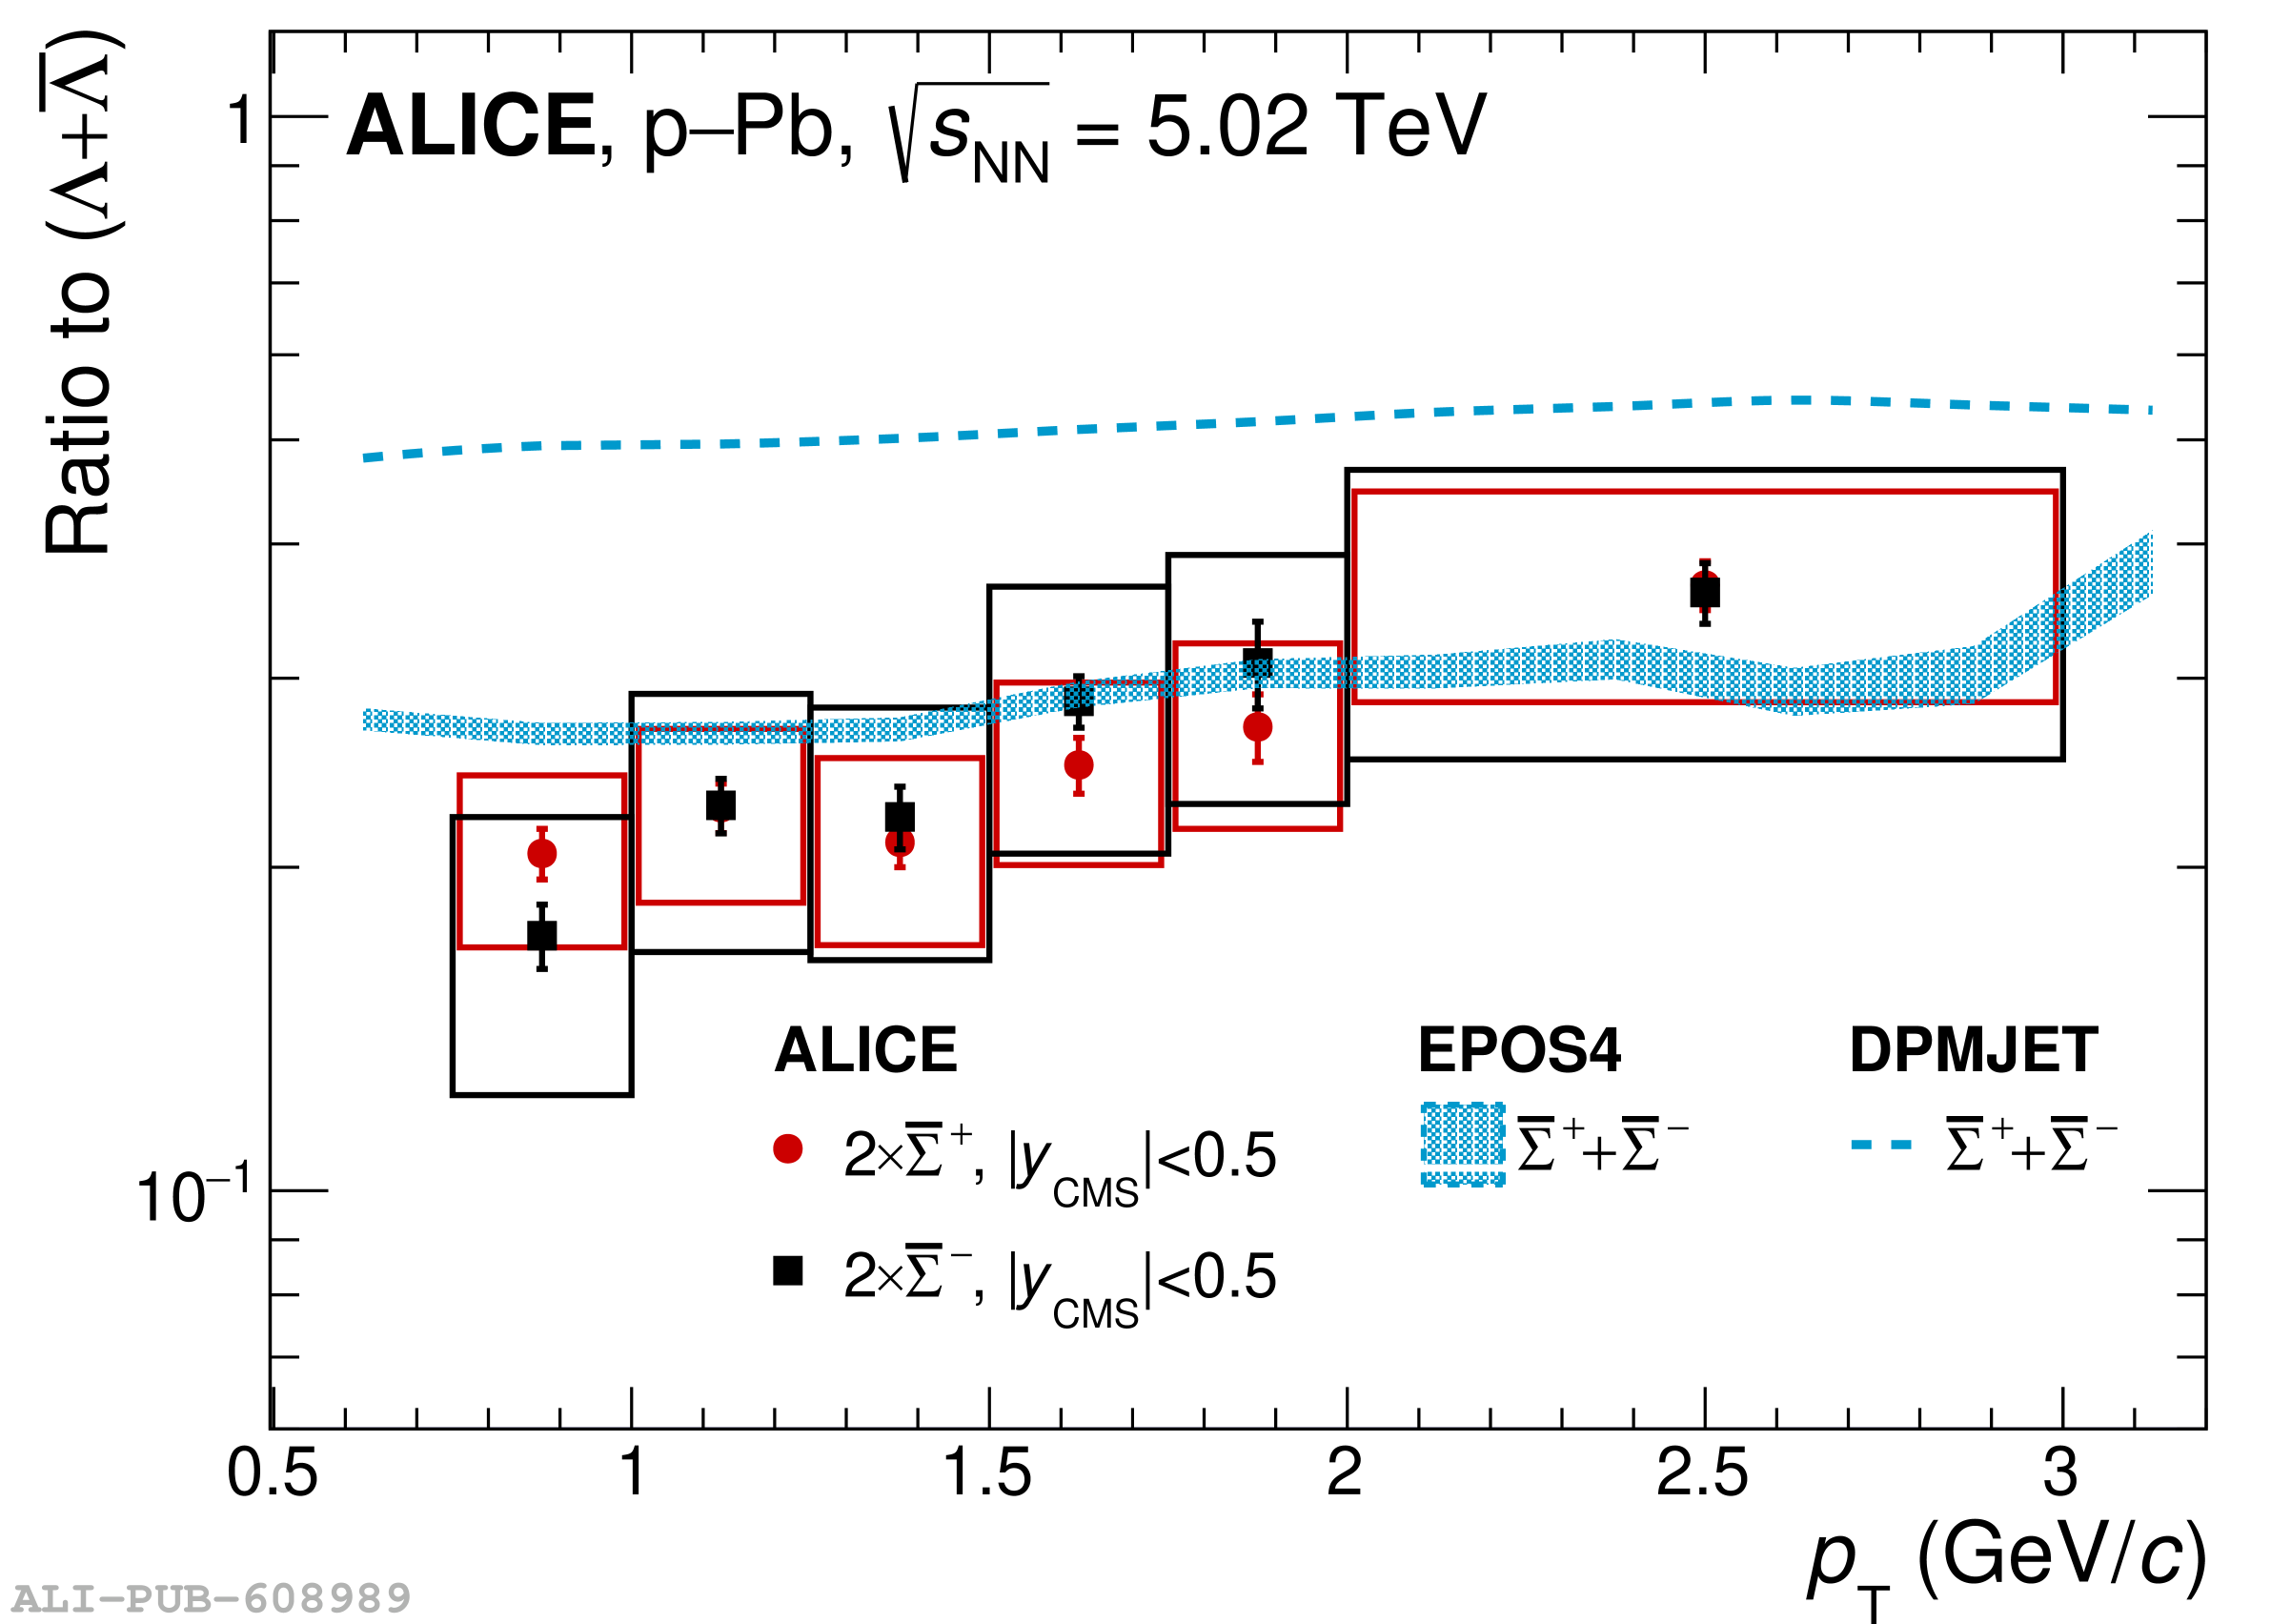 |
Figure 10
Comparison of ratios of integrated yields of different particle species as shown in Tab. \ref{tab:ratios} ($\overline{\Sigma}^{-}$ and $\overline{\Sigma}^{+}$ yields are combined). Ratios are compared to predictions of EPOS LHC and EPOS4 , PHOJET and DPMJET , PYTHIA 8 , and Thermal-FIST models. | 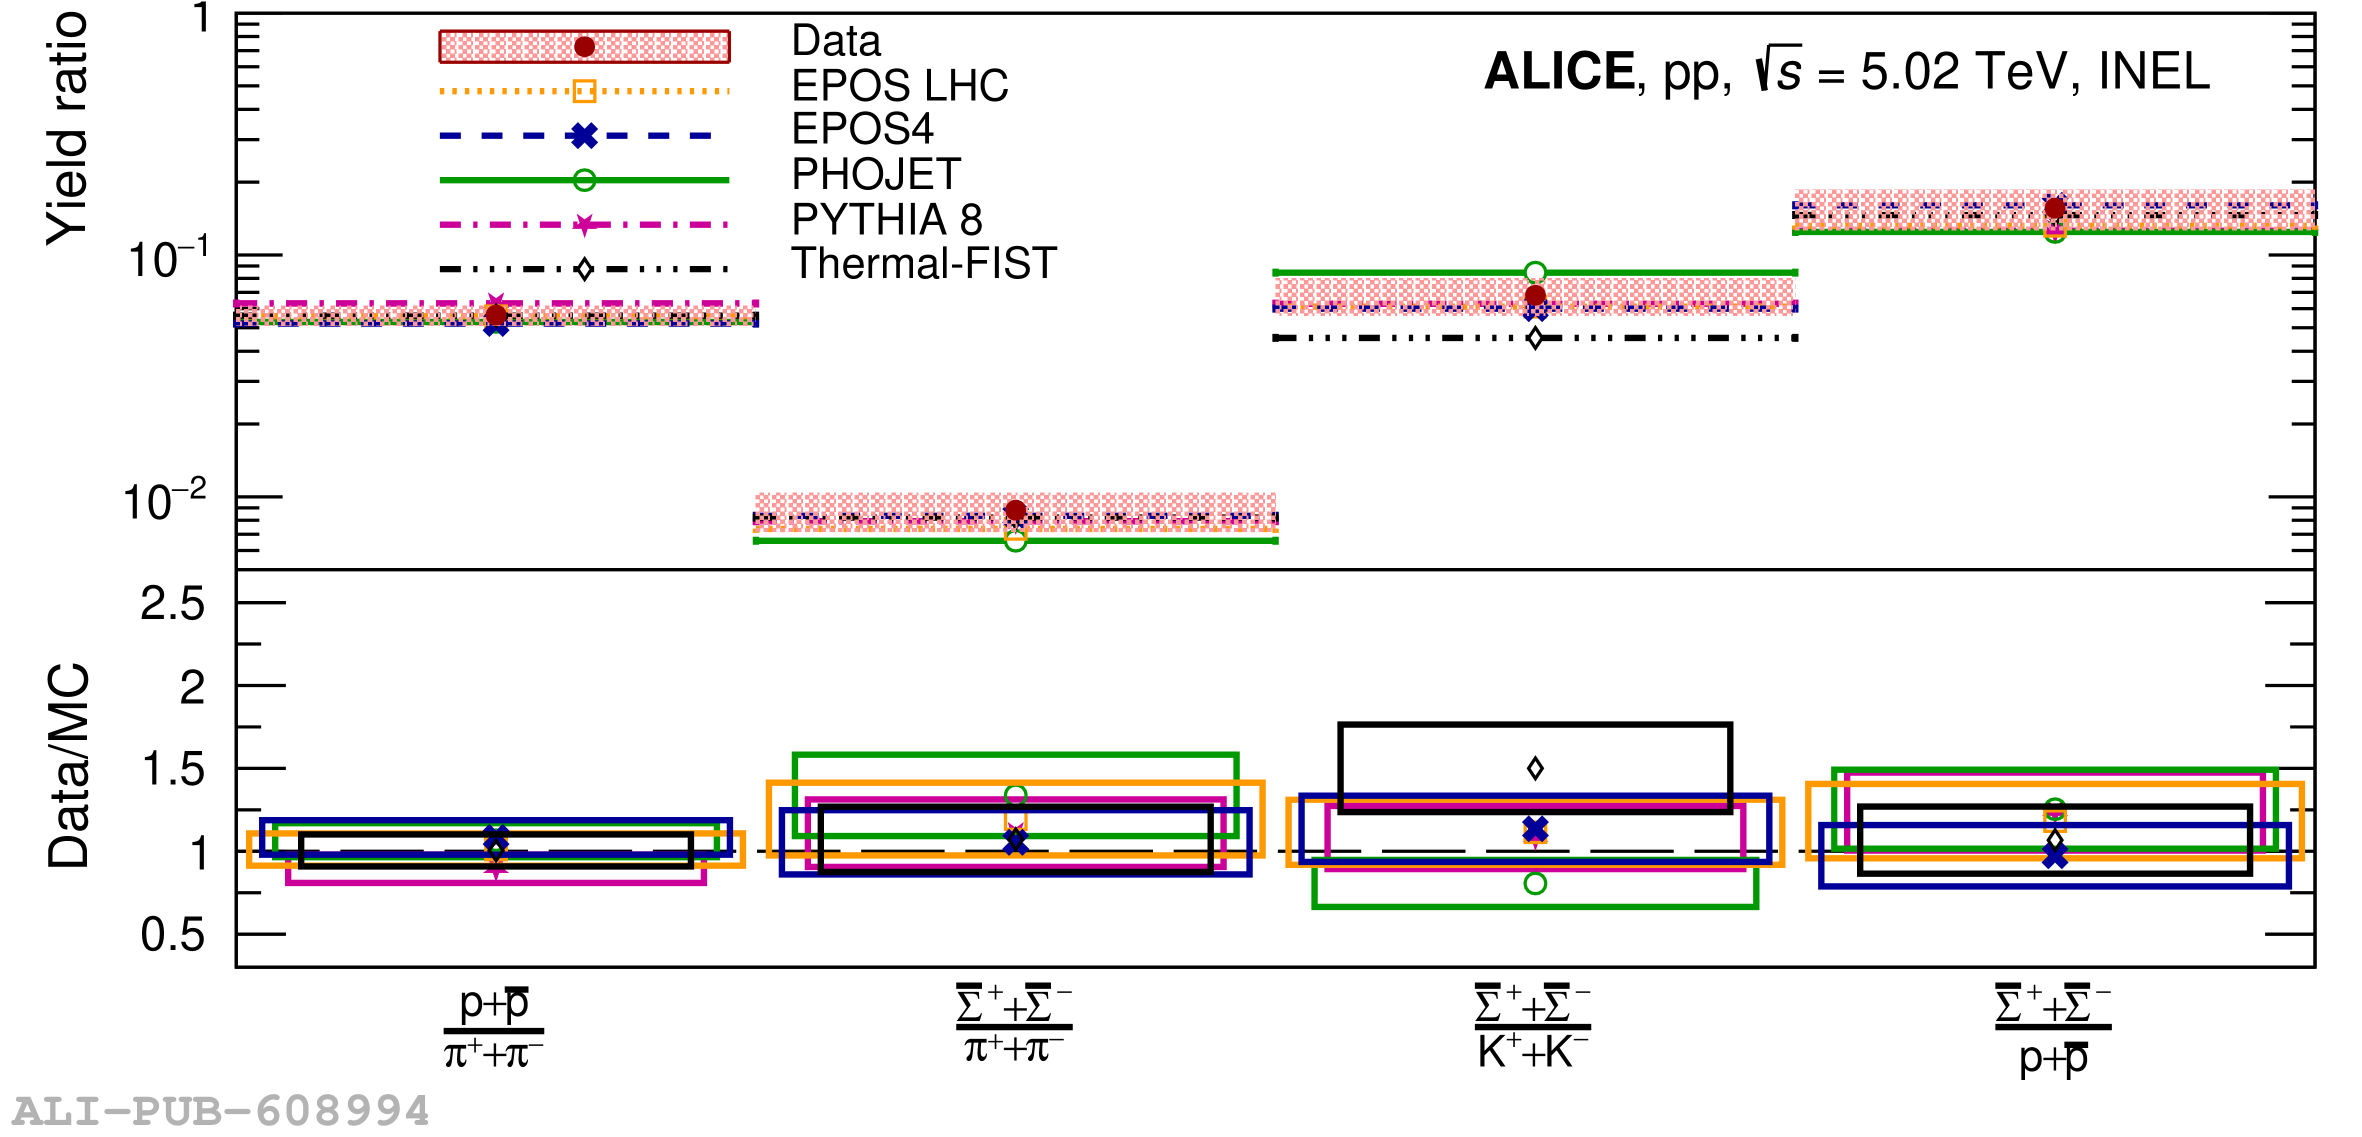 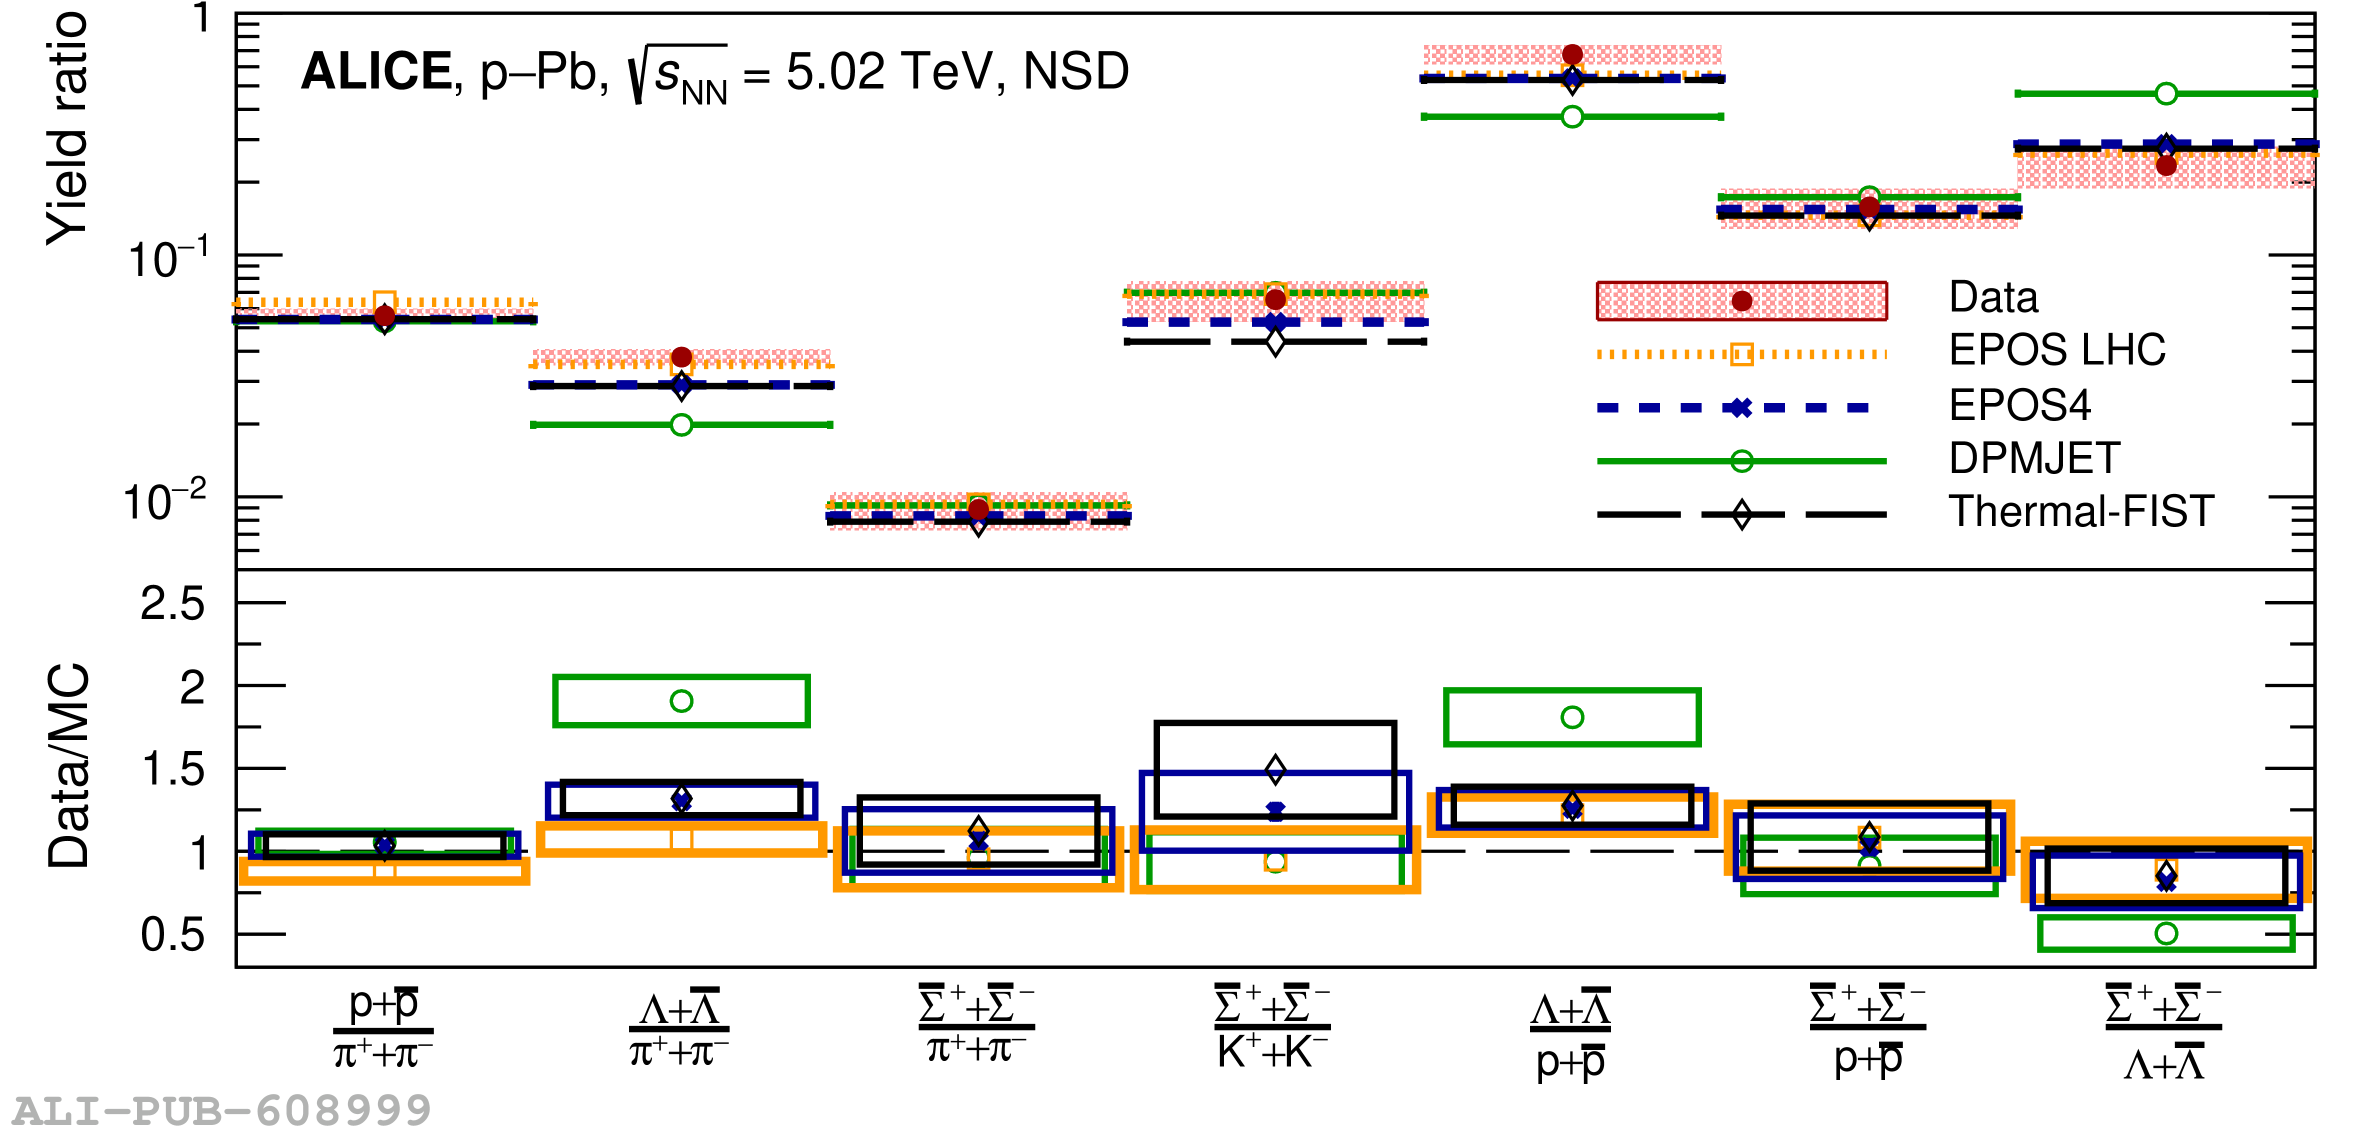 |