Heavy-flavor quarks produced in proton--proton (pp) collisions provide a unique opportunity to investigate the evolution of quark-initiated parton showers from initial hard scatterings to final-state hadrons. By examining jets that contain heavy-flavor hadrons, this study explores the effects of both perturbative and non-perturbative QCD on jet formation and structure. The angular differences between various jet axes, $ΔR_{\rm axis}$, offer insight into the radiation patterns and fragmentation of charm quarks. The first measurement of D$^{0}$-tagged jet axes differences in pp collisions at $\sqrt{s}=5.02$ TeV by the ALICE experiment at the LHC is presented for jets with transverse momentum $p_{\rm T}^{\rm ch~jet} \geq 10$ ${\rm GeV}/c$ and D$^0$ mesons with $p_{\rm T}^{\rm D^{0}} \geq 5$ ${\rm GeV}/c$. In this D$^0$-meson-tagged jet measurement, three jet axis definitions, each with different sensitivities to soft, wide-angle radiation, are used: the Standard axis, Soft Drop groomed axis, and Winner-Takes-All axis. Measurements of the radial distributions of D$^0$ mesons with respect to the jet axes, $ΔR_{\mathrm{axis-D^0}}$, are reported, along with the angle, $ΔR_{\mathrm{axis}}$, between the three jet axes. The D$^{0}$ meson emerges as the leading particle in these jets, closely aligning with the Winner-Takes-All axis and diverging from the Standard jet axis. The results also examine how varying the sensitivity to soft radiation with grooming influences the orientation of the Soft Drop jet axis, and uncover that charm-jet structure is more likely to survive grooming when the Soft Drop axis is further from the D$^{0}$ direction, providing further evidence of the dead-cone effect recently measured by ALICE.
Phys. Rev. D 112 (2025) 092012
HEP Data
e-Print: arXiv:2504.02571 | PDF | inSPIRE
CERN-EP-2025-083
Figure group
Figure 1
A representation of the different jet axes; Standard (STD), Soft Drop (SD), and Winner-Takes-All (WTA). The axis of the jet containing the D$^0$ meson (shown in solid black) and all gluonic radiation is referred to as the Standard axis. The Winner-Takes-All axis is also determined from this initial jet sample but aligns with the hardest subject at each clustering step. Grooming away softer radiation leaves a jet with the Soft Drop axis, defined by the remaining higher-momentum particles. Representations for the six $\Delta R_{\rm axis}$ observables are shown in the right of the figure. | 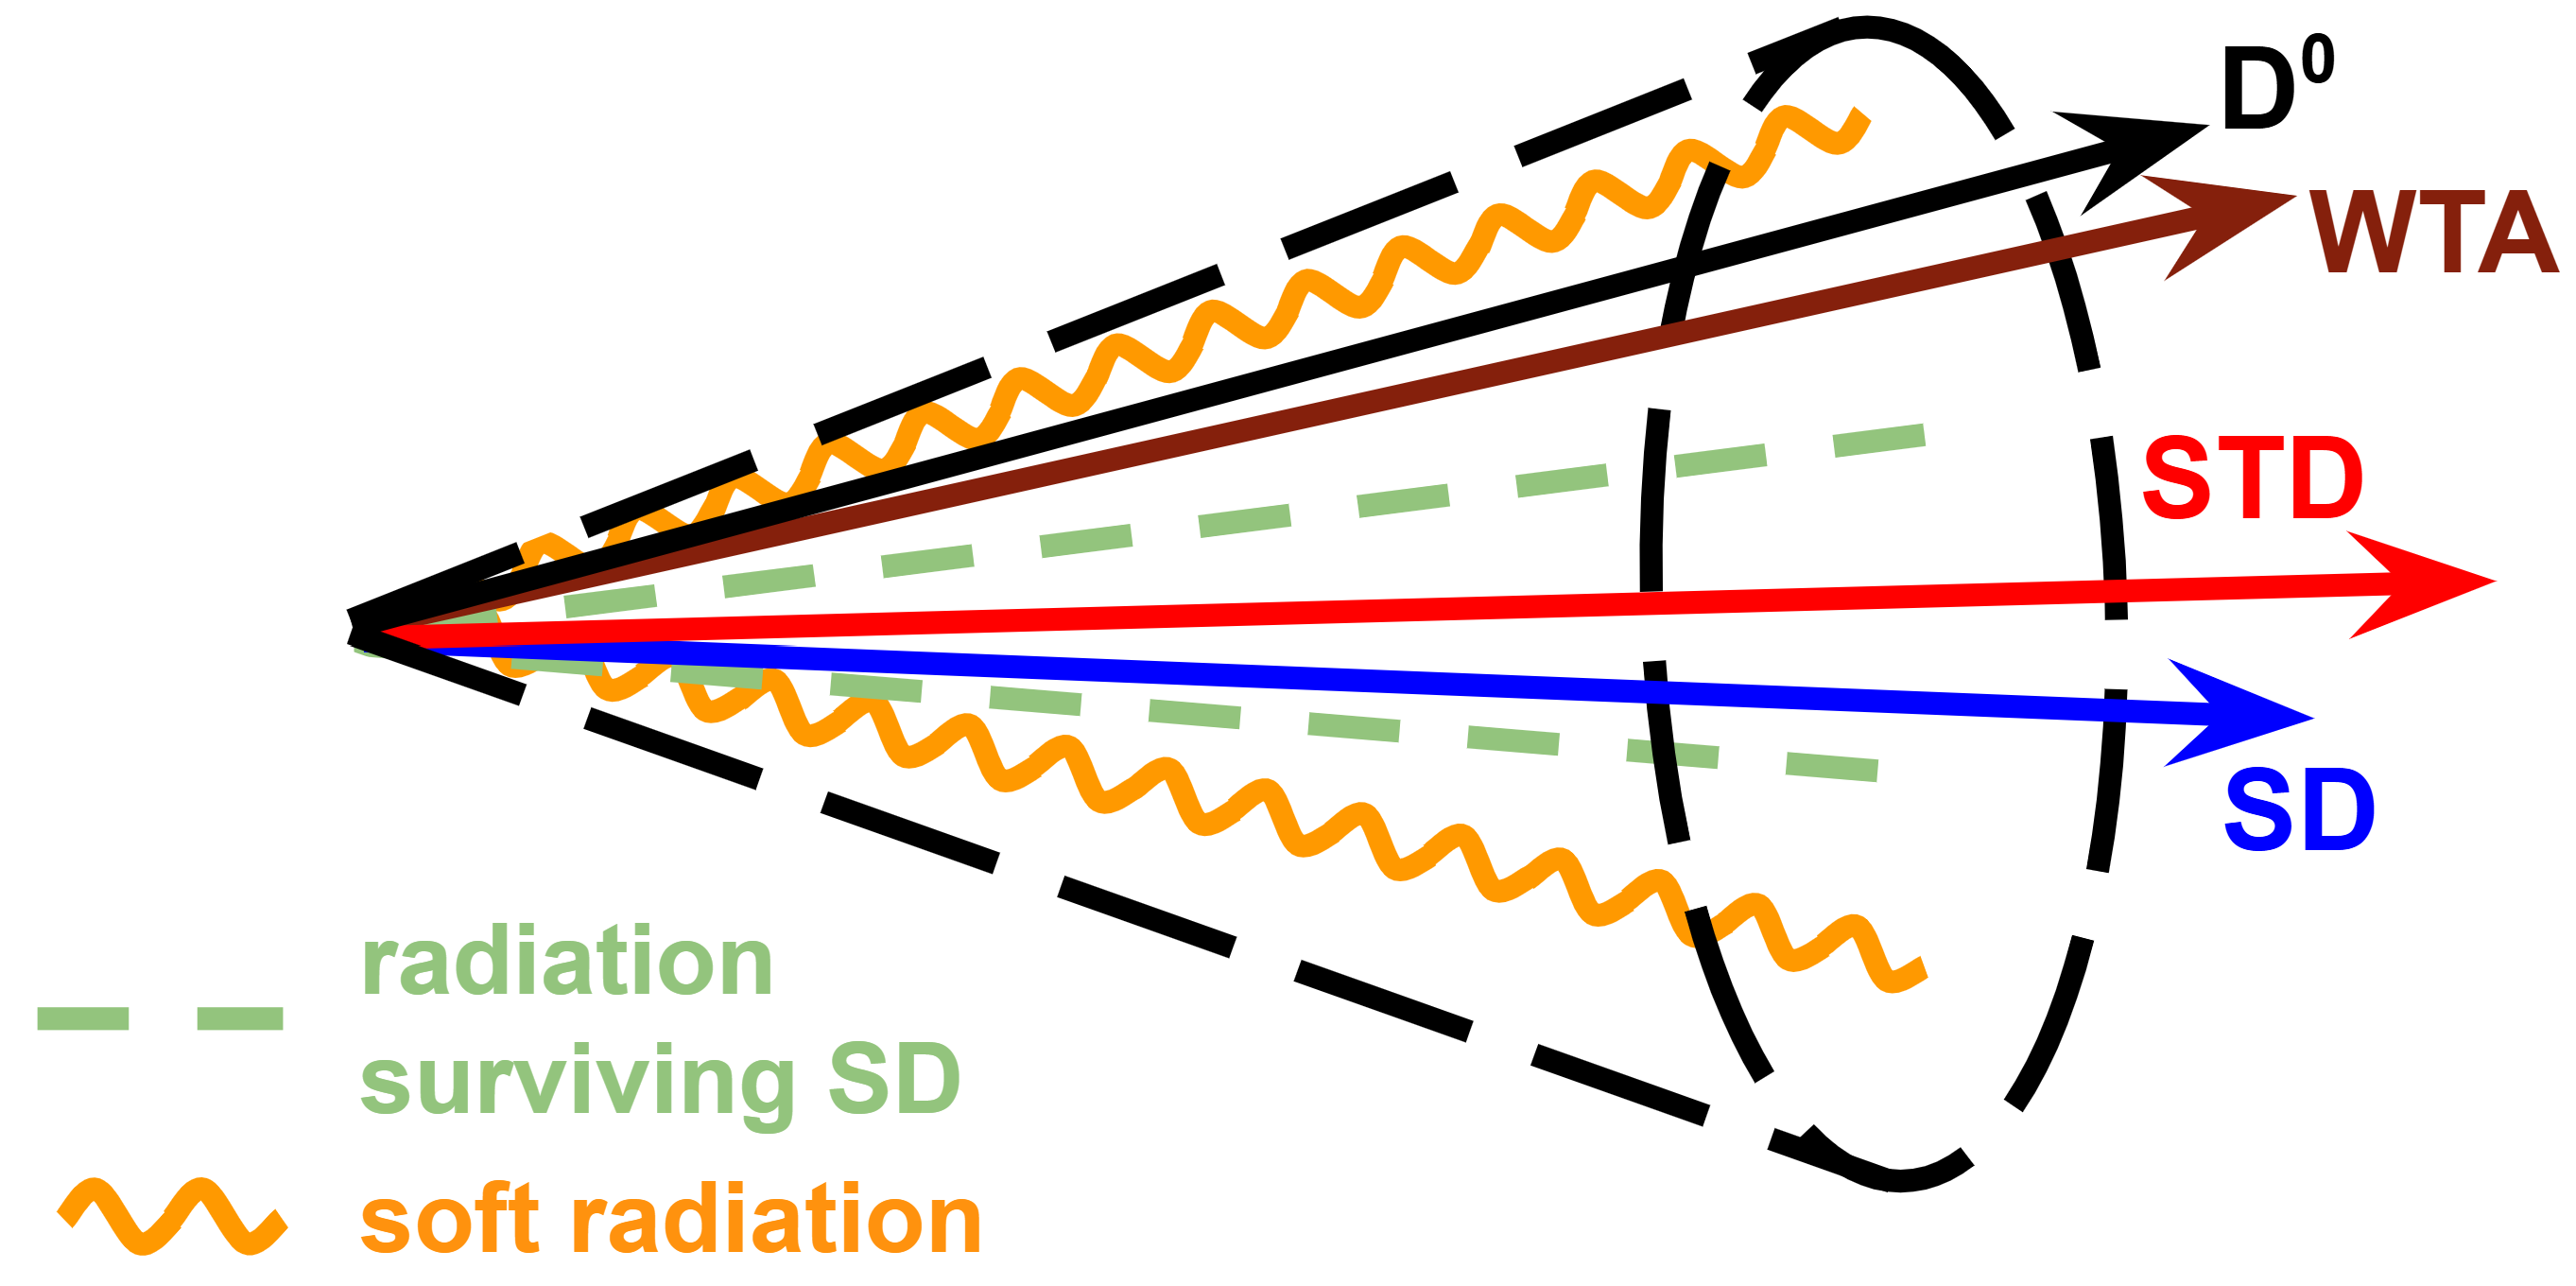 |
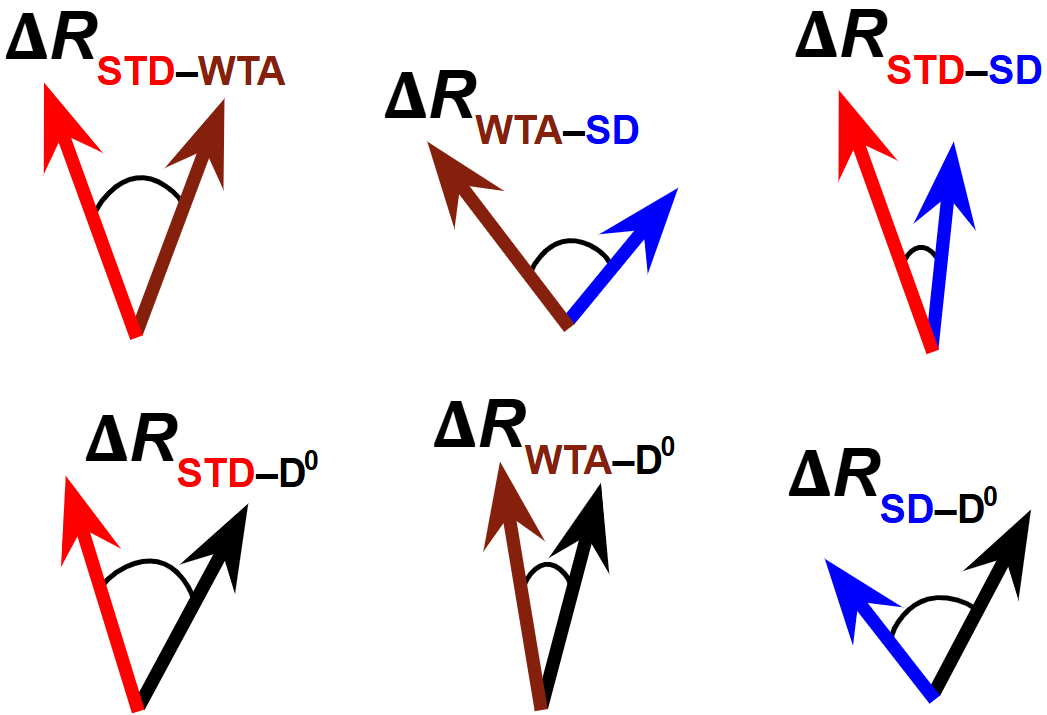
Figure 2
Left: the D$^0$-decay candidate invariant-mass distribution for $10< p_{\rm T}^{\rm ch jet} < 20$ GeV/$c$ and $8 < p_{\rm T}^{\rm D^0} < 12$ GeV/$c$. The total fit function of the signal and background is represented by the blue line. The background fit function is represented by the red line. Right: the raw yields of the D$^0$-tagged jets as a function of $\Delta R_{\rm STD - D^0}$ in the signal region and sideband region. | 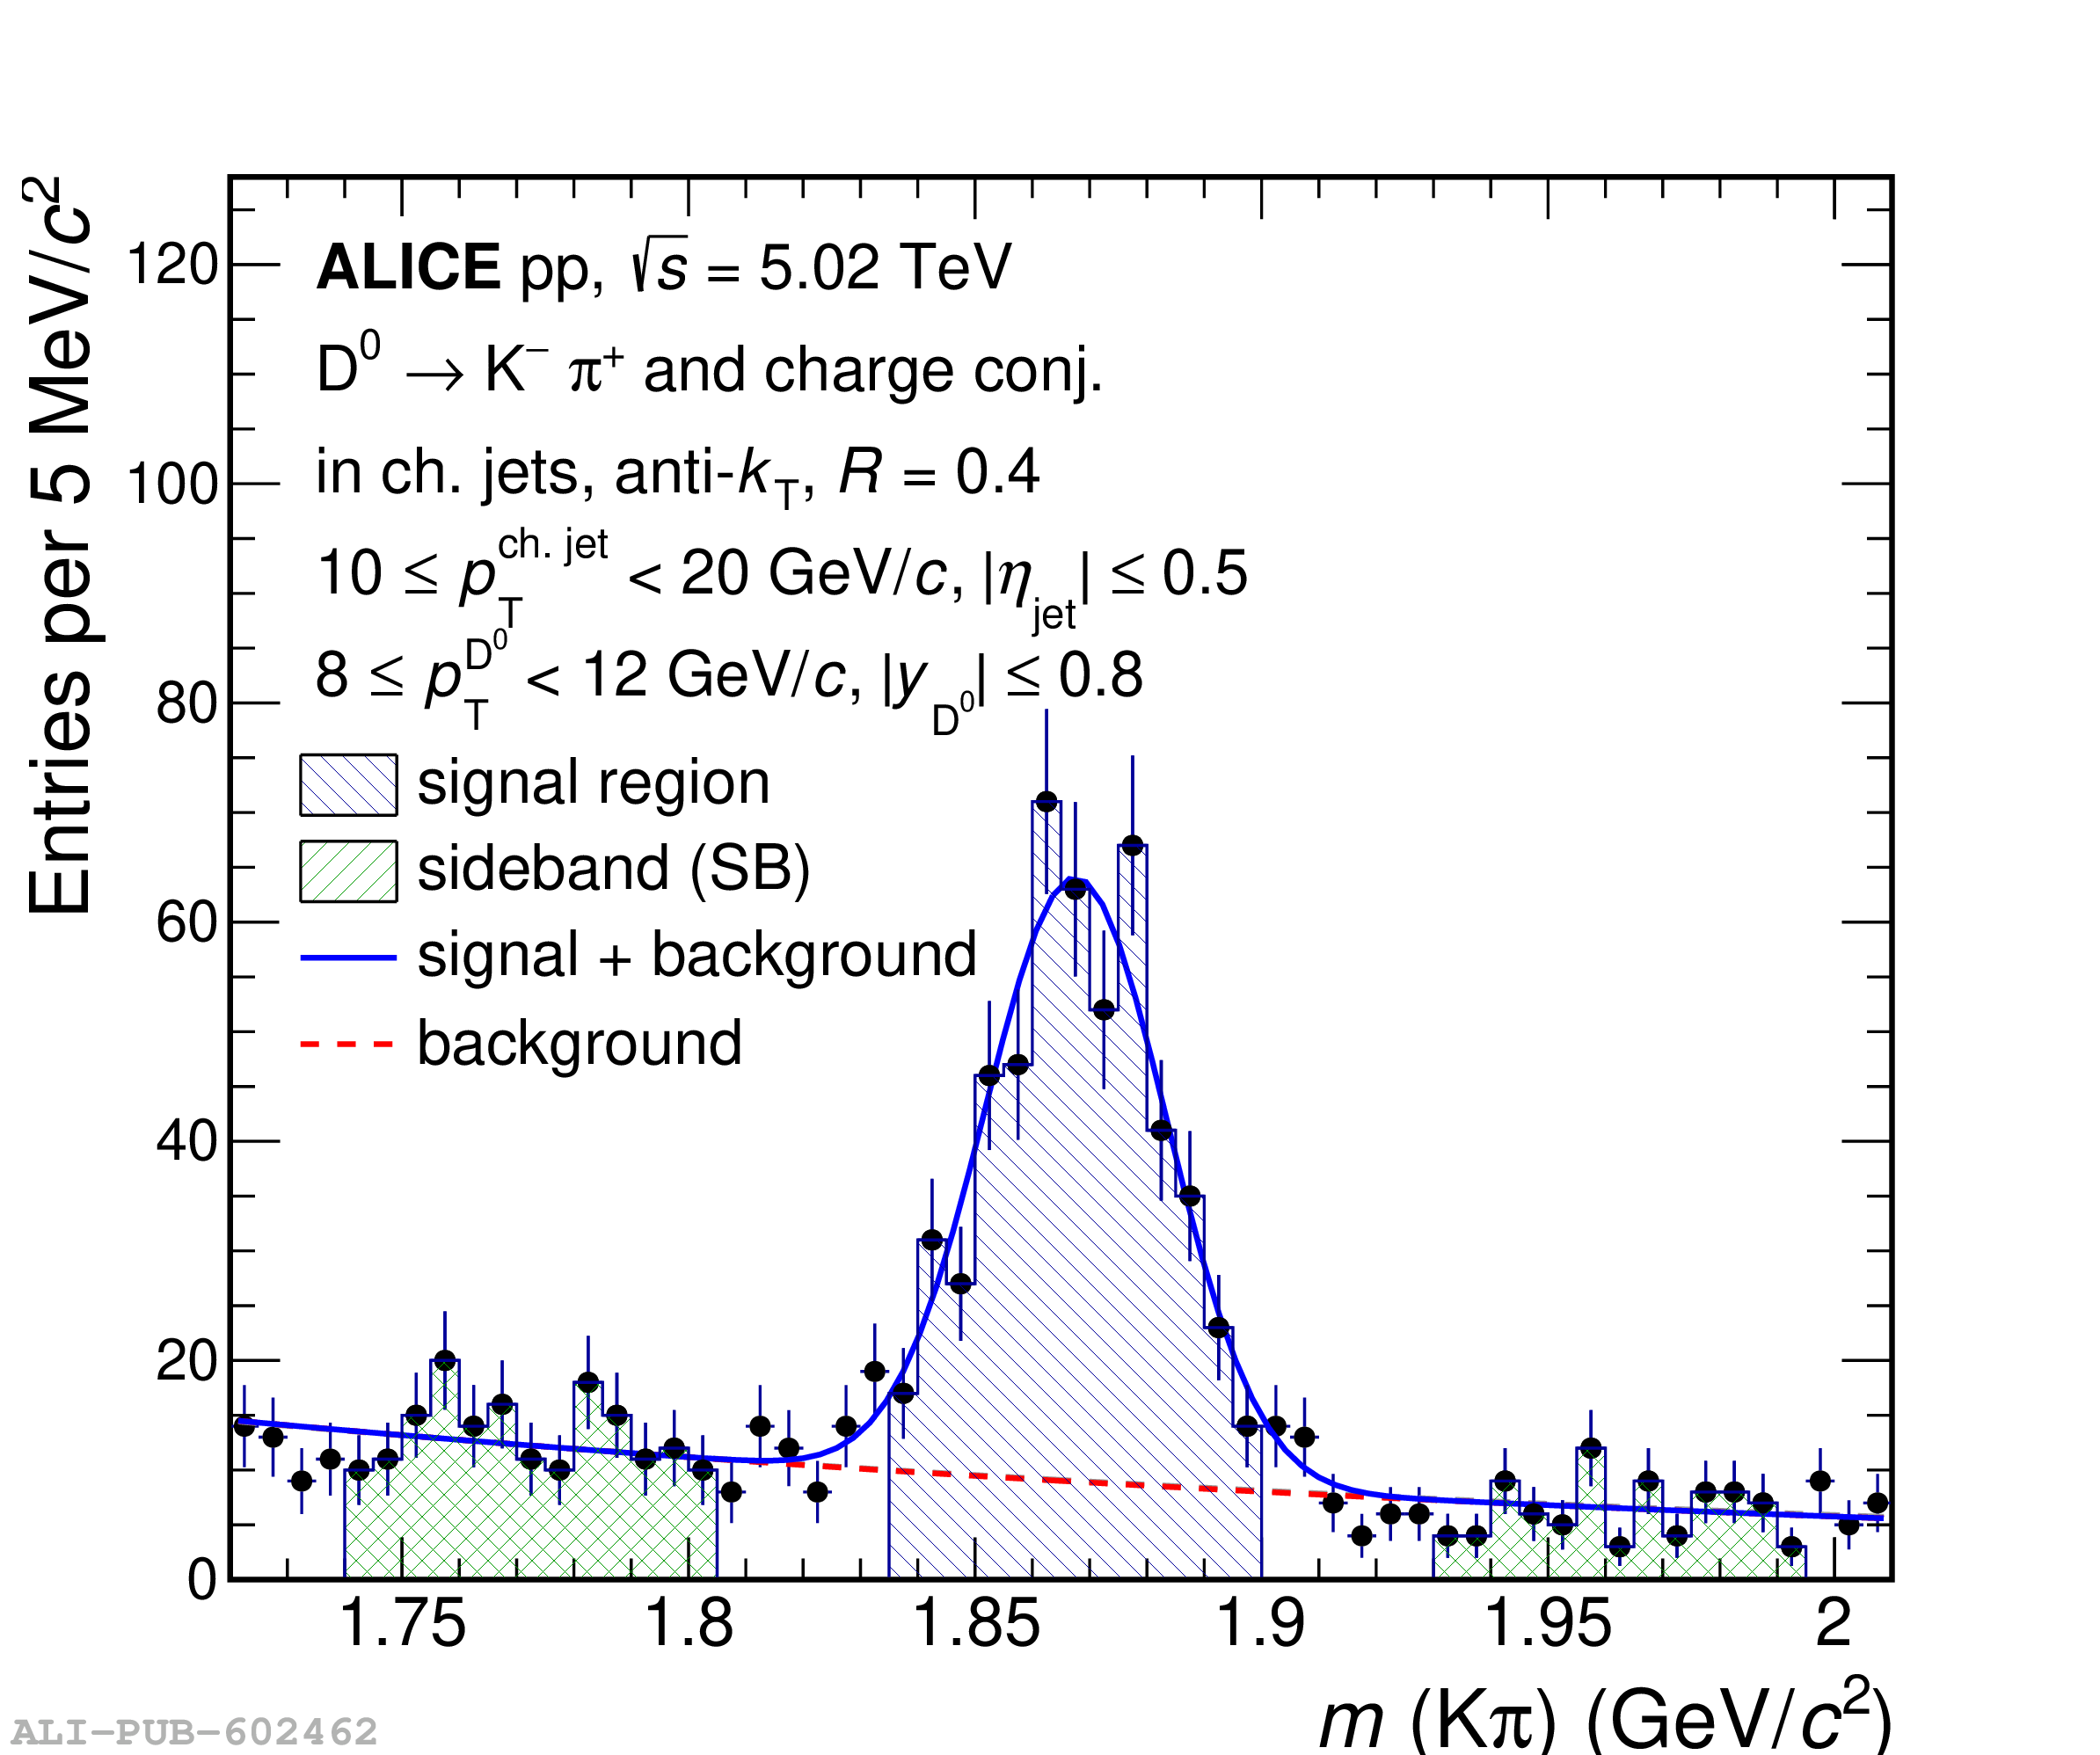 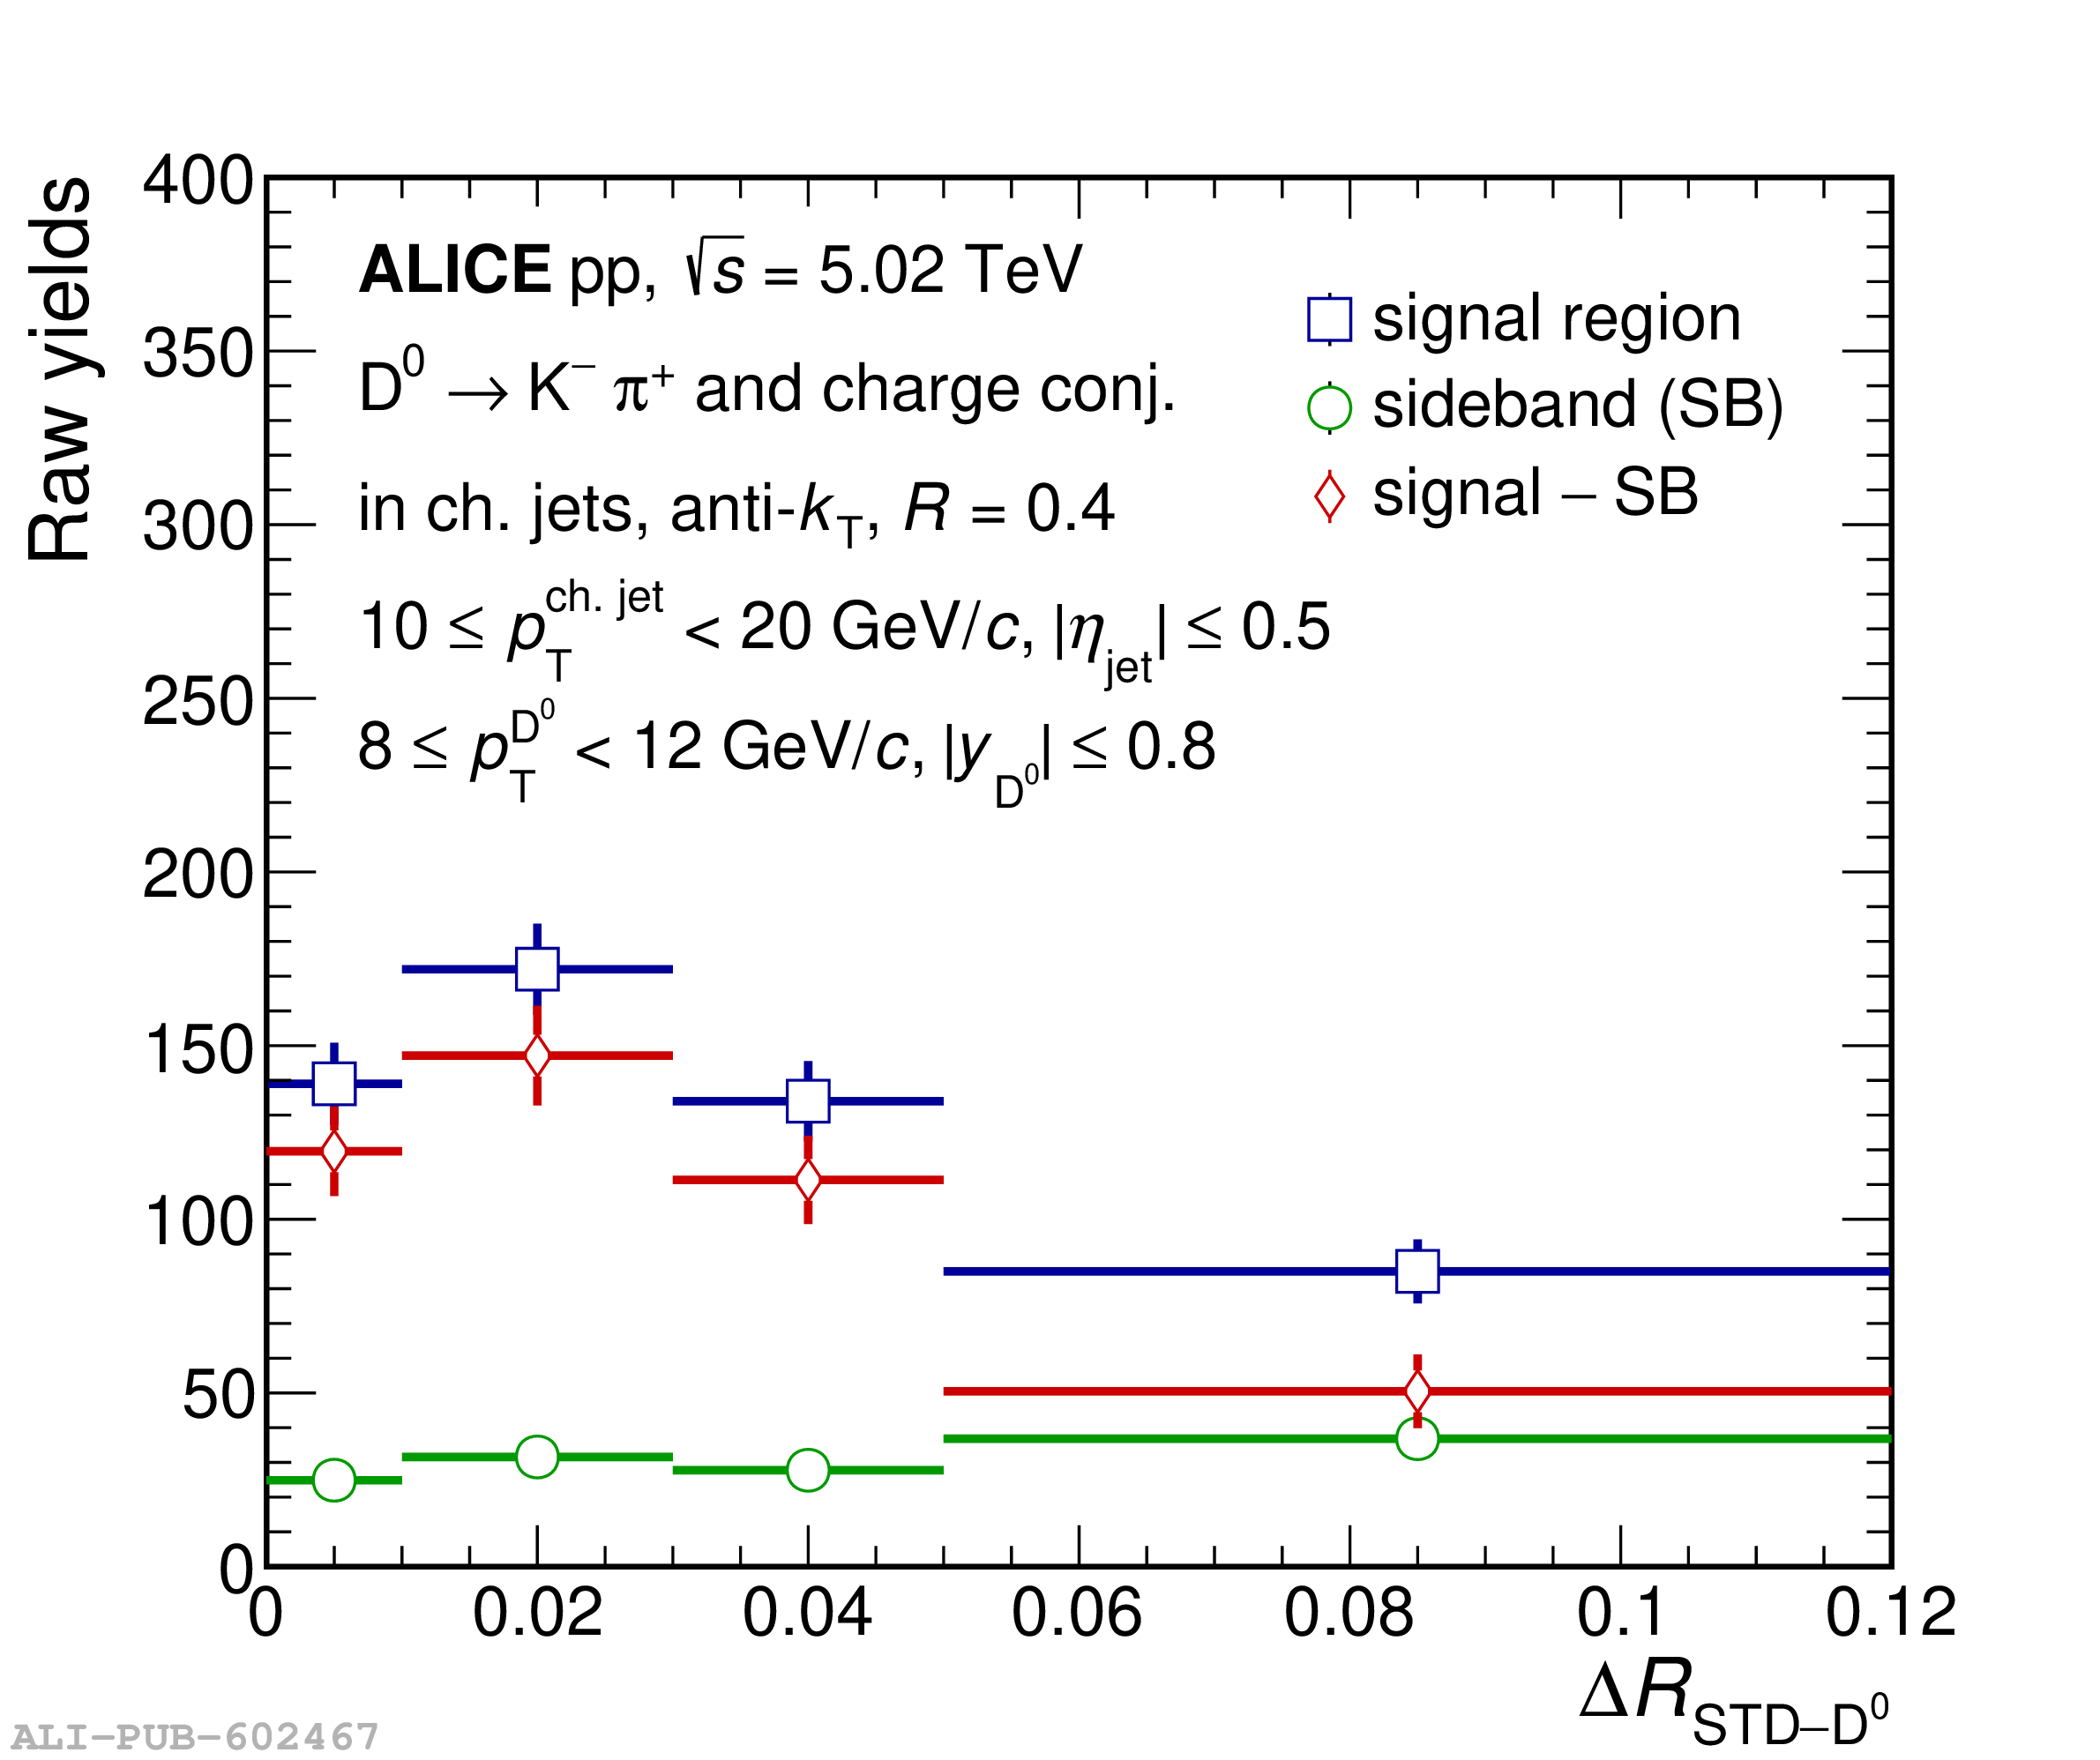 |
Figure 3
Ratio of the simulated non-prompt D$^0$ distribution in the detector (detector-level) over the efficiency-corrected data, which includes contributions from the prompt and feed-down D$^0$. The non-prompt D$^0$ fraction is shown for $\Delta R_{\rm STD-D^0}$ and $\Delta R_{\rm SD-D^0}$ ($z_{\rm cut}=0.1,0.2$ and $\beta=0$). Systematic and statistical uncertainties are represented by the corresponding color boxes and error bars, respectively. | 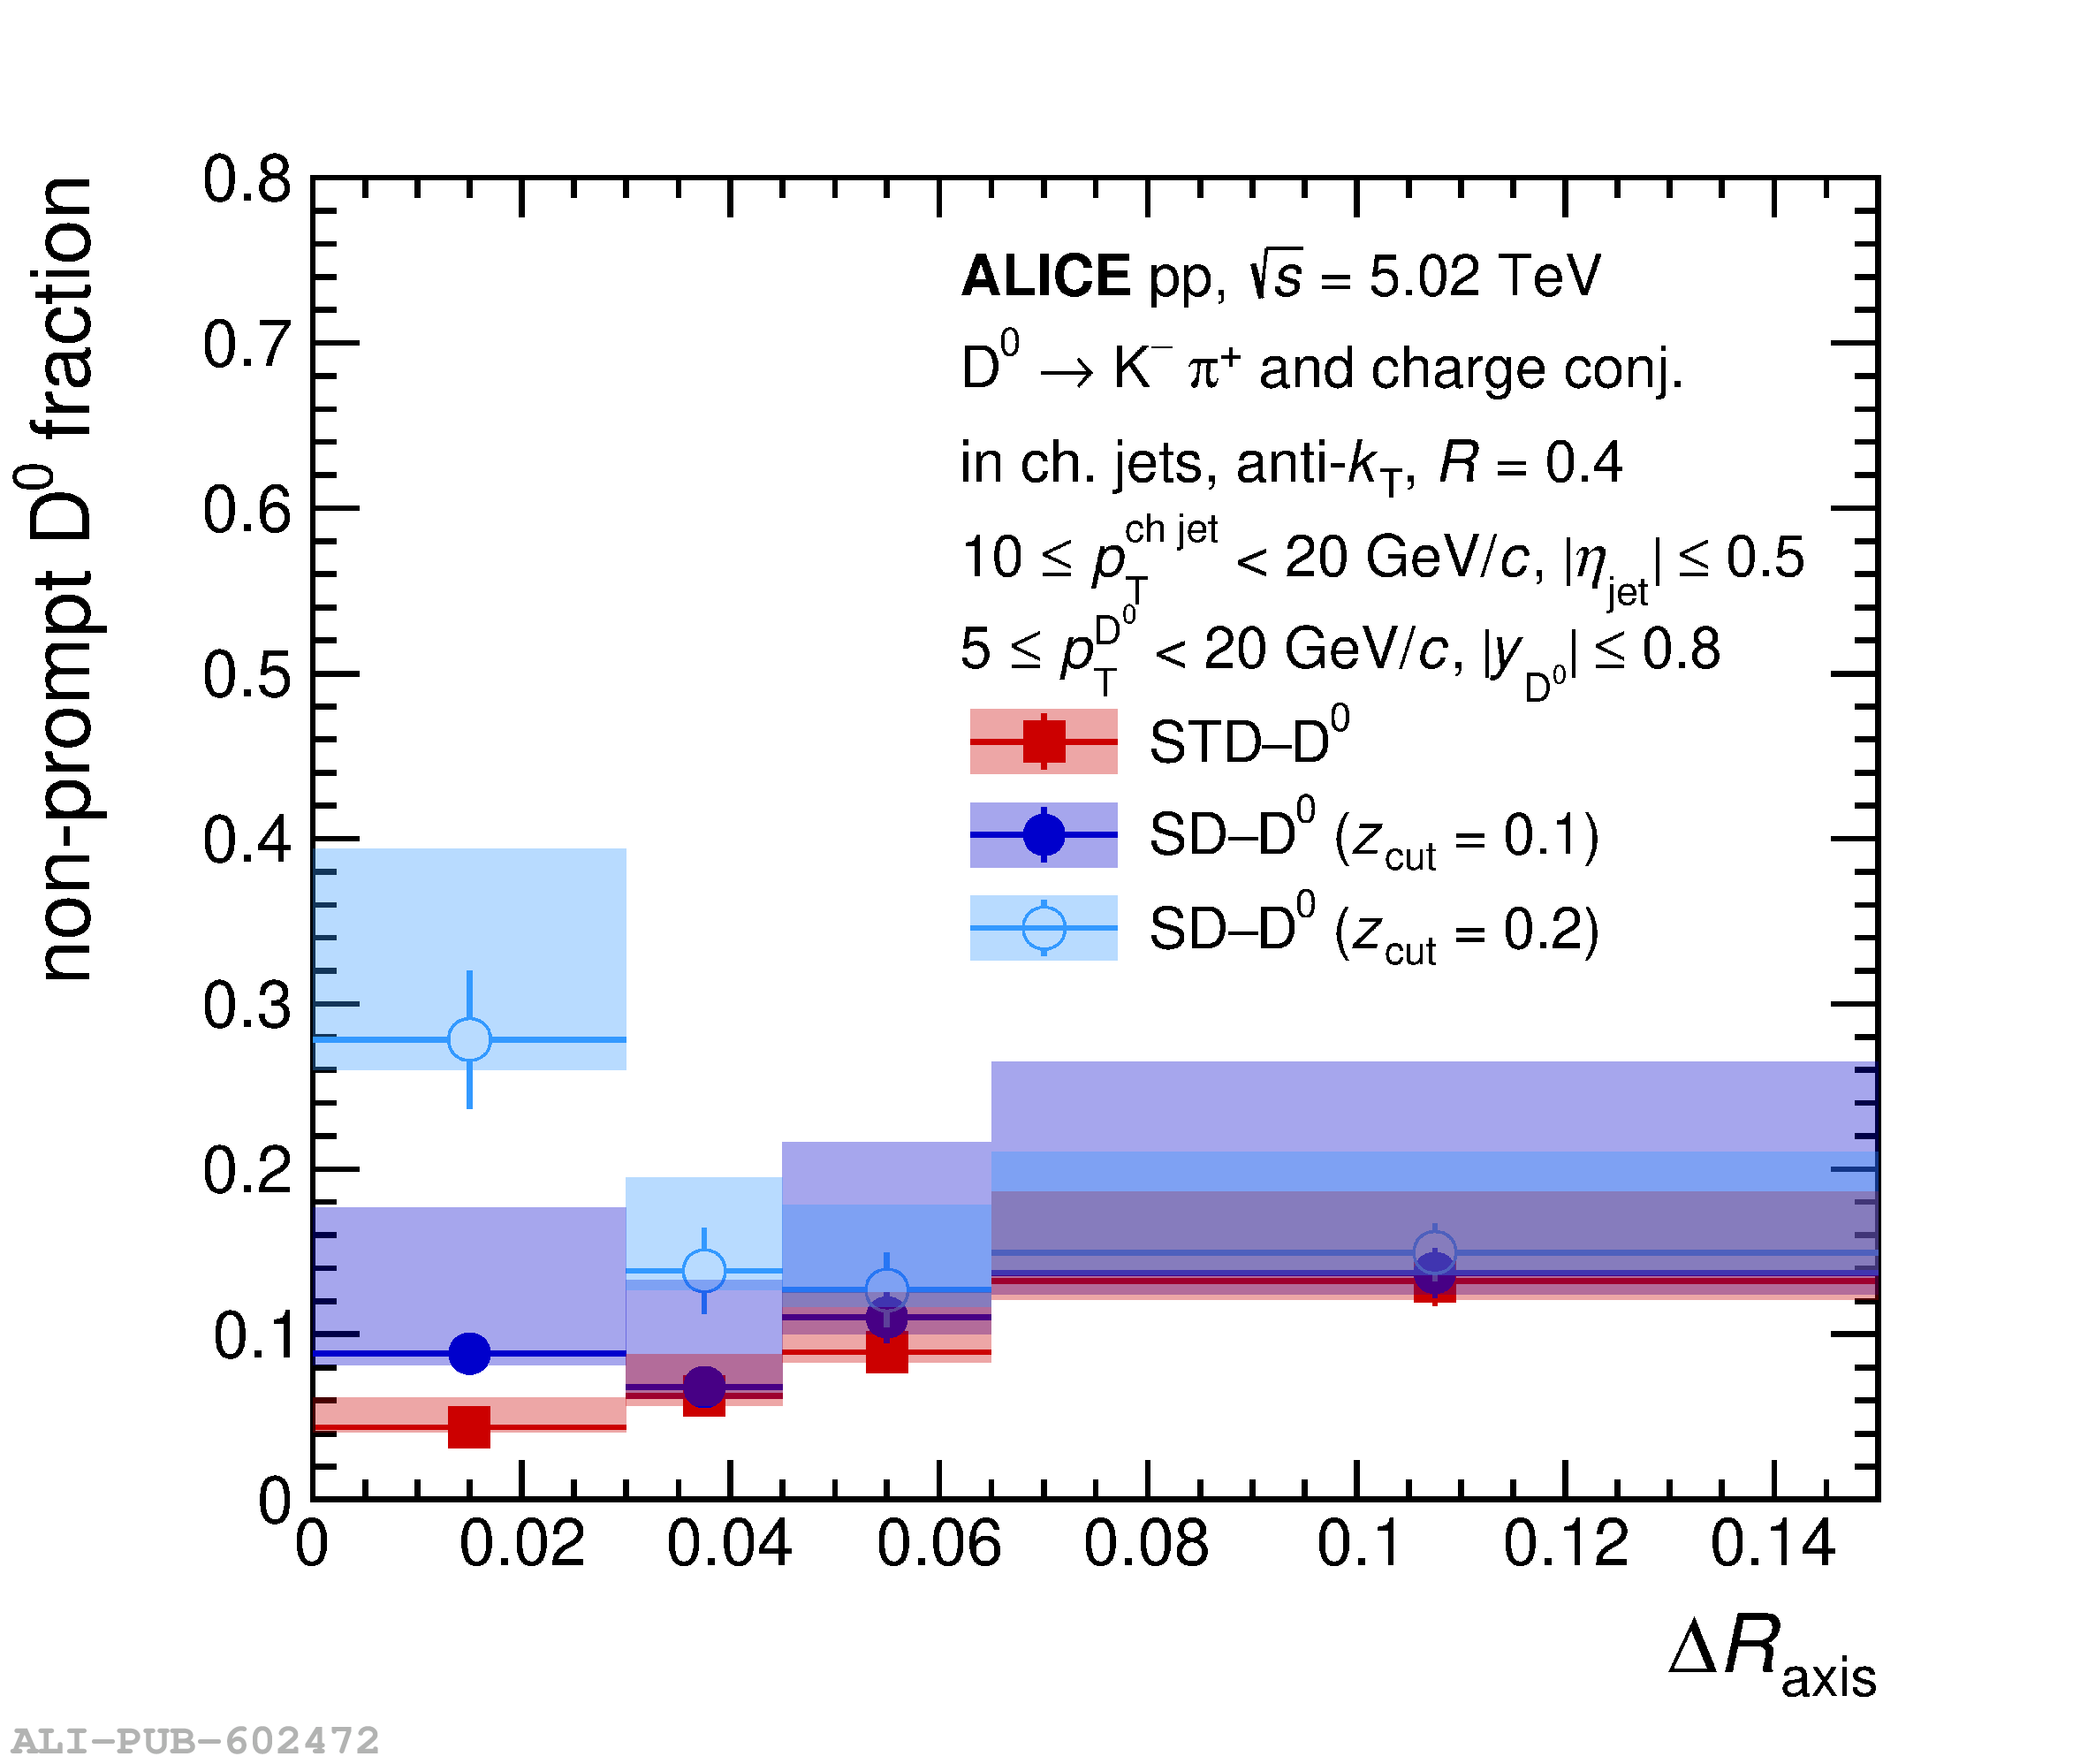 |
Figure 4
Unfolded jet axes difference distribution for $\Delta R_{\rm WTA-D^0}$ and $\Delta R_{\rm STD-D^0}$ in $10 < p_{\rm T}^{\rm ch jet} < 20$ GeV/$c$. Includes systematic and statistical uncertainties represented by color boxes and error bars, respectively, and a comparison to predictions from PYTHIA 8. | 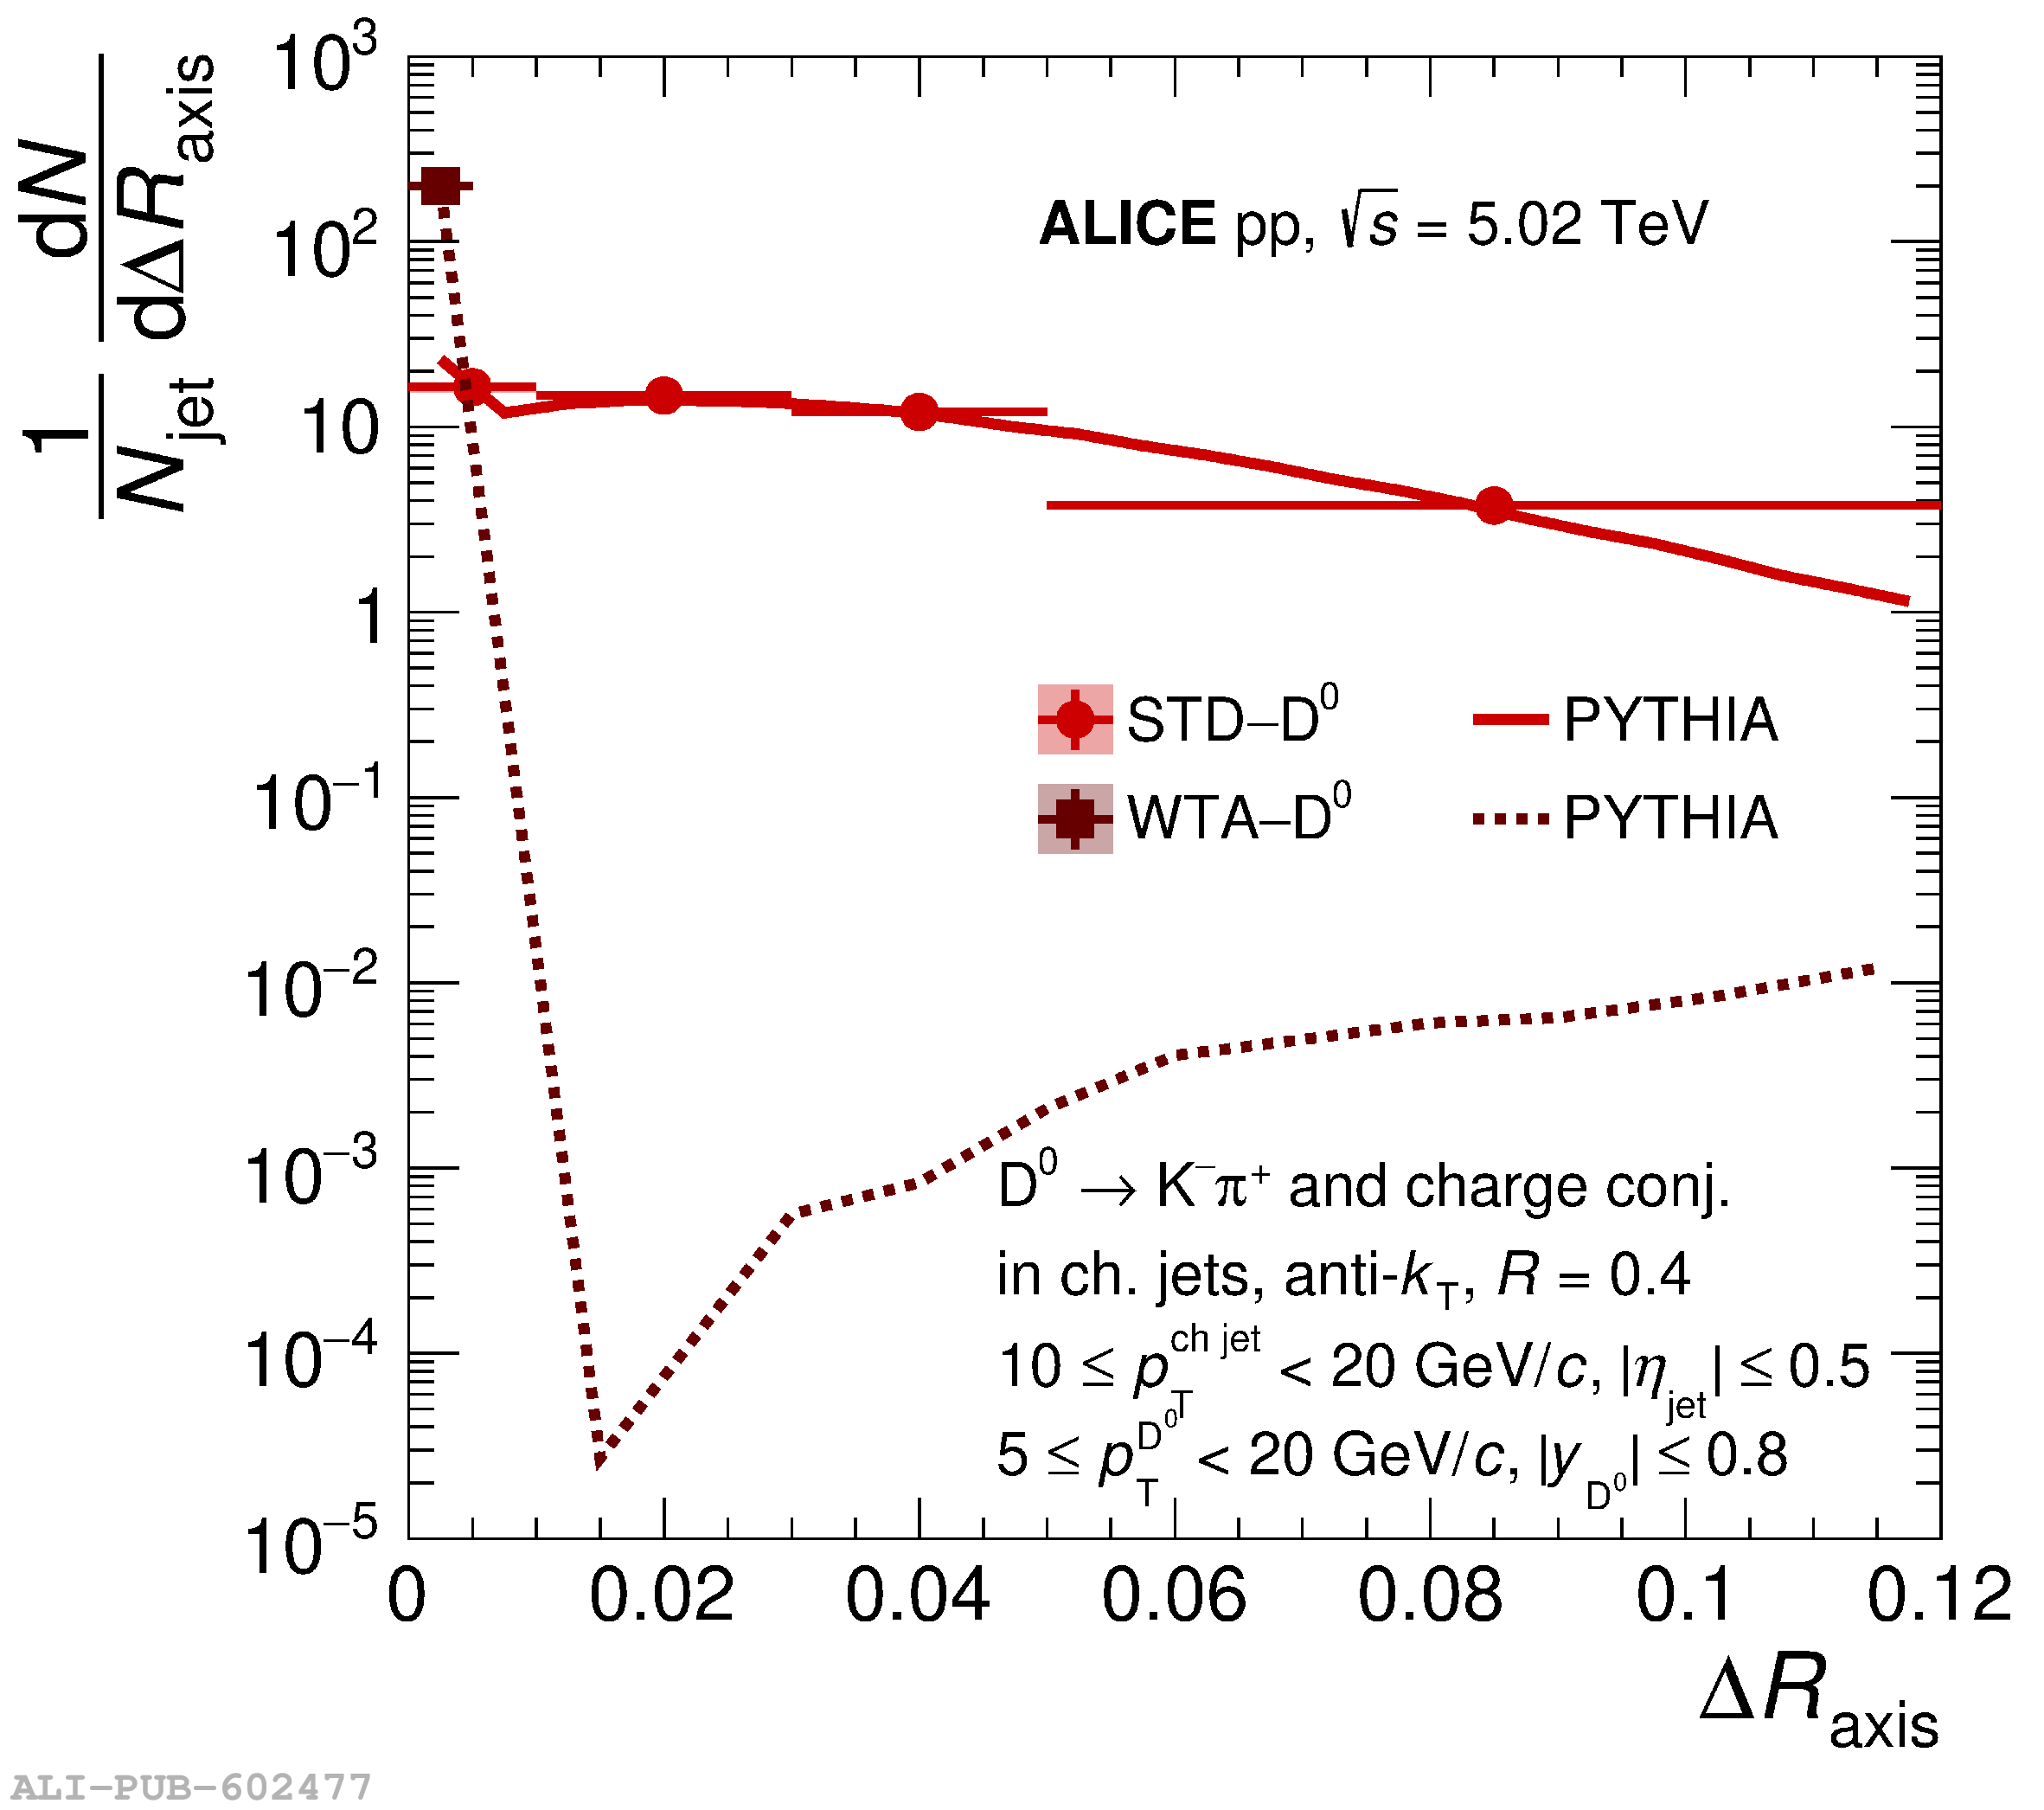 |
Figure 5
Fully unfolded jet axes difference distribution for $\Delta R_{\rm STD-D^0}$ (left) and $\Delta R_{\rm STD-WTA}$ (middle) for $10 < p_{\rm T}^{\rm ch jet} < 20$ GeV/$c$. Systematic and statistical uncertainties are represented by color boxes and error bars, respectively, and comparisons to MC event generators PYTHIA 8, HERWIG 7, and SHERPA 2 (Ahadic and Lund) are shown in the respective bottom panels. The bottom right panel shows a ratio of the two data distributions. | 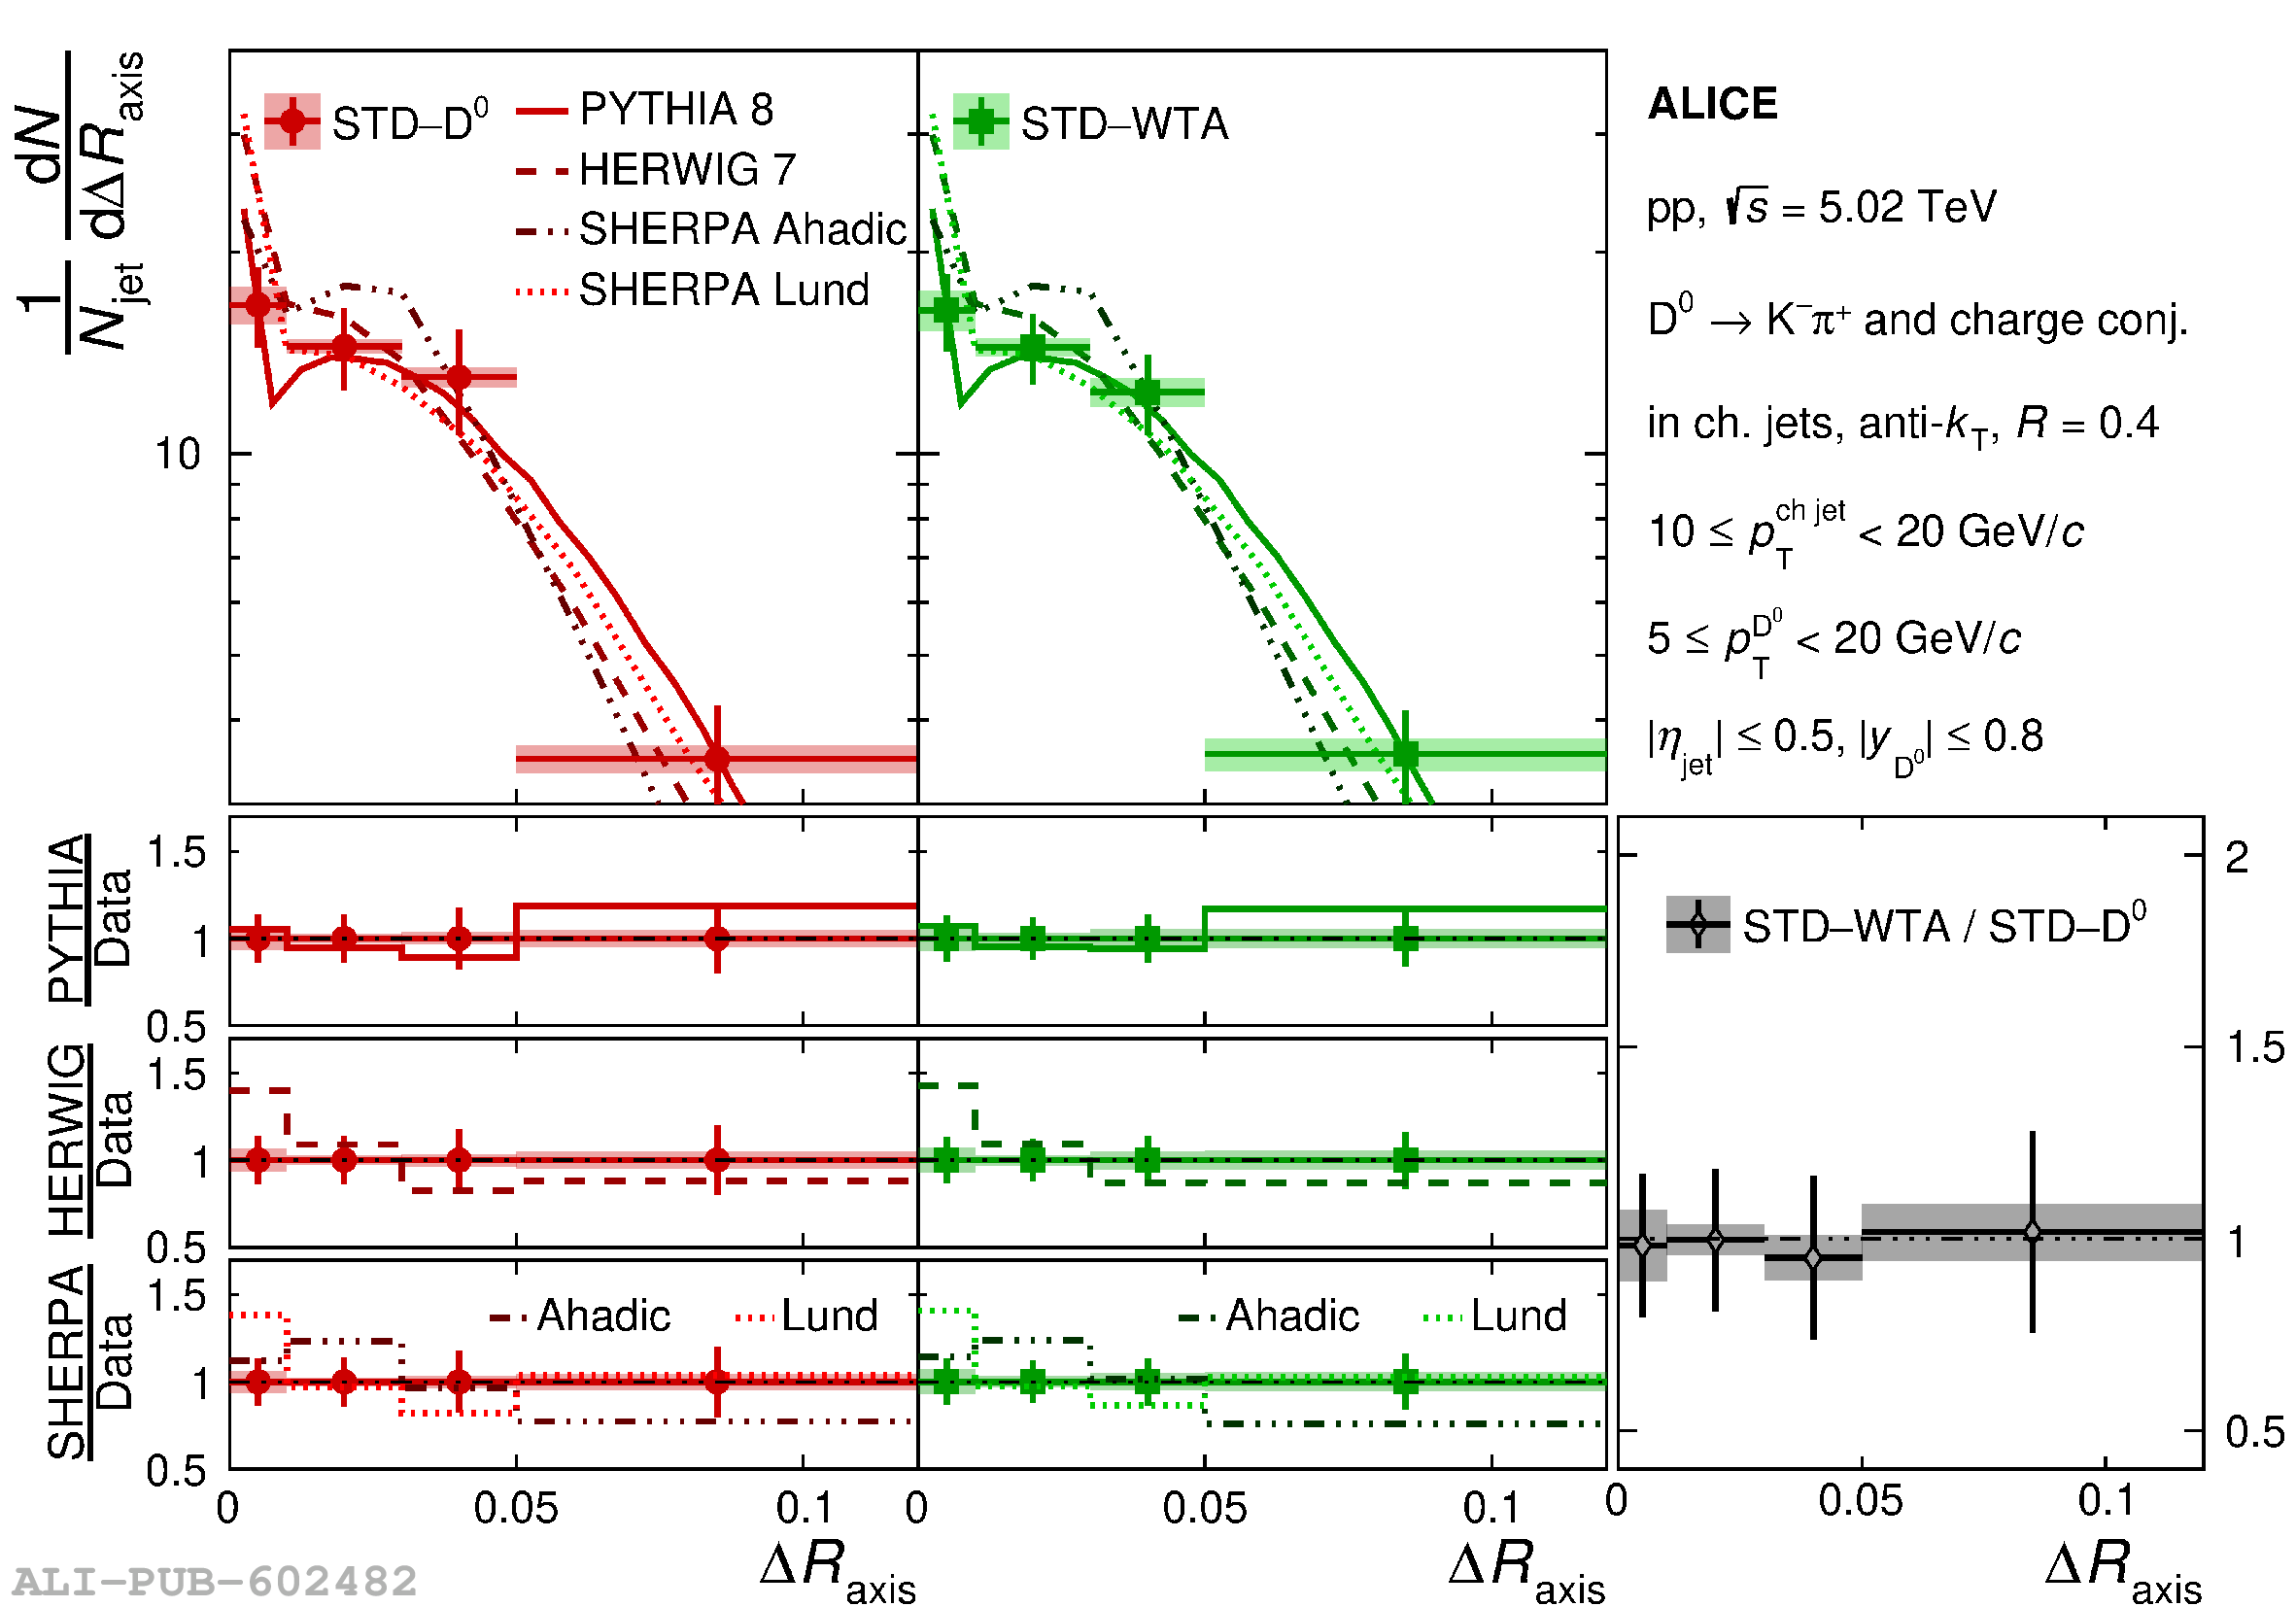 |
Figure 6
Fully unfolded jet axes difference distributions for $\Delta R_{\rm STD-D^0}$ and $\Delta R_{\rm SD-D^0}$, where the Soft Drop parameters are $\beta=0$ and $z_{\rm cut} = 0.1$ or $0.2$, in $10 < p_{\rm T}^{\rm ch jet} < 20$ GeV/$c$. Systematic and statistical uncertainties are represented by color boxes and error bars, respectively. Comparisons to predictions from PYTHIA 8 are included. | 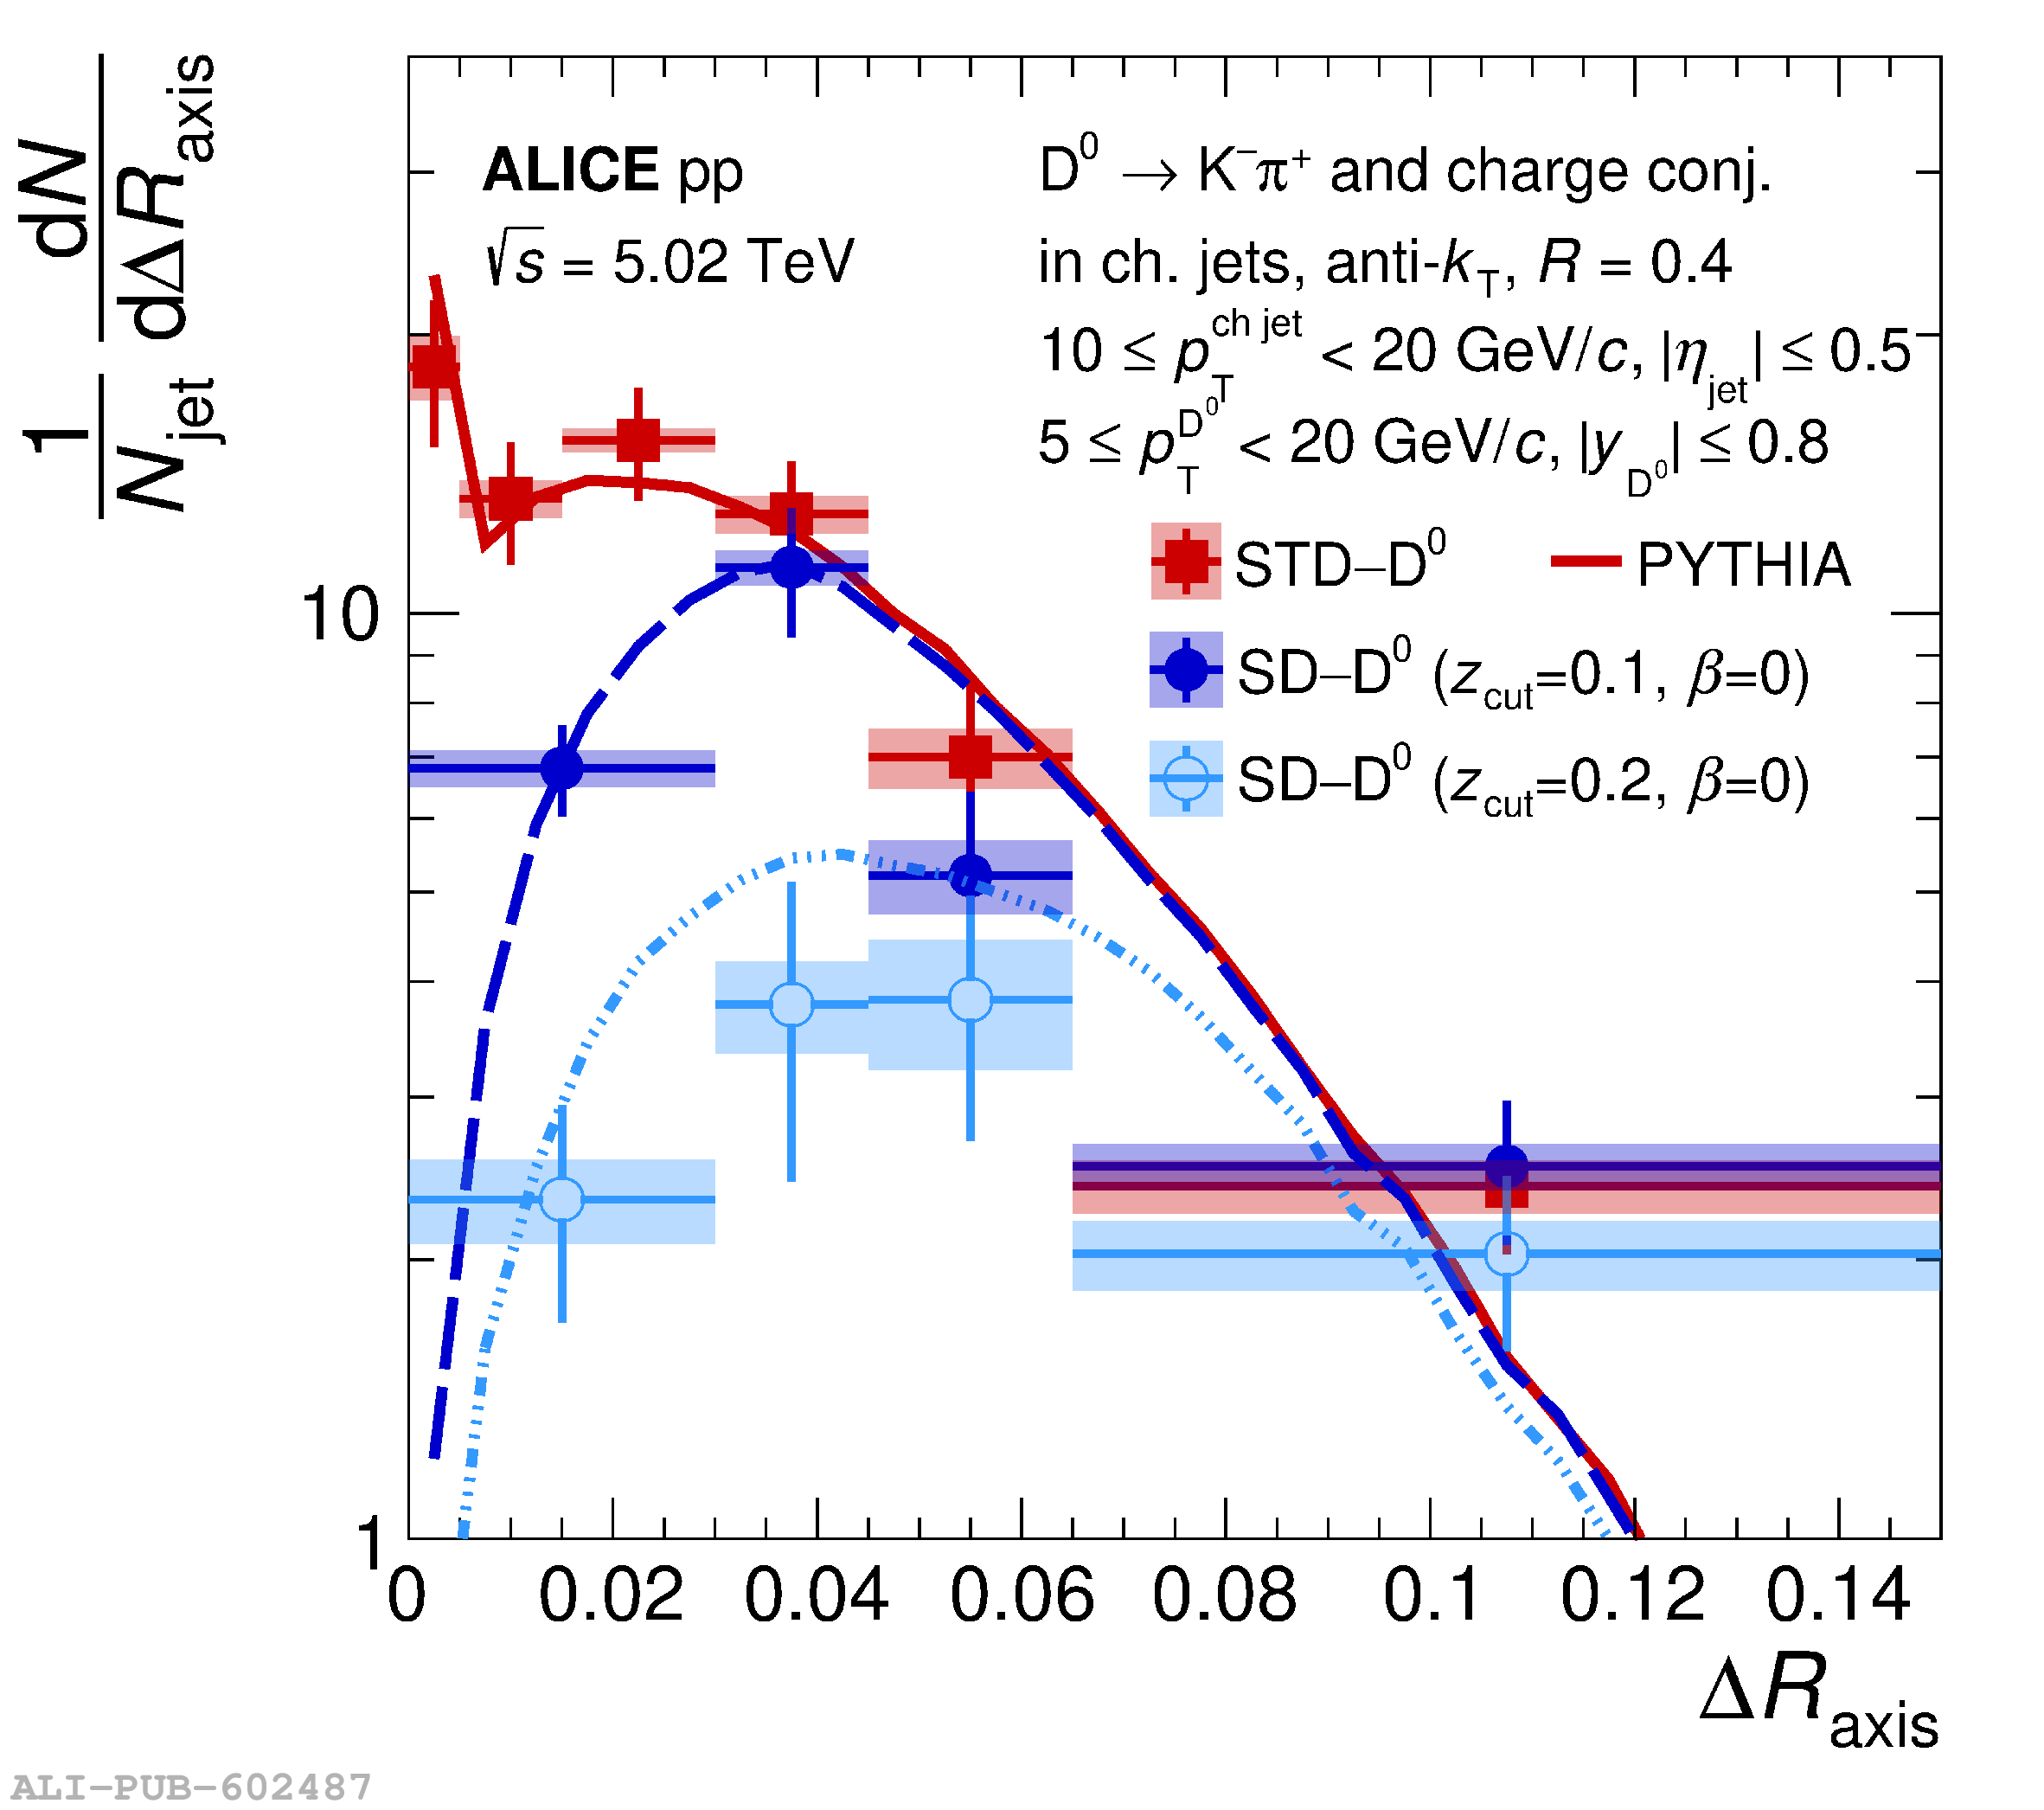 |
Figure 7
Fully unfolded jet axes difference distributions for $\Delta R_{\rm SD-D^0}$ (left) and $\Delta R_{\rm WTA-SD}$ (middle), with grooming parameters $z_{\rm cut}=0.1$ and $\beta=0$, for $10 < p_{\rm T}^{\rm ch jet} < 20$ GeV/$c$. Systematic and statistical uncertainties are represented by color boxes and error bars, respectively, and MC event generator comparisons are shown in the bottom panels. The bottom right panel shows a ratio of the two data distributions. | 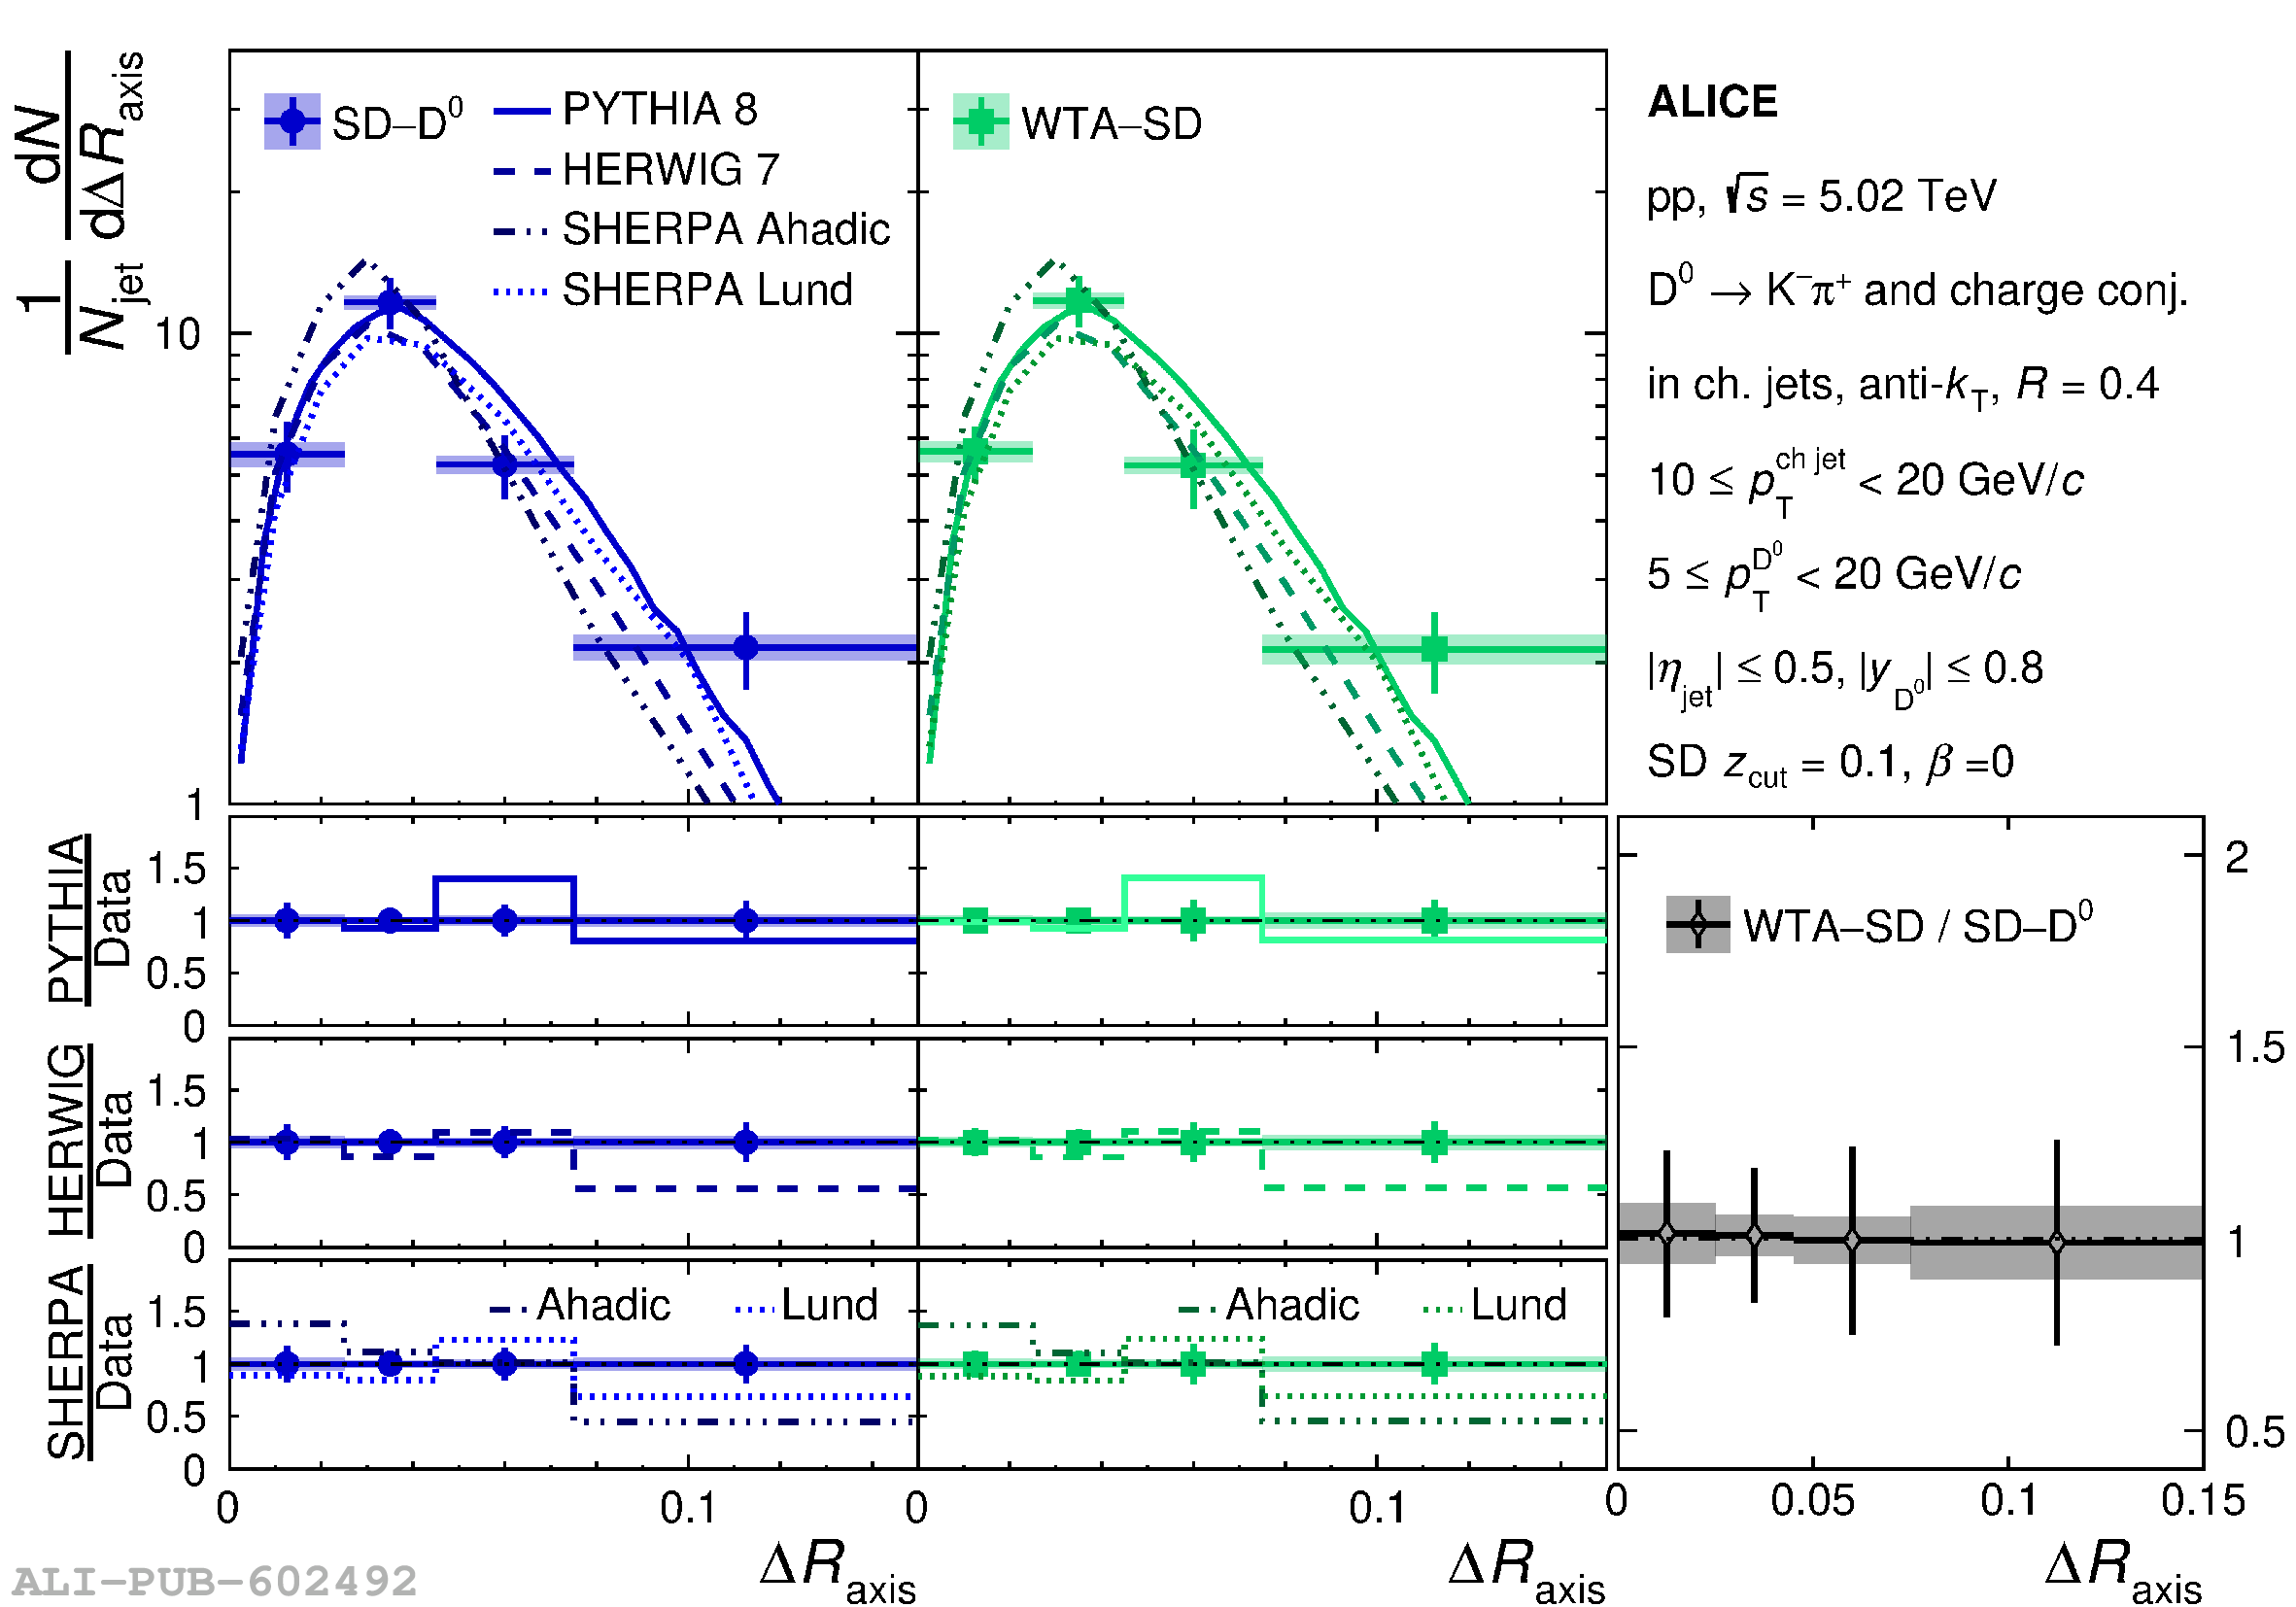 |
Figure 8
Fully unfolded jet axes difference distributions for $\Delta R_{\rm SD-D^0}$ (left) and $\Delta R_{\rm WTA-SD}$ (middle), with grooming parameters $z_{\rm cut}=0.2$ and $\beta=0$, for $10 < p_{\rm T}^{\rm ch jet} < 20$ GeV/$c$. Systematic and statistical uncertainties are represented by color boxes and error bars, respectively, and MC event generator comparisons are shown in the bottom panels. The bottom right panel shows a ratio of the two data distributions. | 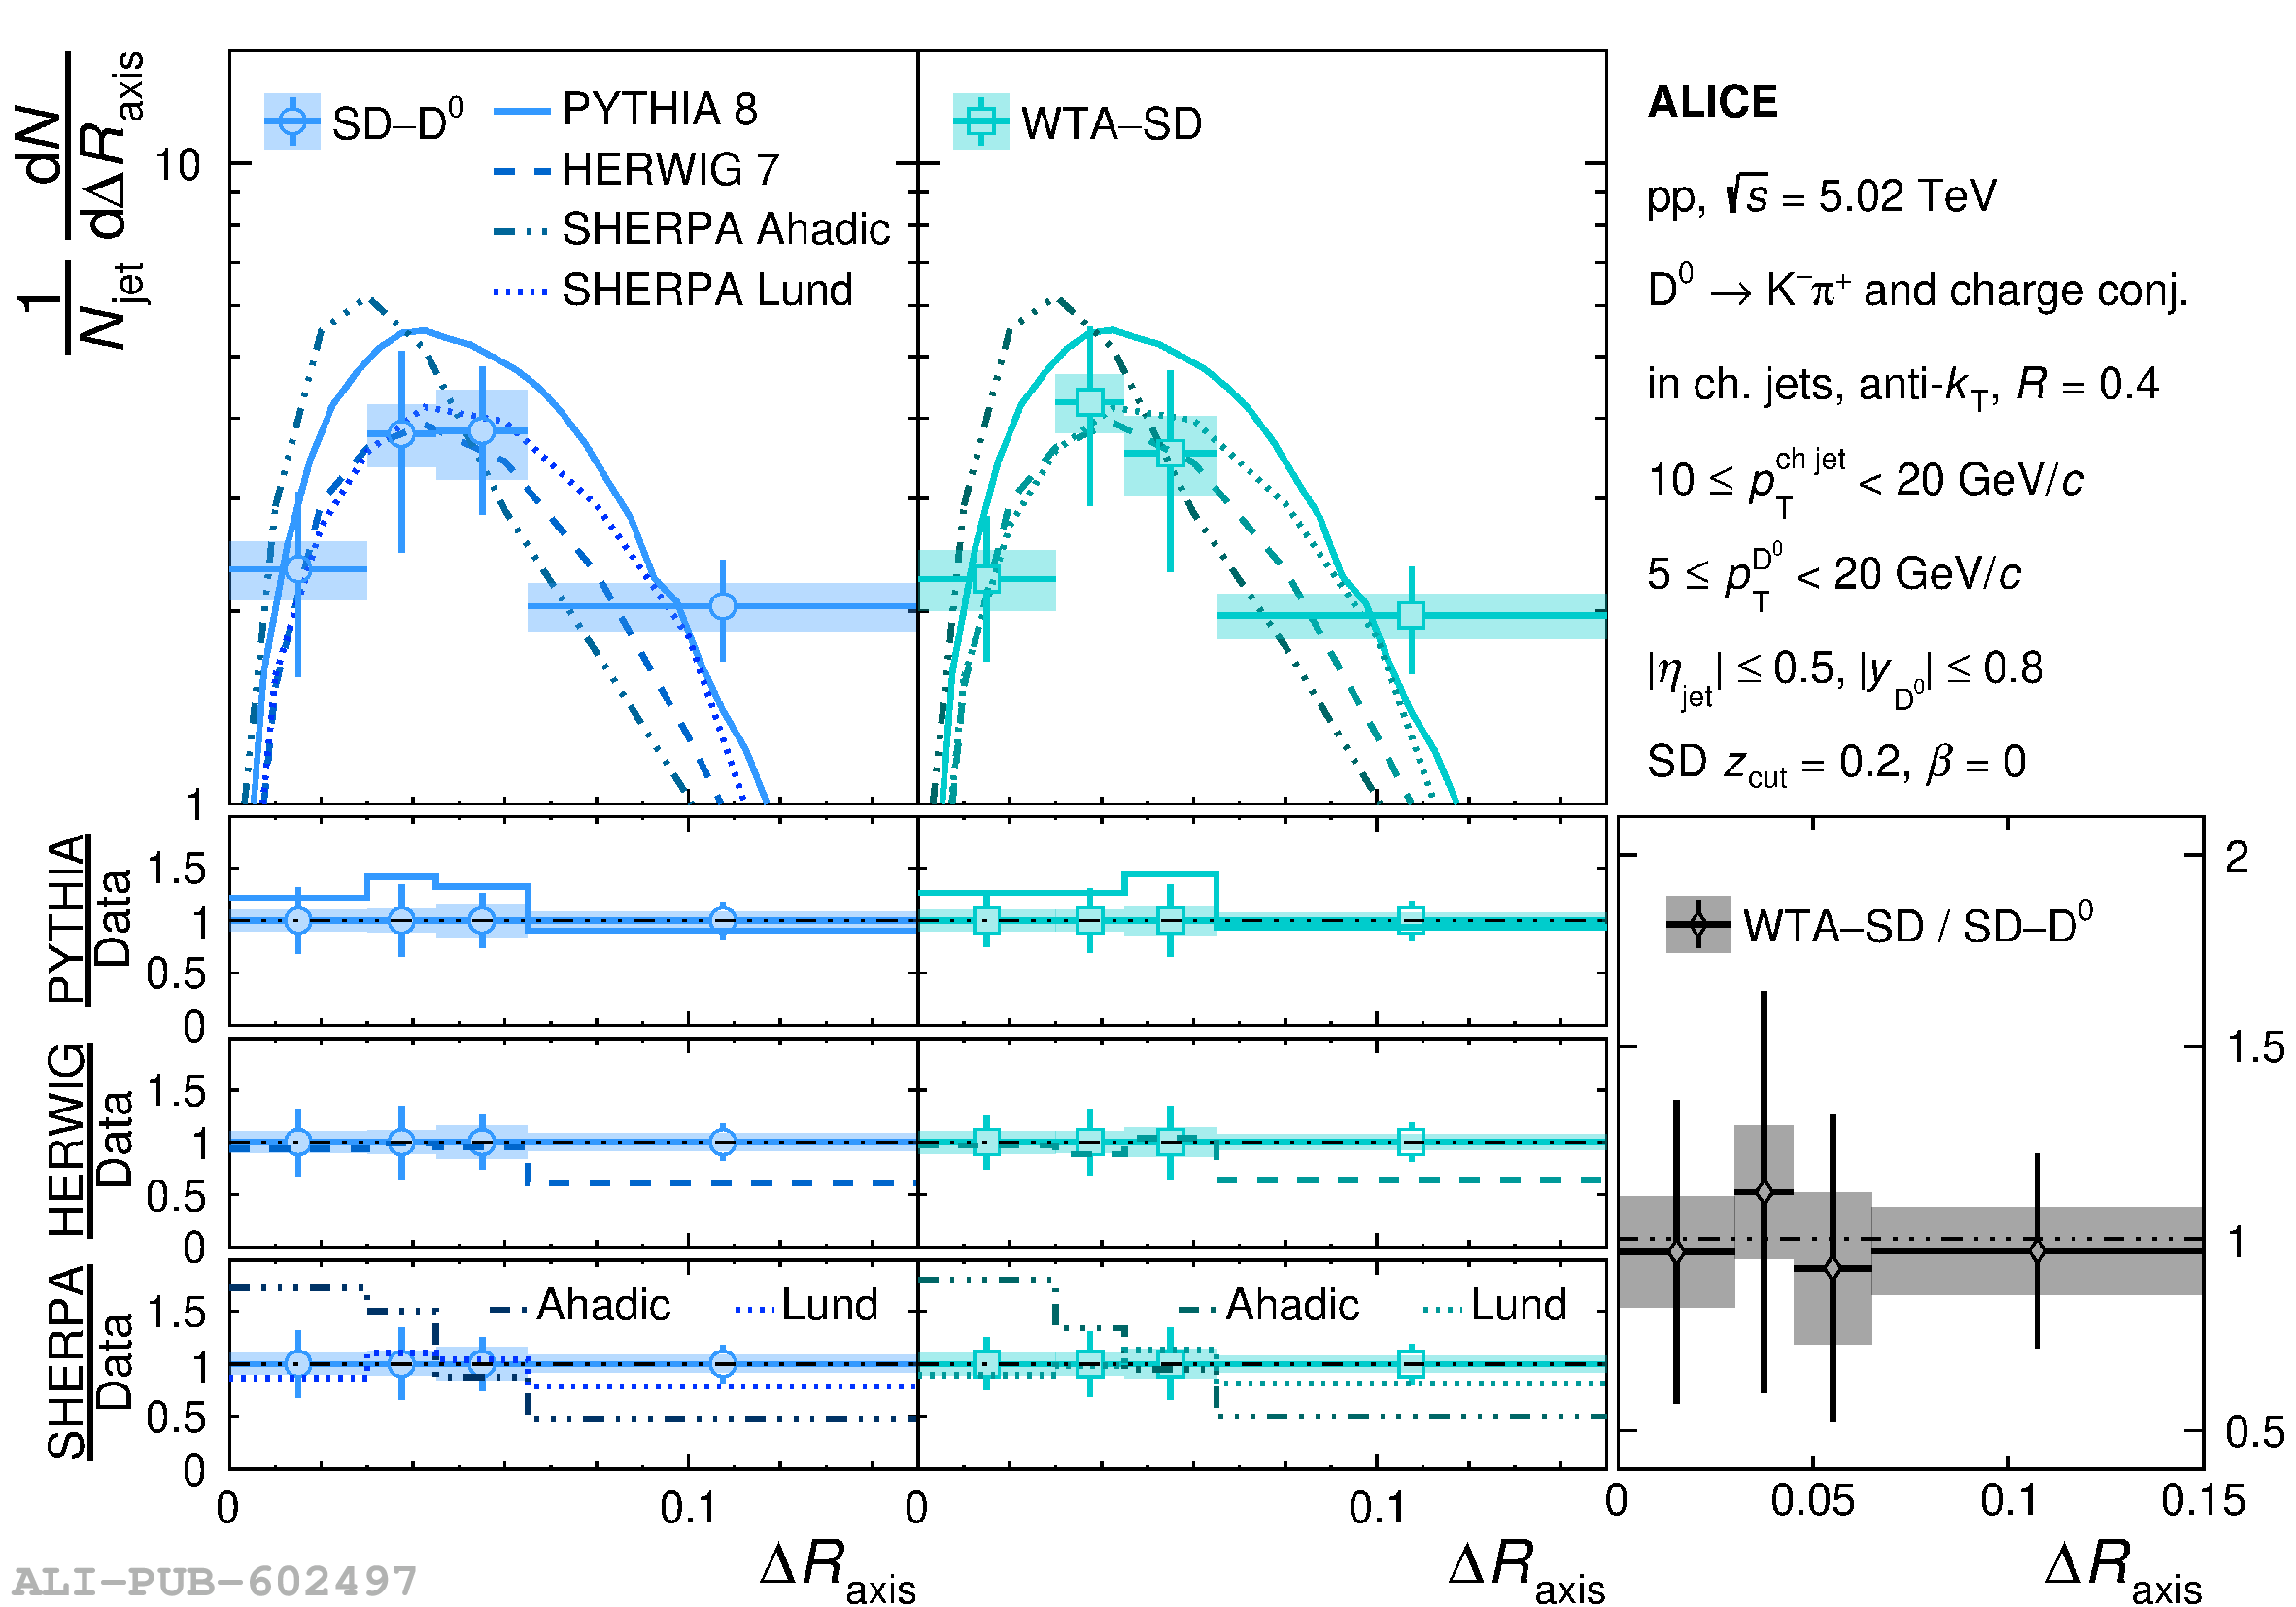 |
Figure 9
Fully unfolded jet axes difference distributions for $\Delta R_{\rm STD-SD}$ with $z_{\rm cut}=0.1$ (left) and $z_{\rm cut}=0.2$ (right), $\beta=0$ and $10< p_{\rm T}^{\rm ch jet} < 20$ GeV/$c$ . Systematic and statistical uncertainties are represented by color boxes and error bars, respectively, and MC event generator comparisons are shown in the bottom panels. | 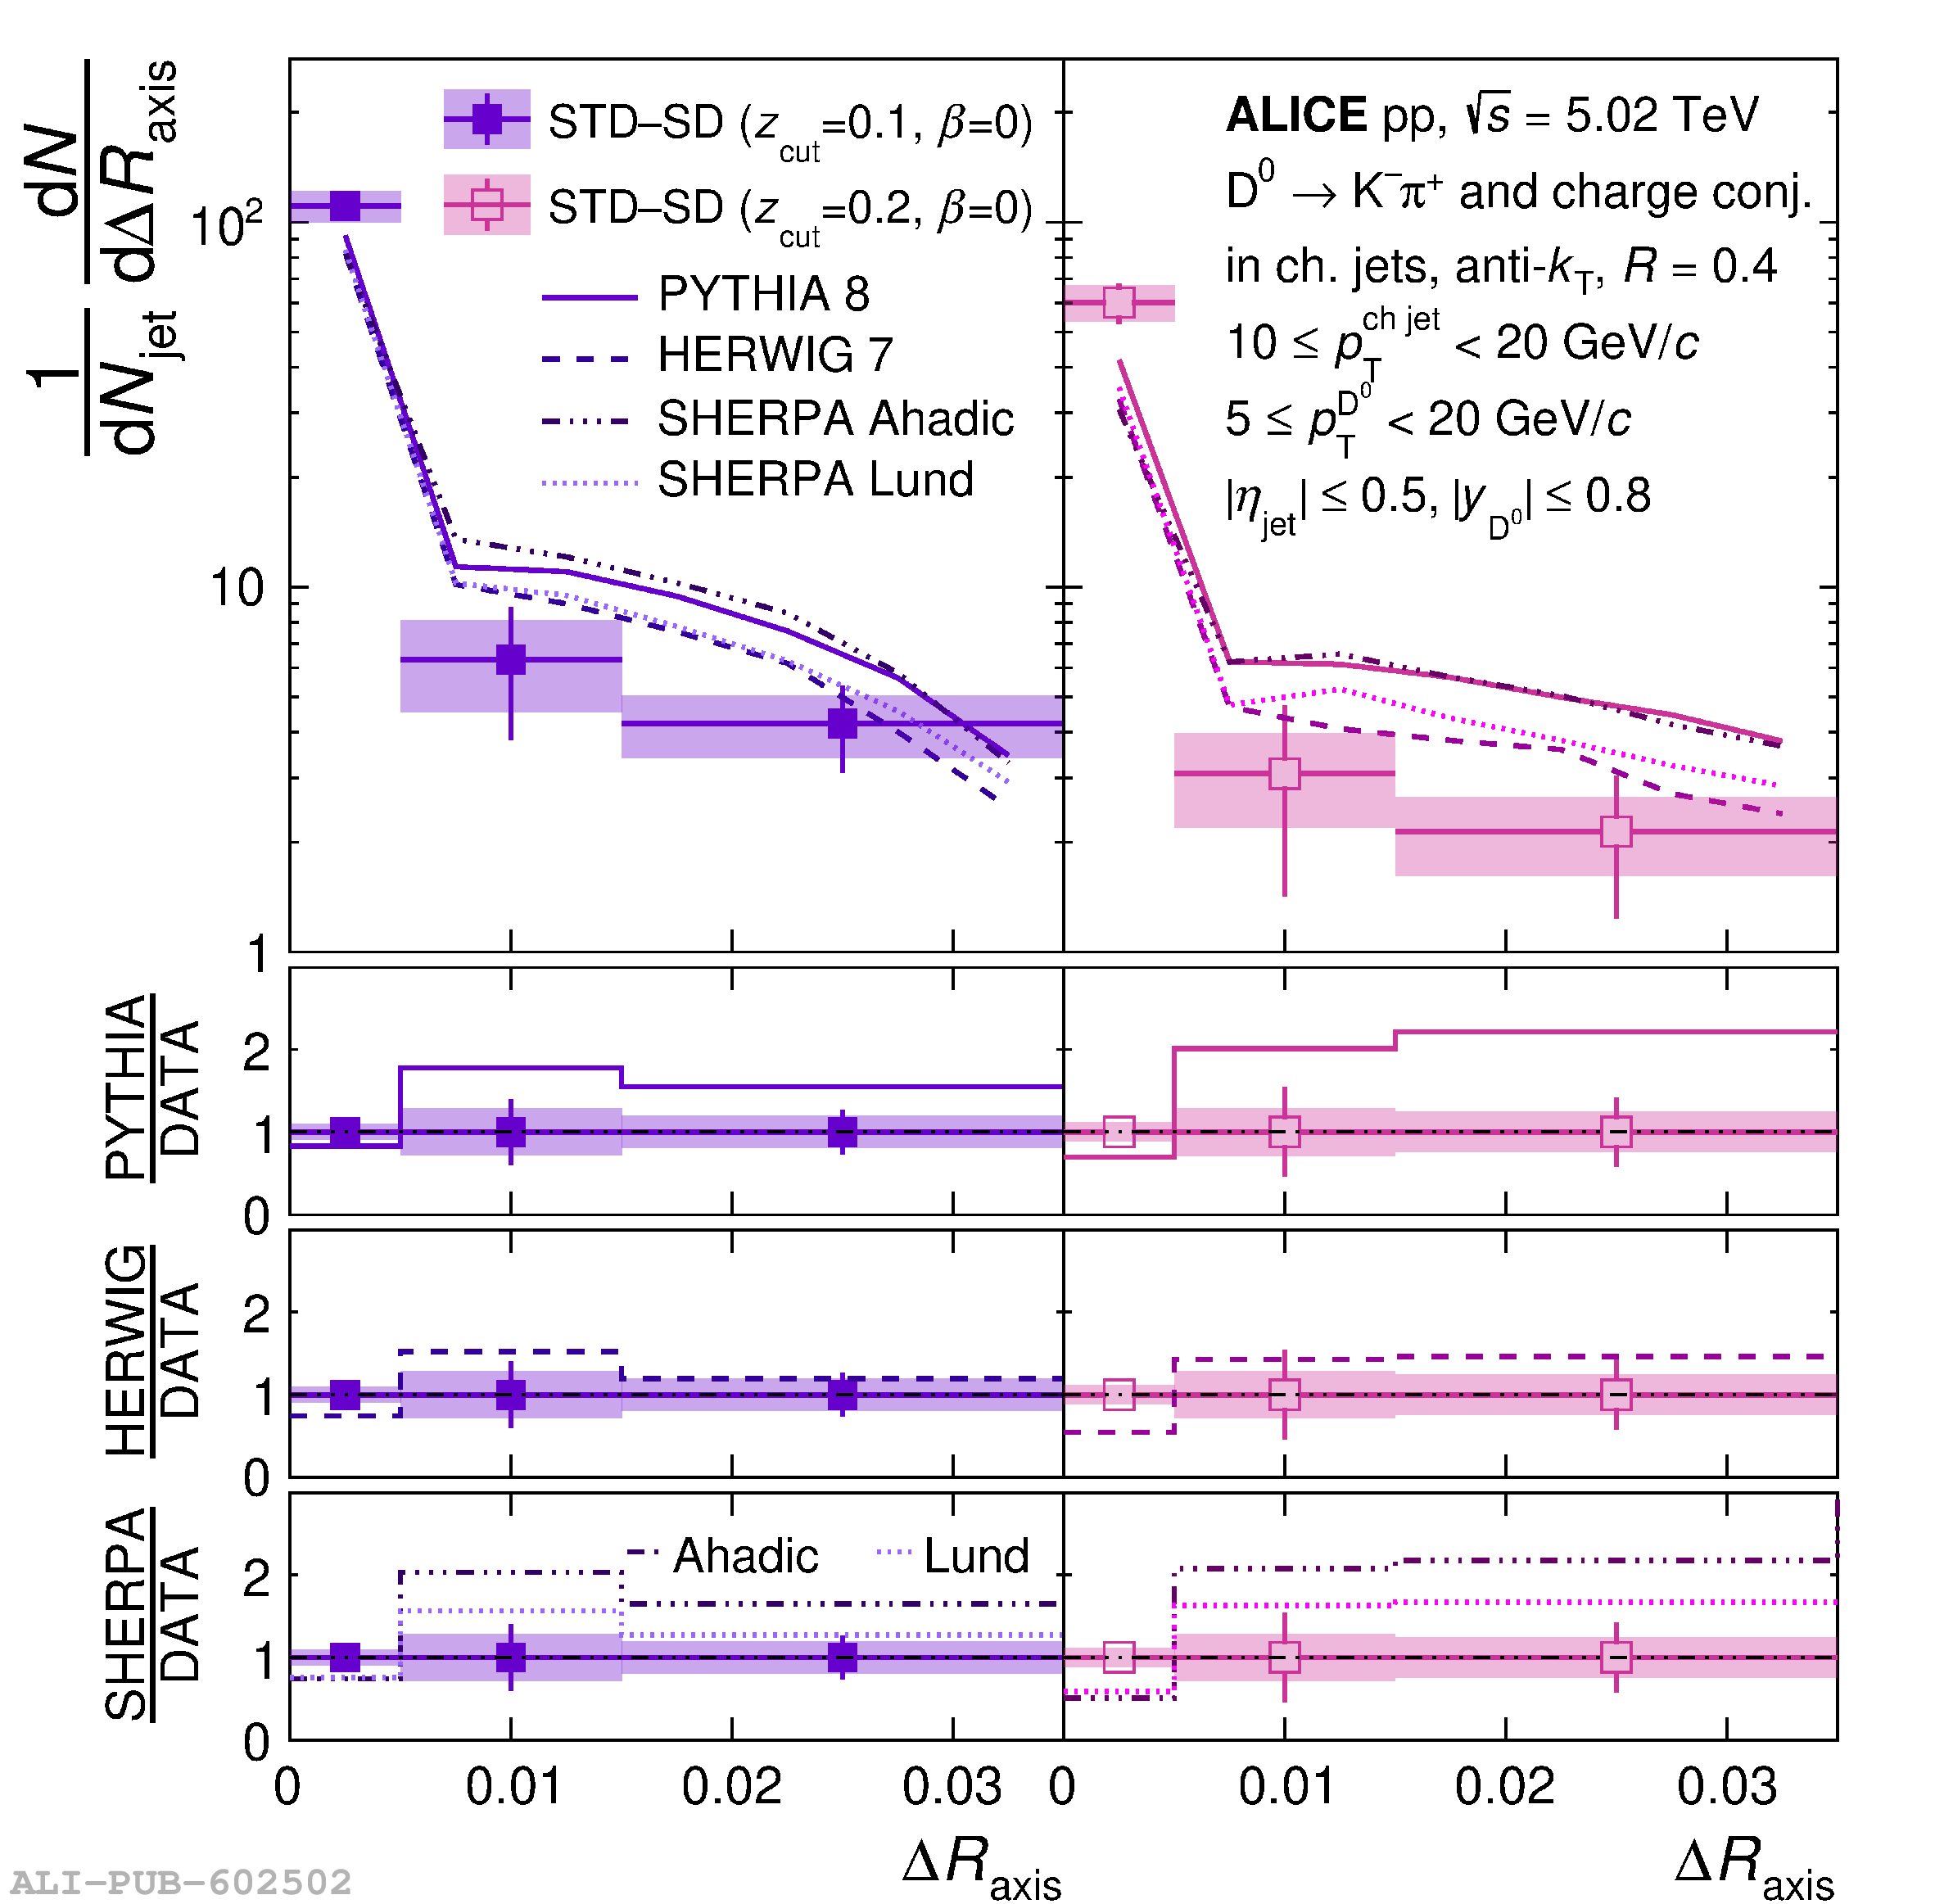 |
Figure 10
A representation of a prompt D$^0$-tagged jet, with the three jet axes (Standard, Soft Drop, and Winner-Takes-All) and the D$^0$ axis. The dead cone is represented by the red cones around the charm quark at each splitting. i) The Standard jet axis is calculated as the sum of the jet constituent four-momenta. ii) The Soft Drop jet axis is determined from the first splitting which passes the Soft Drop condition. In this example, it is satisfied by the second splitting following the charm quark. The first splitting does not satisfy the Soft Drop condition, thus the softer branch is removed. iii) The Winner-Takes-All jet axis aligns with the hardest subjet in the hardest branch at each splitting. | 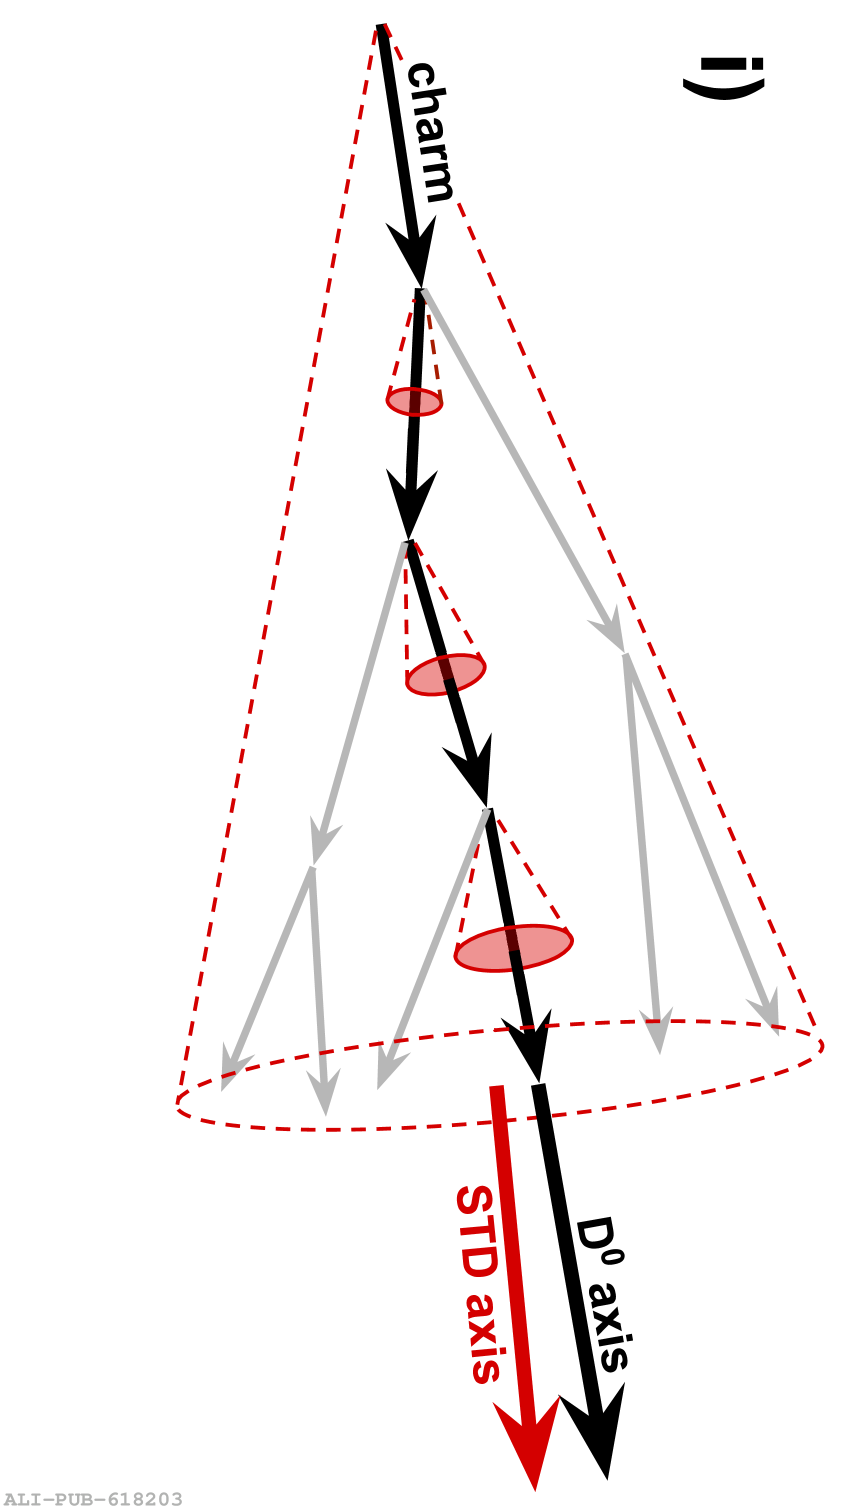 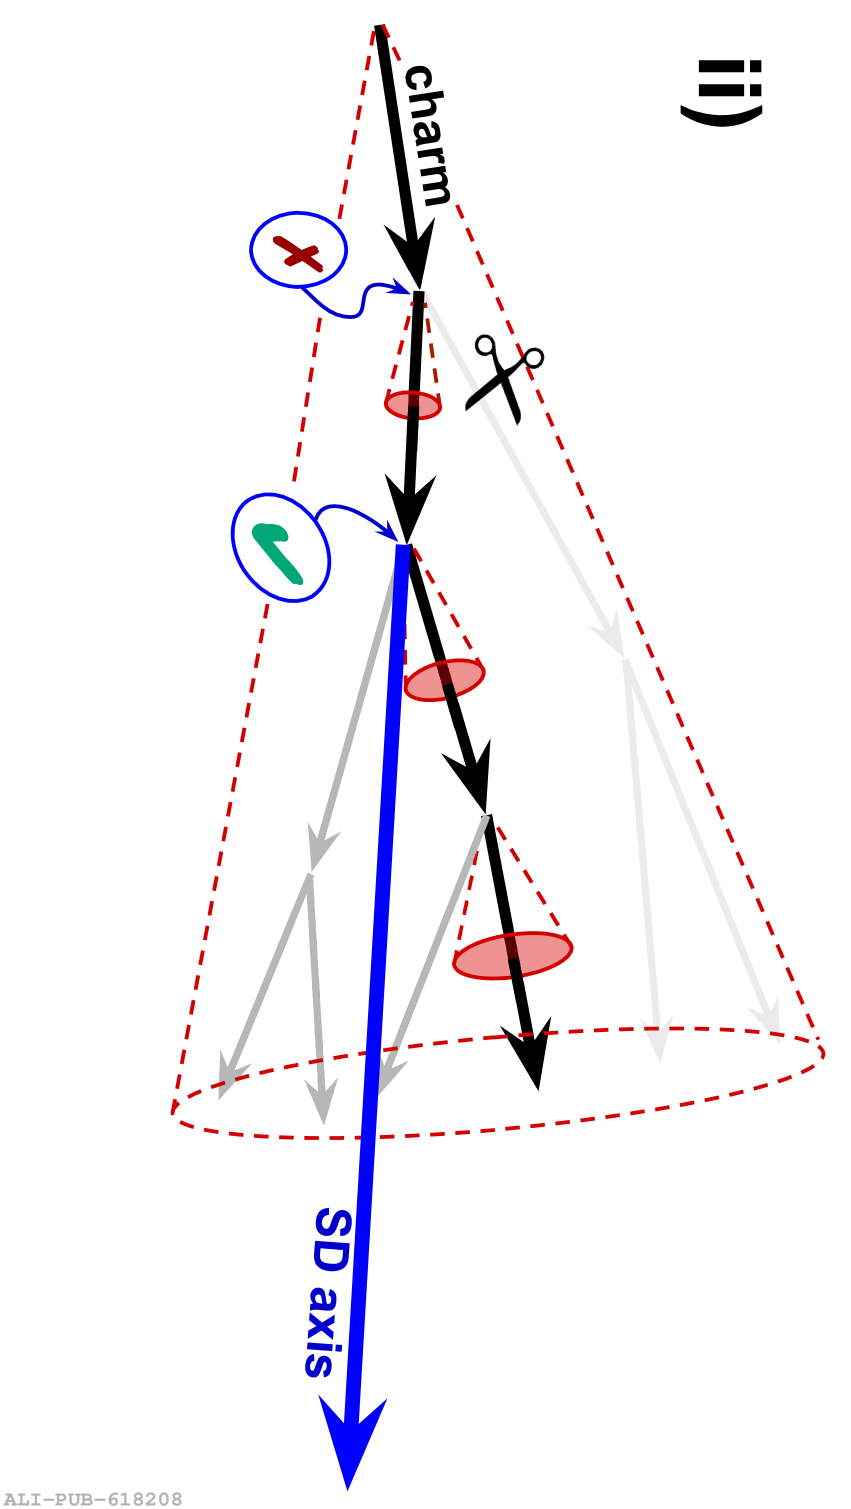 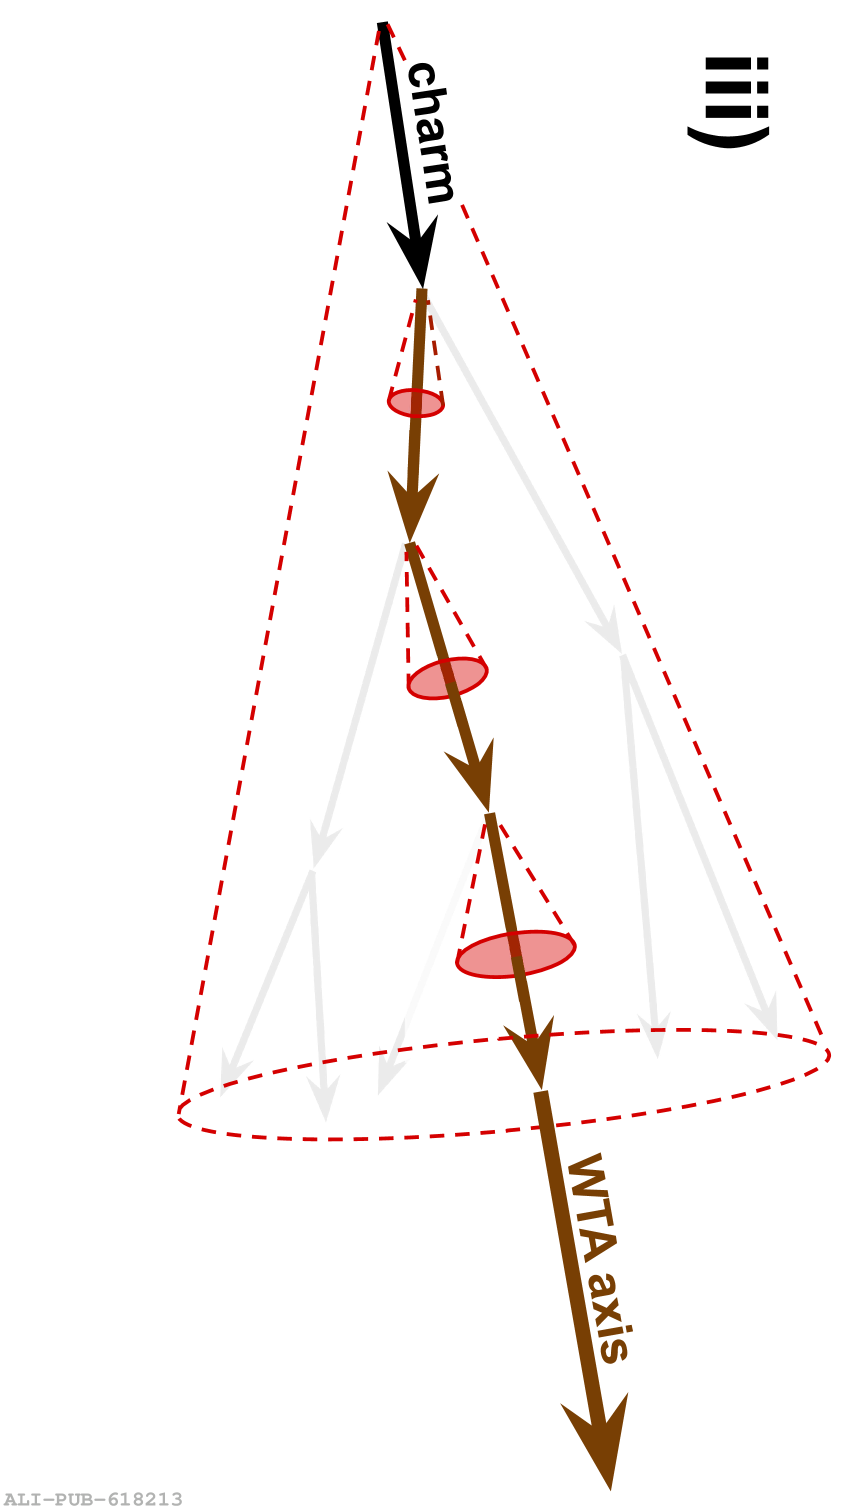 |
Figure 11
PYTHIA 8 predictions of the jet axes difference distributions for $\Delta R_{\rm STD-WTA}$ and $\Delta R_{\rm WTA-SD}$, where the Soft Drop parameters are $\beta=0$ and $z_{\rm cut}= 0.1$ or $0.2$, in $10< p_{\rm T}^{\rm ch jet} < 20$ GeV/$c$ . The top panels show the normalized distributions. Left: D$^0$-tagged jets compared to inclusive jets. Middle: D$^0$-tagged jets compared to gluon-initiated jets. Right: D$^0$-tagged jets compared to light-quark-initiated jets. | 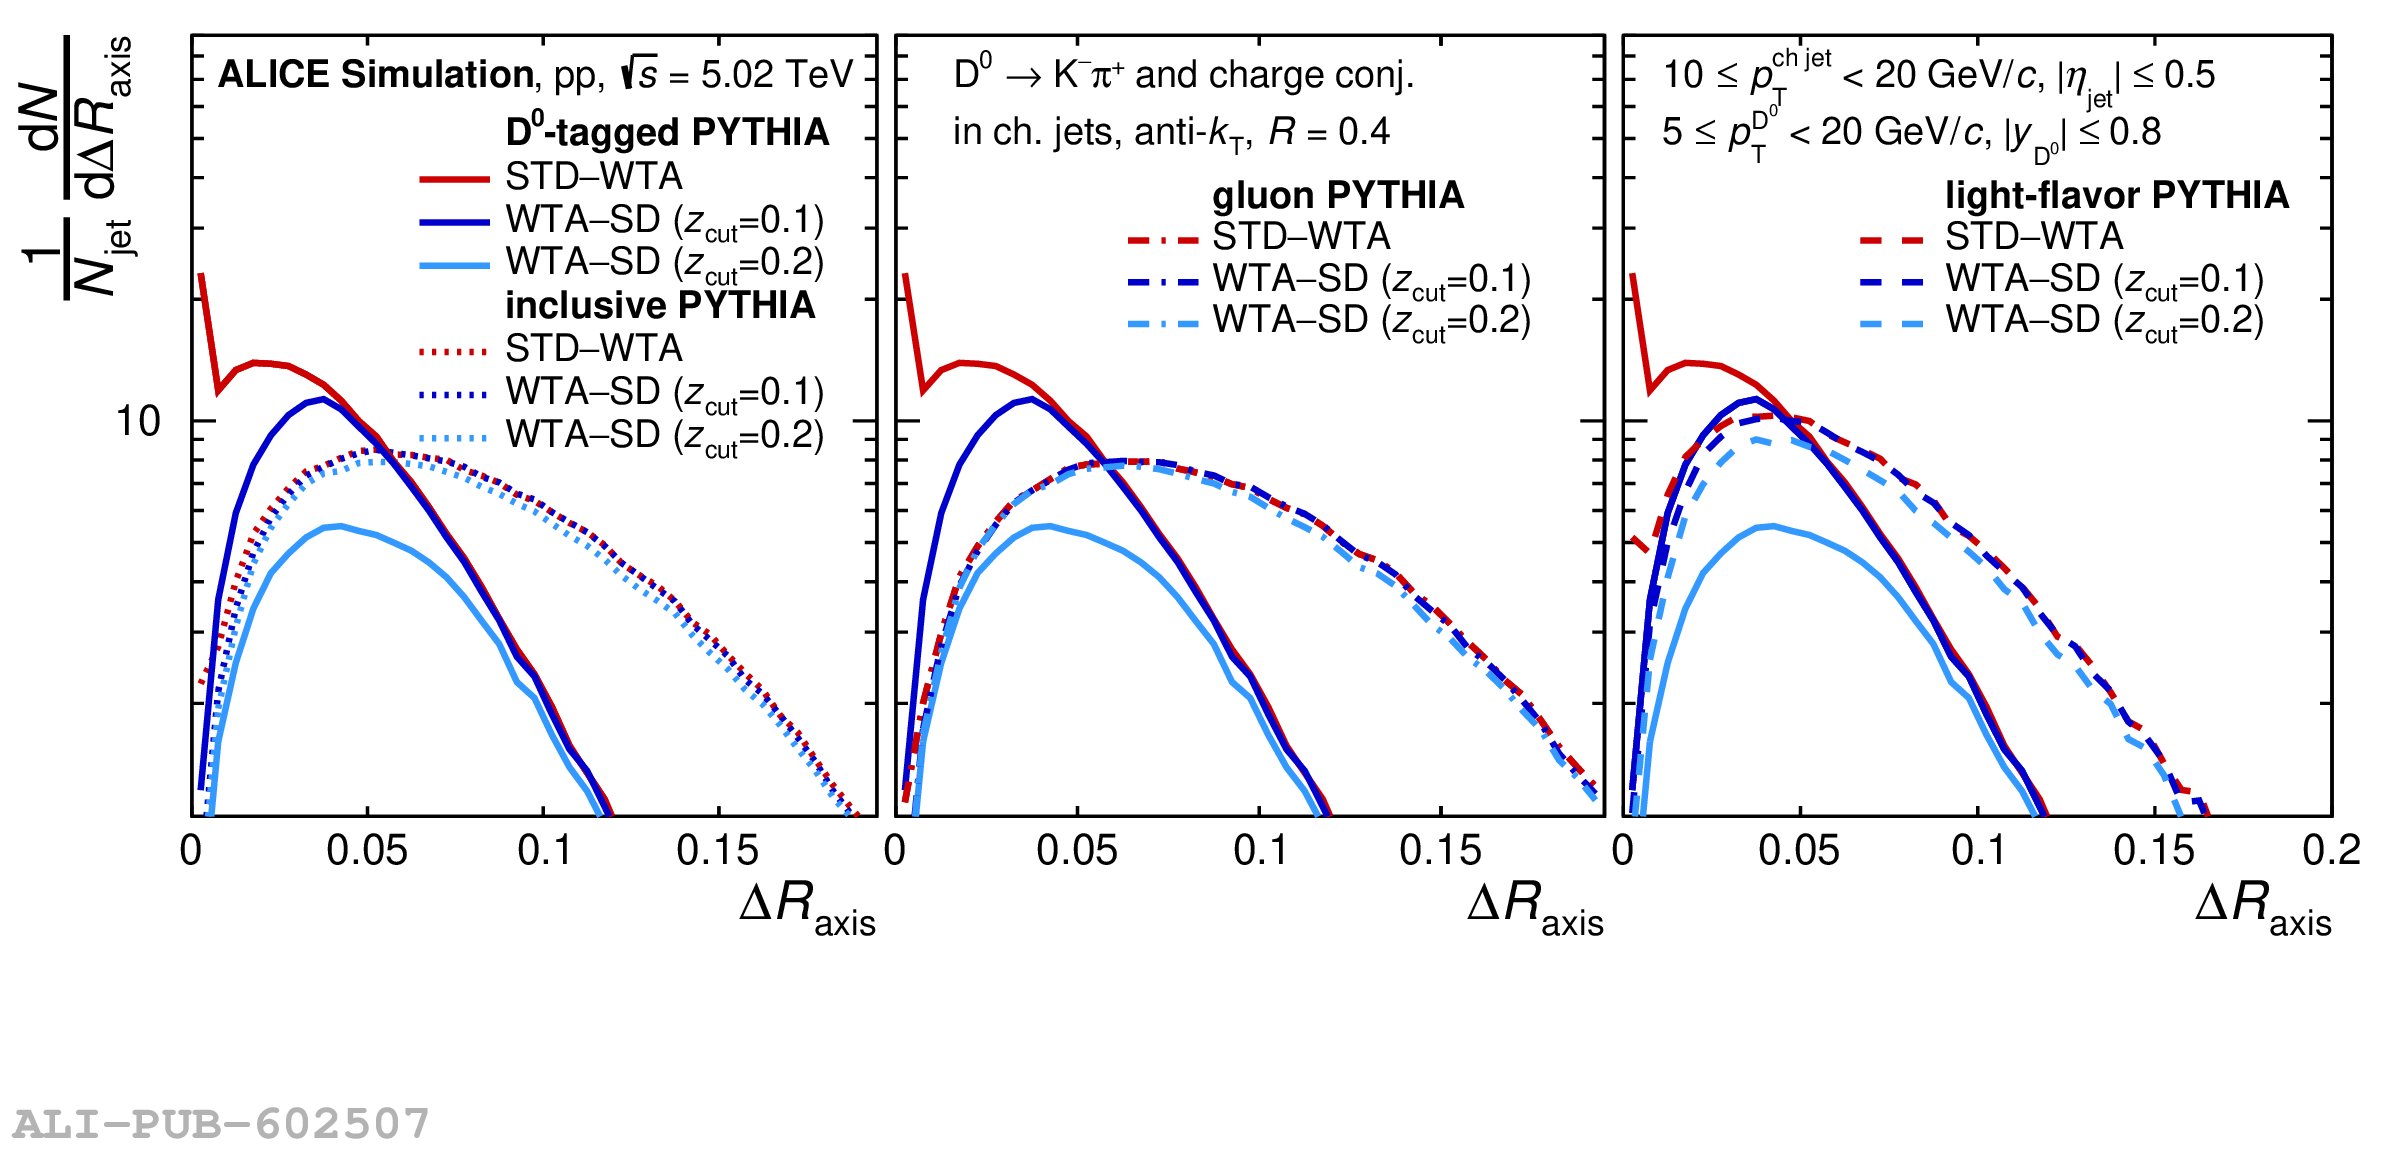 |
Figure 12
Fully unfolded jet axes difference distributions for $\Delta R_{\rm STD-SD}$ (left) and $\Delta R_{\rm SD-D^0}$ (right), in $10< p_{\rm T}^{\rm ch jet} < 20$ GeV/$c$. The Soft Drop parameter, $z_{\rm cut}$, is varied between $z_{\rm cut}=0.1$ and $z_{\rm cut}=0.2$; the parameter $\beta=0$ throughout. Systematic and statistical uncertainties are represented by color boxes and error bars, respectively. Comparisons to MC event generators are included. The bottom panel shows a ratio of the $z_{\rm cut}=0.2$ distribution over the $z_{\rm cut}=0.1$ distribution for $\Delta R_{\rm SD-D^0}$ and $\Delta R_{\rm STD-SD}$. These ratios are taken for both the D$^0$-tagged data and each MC event generator. | 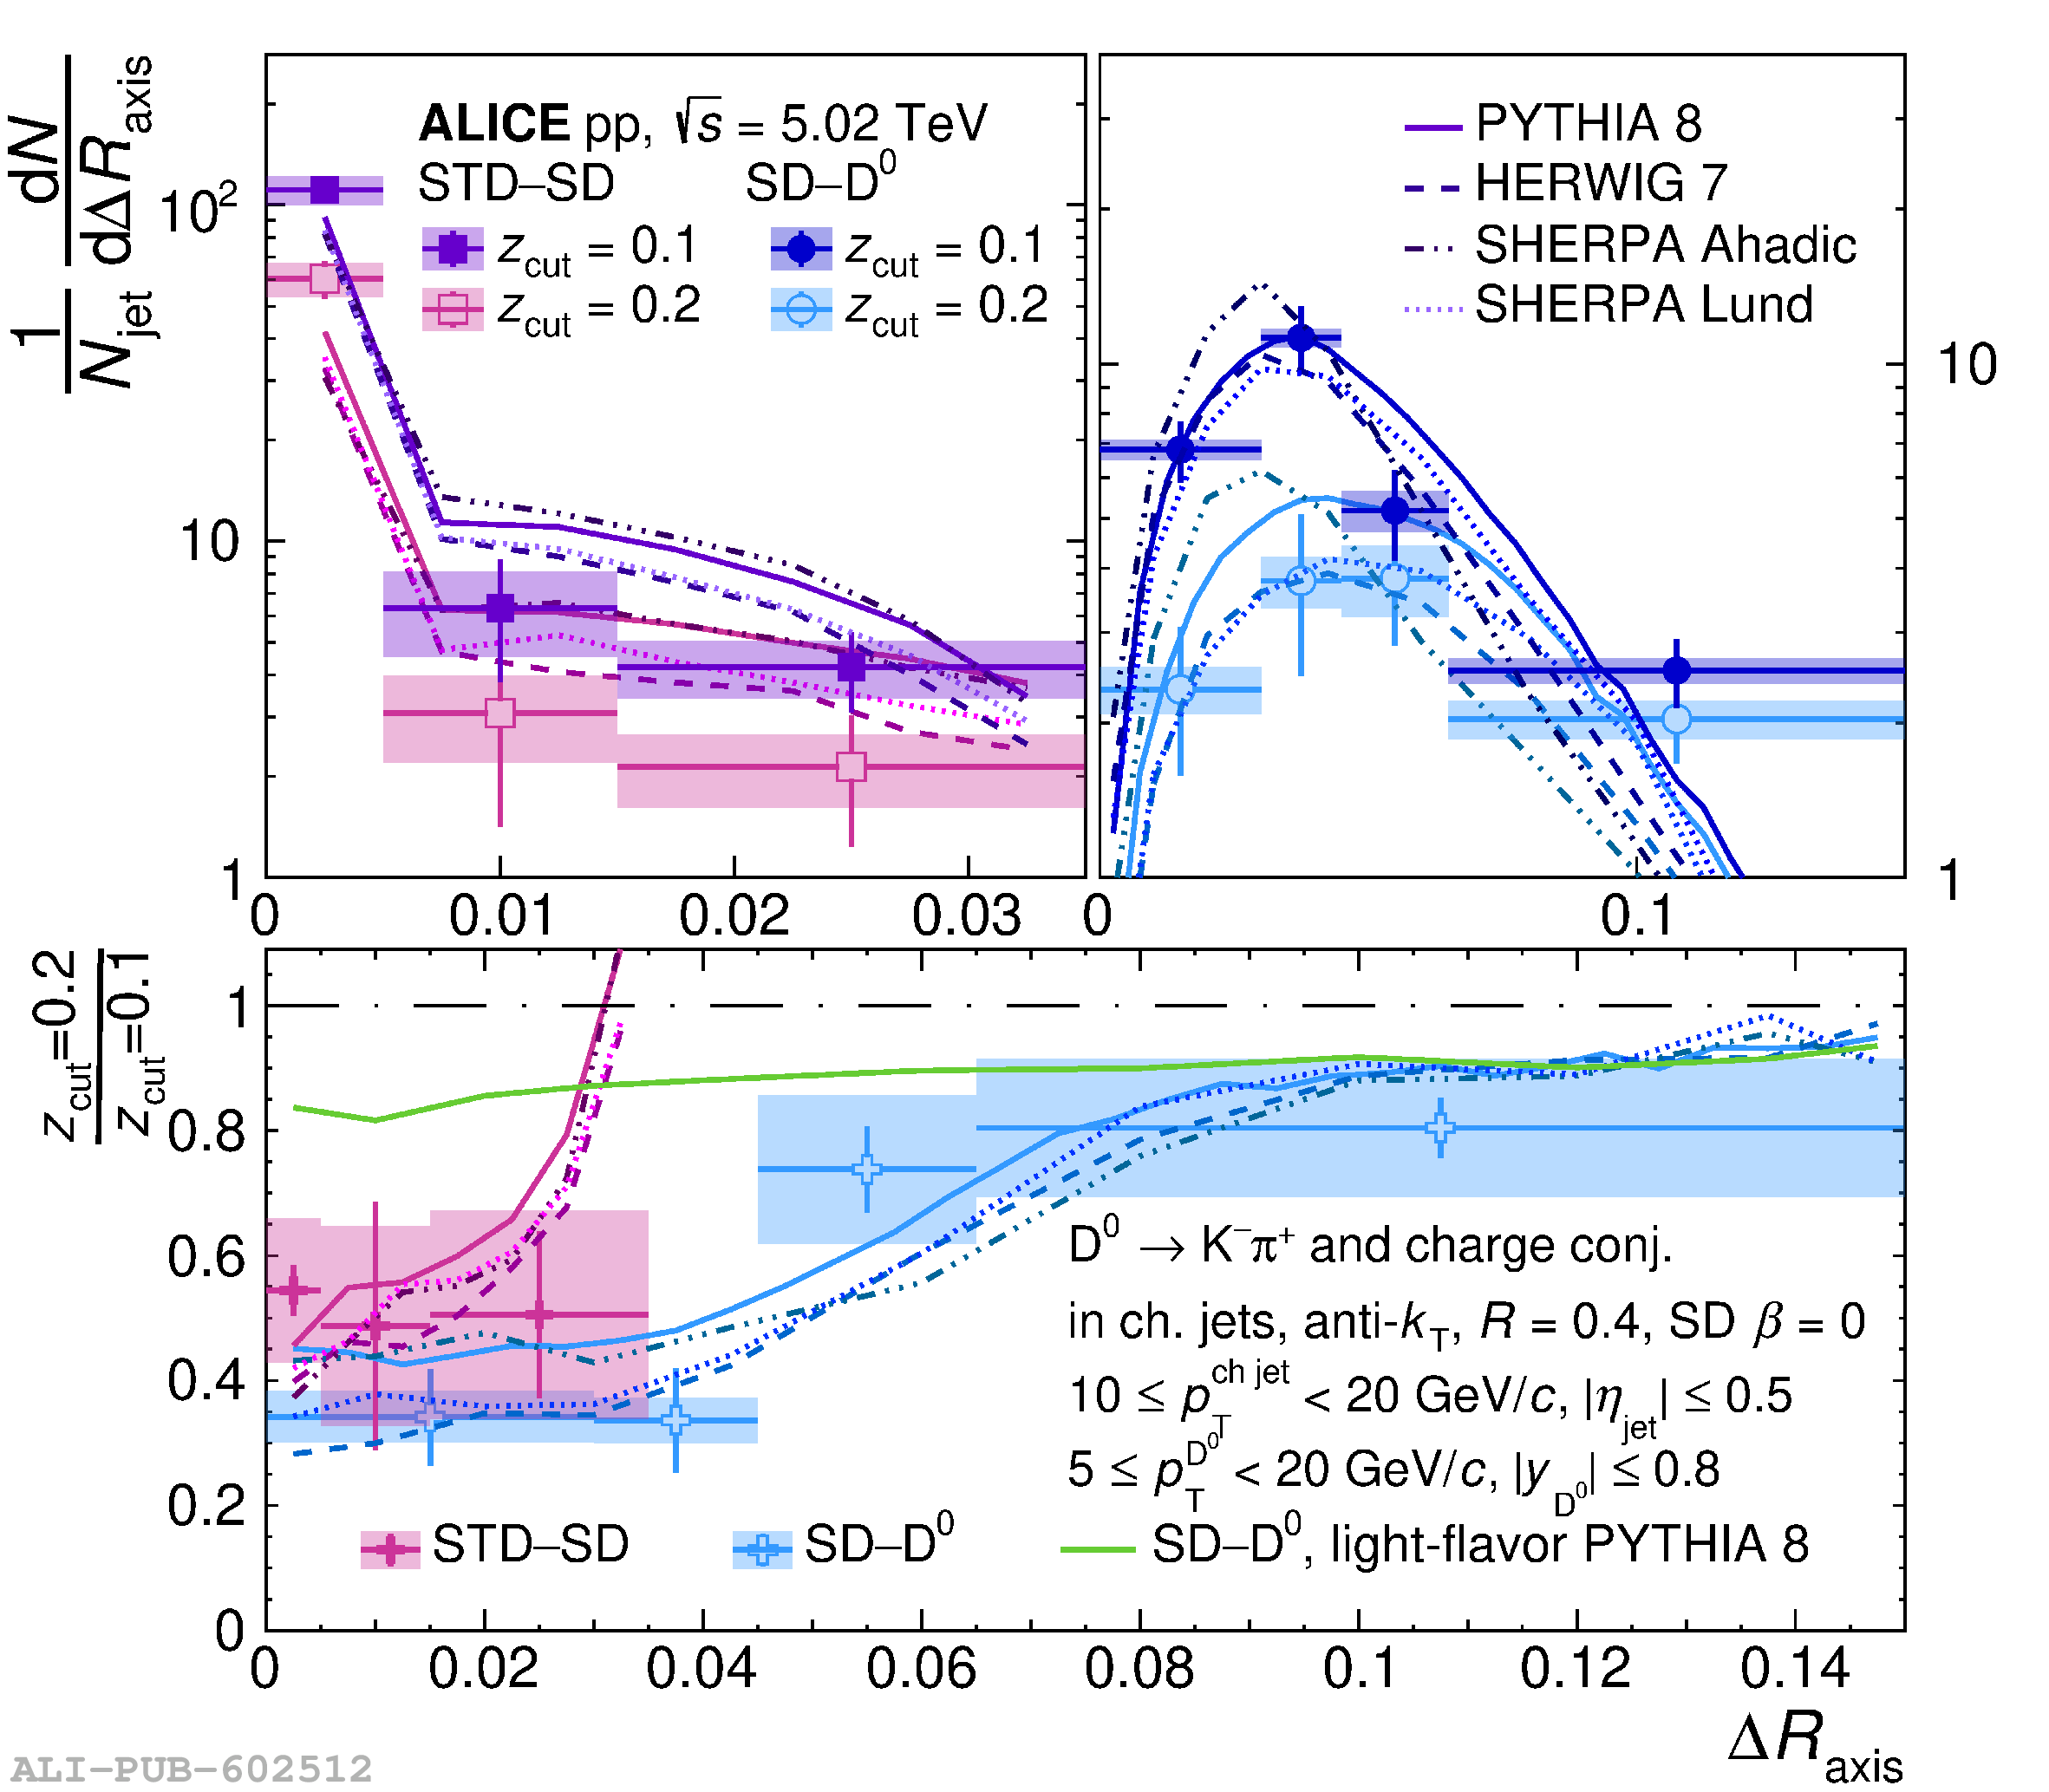 |