High-energy hadronic collisions generate environments characterized by temperatures above 100 MeV [1,2], about 100,000 times hotter than the center of the Sun. It is therefore currently unclear how light (anti)nuclei with mass number A of a few units, such as the deuteron, $^3$He, or $^4$He, each bound by only a few MeV, can emerge from these collisions [3,4]. The ALICE collaboration reports that deuteron-pion momentum correlations in proton-proton (pp) collisions provide model-independent evidence that about 90% of the observed (anti)deuterons are produced in nuclear reactions [5] following the decay of short-lived resonances, such as the $Δ(1232)$. These findings, obtained by the ALICE experiment at the Large Hadron Collider (LHC) resolve a gap in our understanding of nucleosynthesis in ultra-relativistic hadronic collisions. Beyond offering insights on how (anti)nuclei are formed in hadronic collisions, the results can be employed in the modeling of the production of light and heavy nuclei in cosmic rays [6] and dark matter decays [7,8].
Nature 648, 306–311 (2025)
HEP Data
e-Print: arXiv:2504.02393 | PDF | inSPIRE
CERN-EP-2025-081
Figure group
Figure 1
(Anti)deuteron production scenarios. Illustration of three scenarios for deuteron production and interaction with pions (left) and the resulting $\pi^{\pm}$$-$${\rm d}$ correlation functions (right). All scenarios include Coulomb attraction between $\pi^-$$-$d (green curves) and Coulomb repulsion between the $\pi^+$--d (red curves). The dashed lines always show the correlation function using Coulomb interaction. Scenarios (i) and (ii) represent thermally-produced deuterons with only Coulomb and Coulomb+elastic+inelastic interactions, respectively. Scenario (iii) depicts deuteron formation via nuclear binding following $\Delta$-resonance decays. All the simulations include the charge conjugates ($\pi^{+}-{\rm d} \equiv \pi^{+}-{\rm d} \oplus$ $\pi^{-}-\bar{\rm d}$ and $\pi^{-}-{\rm d} \equiv \pi^{-}-{\rm d} \oplus$ $\pi^{+}-\bar{\rm d}$). The bands width corresponds to the statistical uncertainties of the models. | 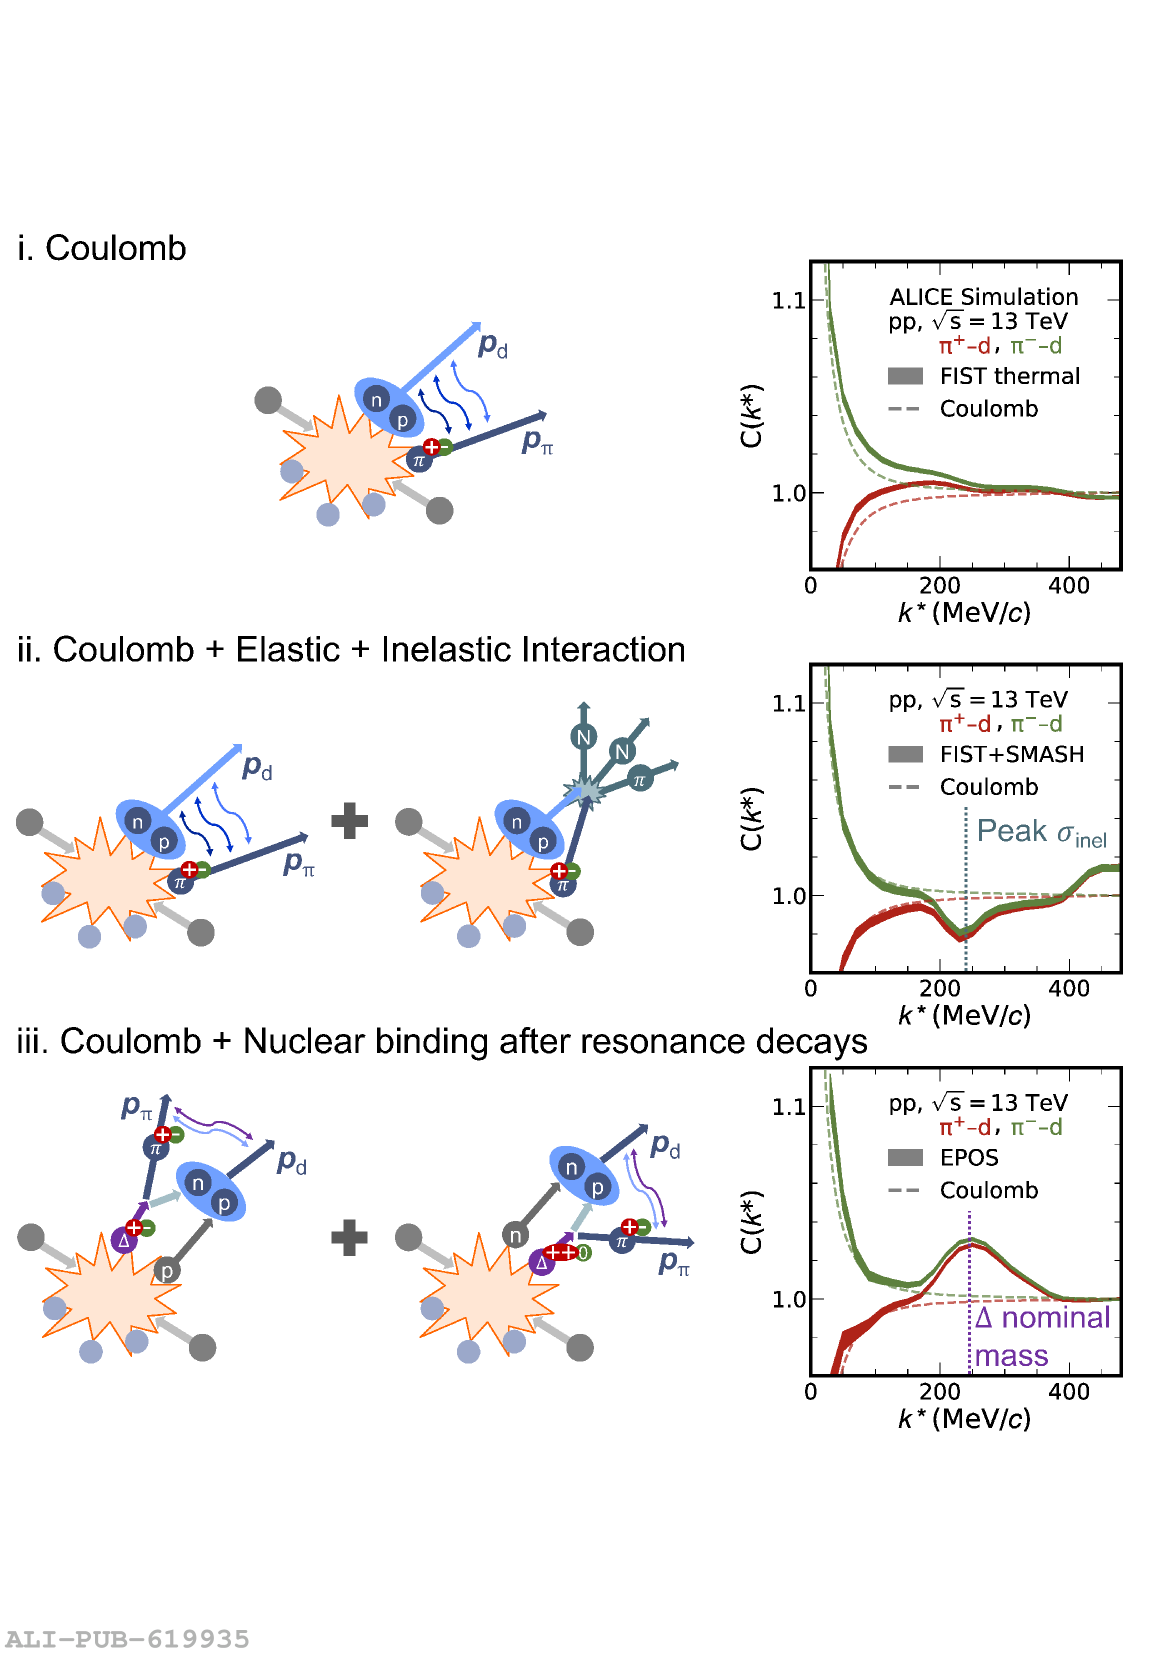 |
Figure 2
Experimental \piMd and \piPd correlation functions. The data are obtained from high-multiplicity pp collisions at $\sqrt{s} = 13$ TeV. The top panel shows the measured $\pi^{-}-{\rm d}$ correlation function together with the corresponding fit function (magenta). The brown cross-hatched band represents contributions from the $\Delta$ resonance, the blue band denotes the Coulomb and strong FSI interactions, and the teal diagonally hatched band corresponds to the residual background. The widths of the bands indicate the fit uncertainty. The lower panel depicts, in the same representation, the $\pi^{+}-{\rm d}$ correlation function. However, the strong FSI interaction is neglected for this system. The $\chi^2$ per degree of freedom is 14/15 for both correlations. | 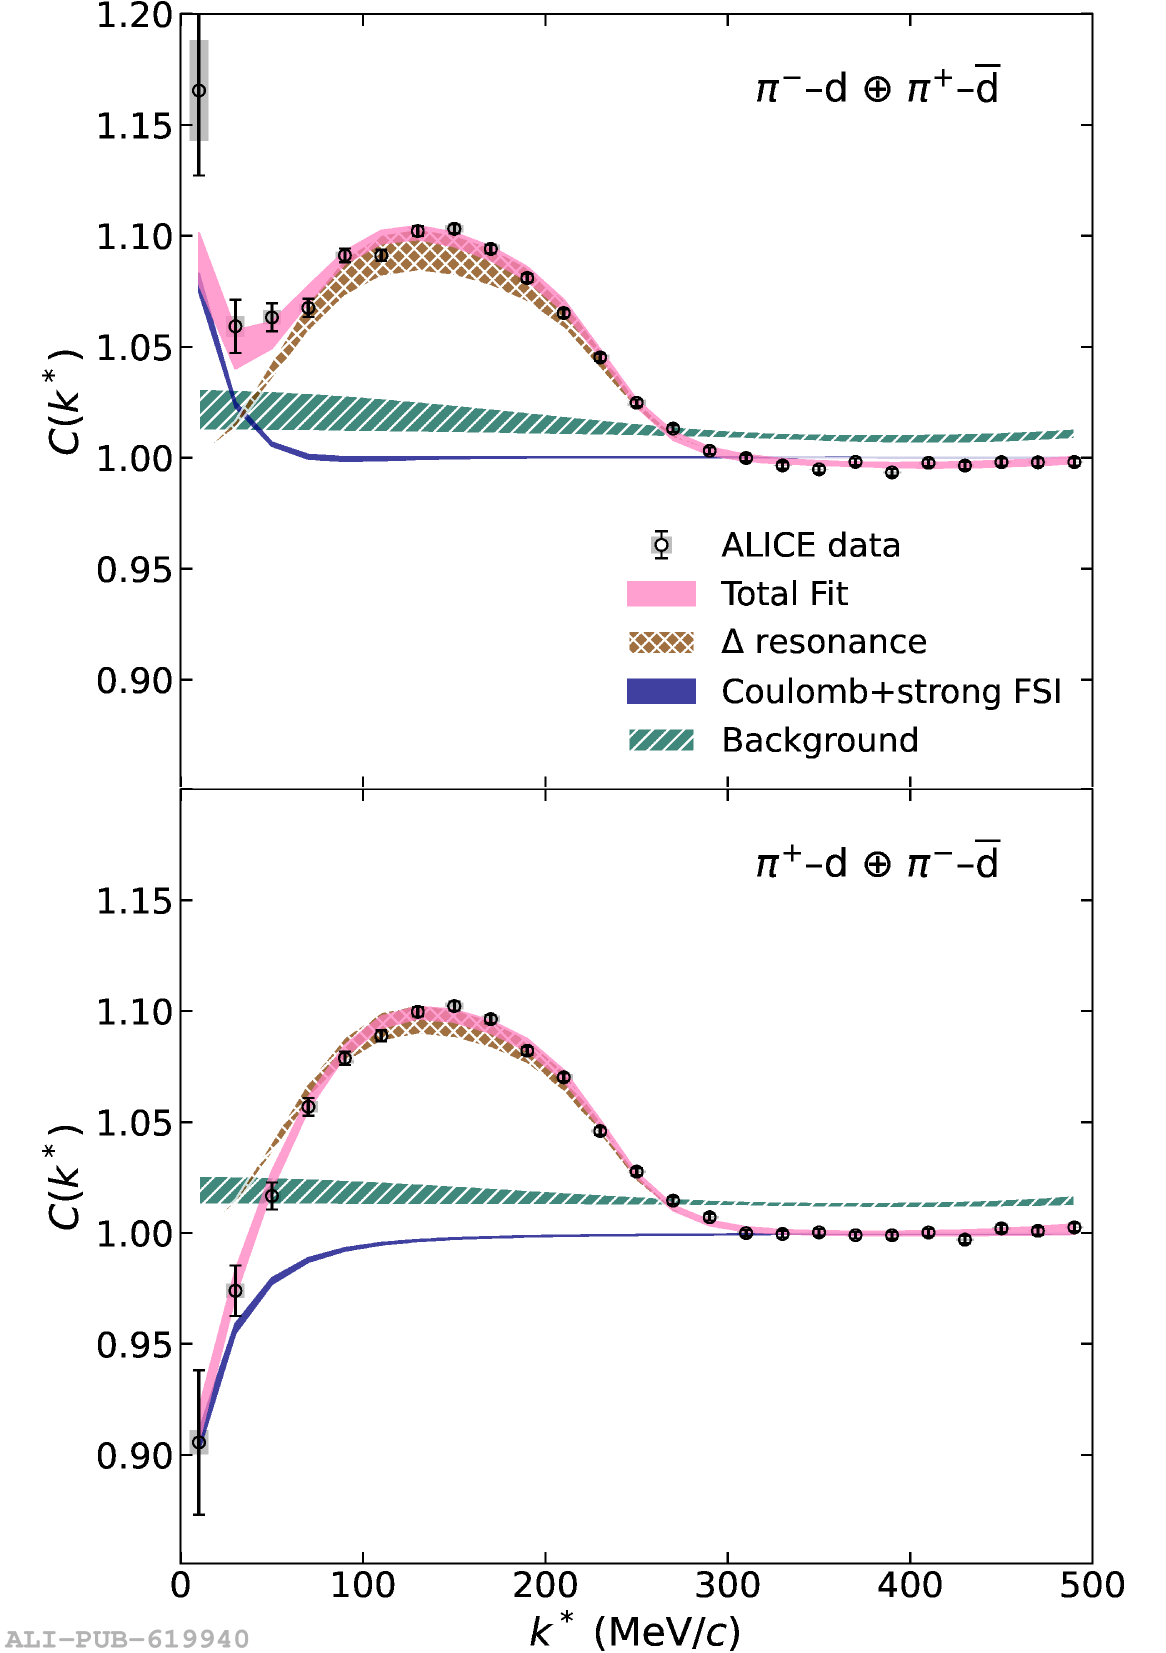 |
Figure A.1
Extracted $\Delta$ spectral temperature. The $\Delta$ spectral temperature is derived from $\pi^{\pm}-$p and $\pi^{\pm}-$d correlation functions measured in high-multiplicity pp collisions at $\sqrt{s} = 13$ TeV. The bands correspond to the uncertainties obtained by fits to the correlation functions, incorporating systematic uncertainties on the measured data, as well as those arising from variations in the source size and the $\lambda$ parameter for the genuine interaction. | 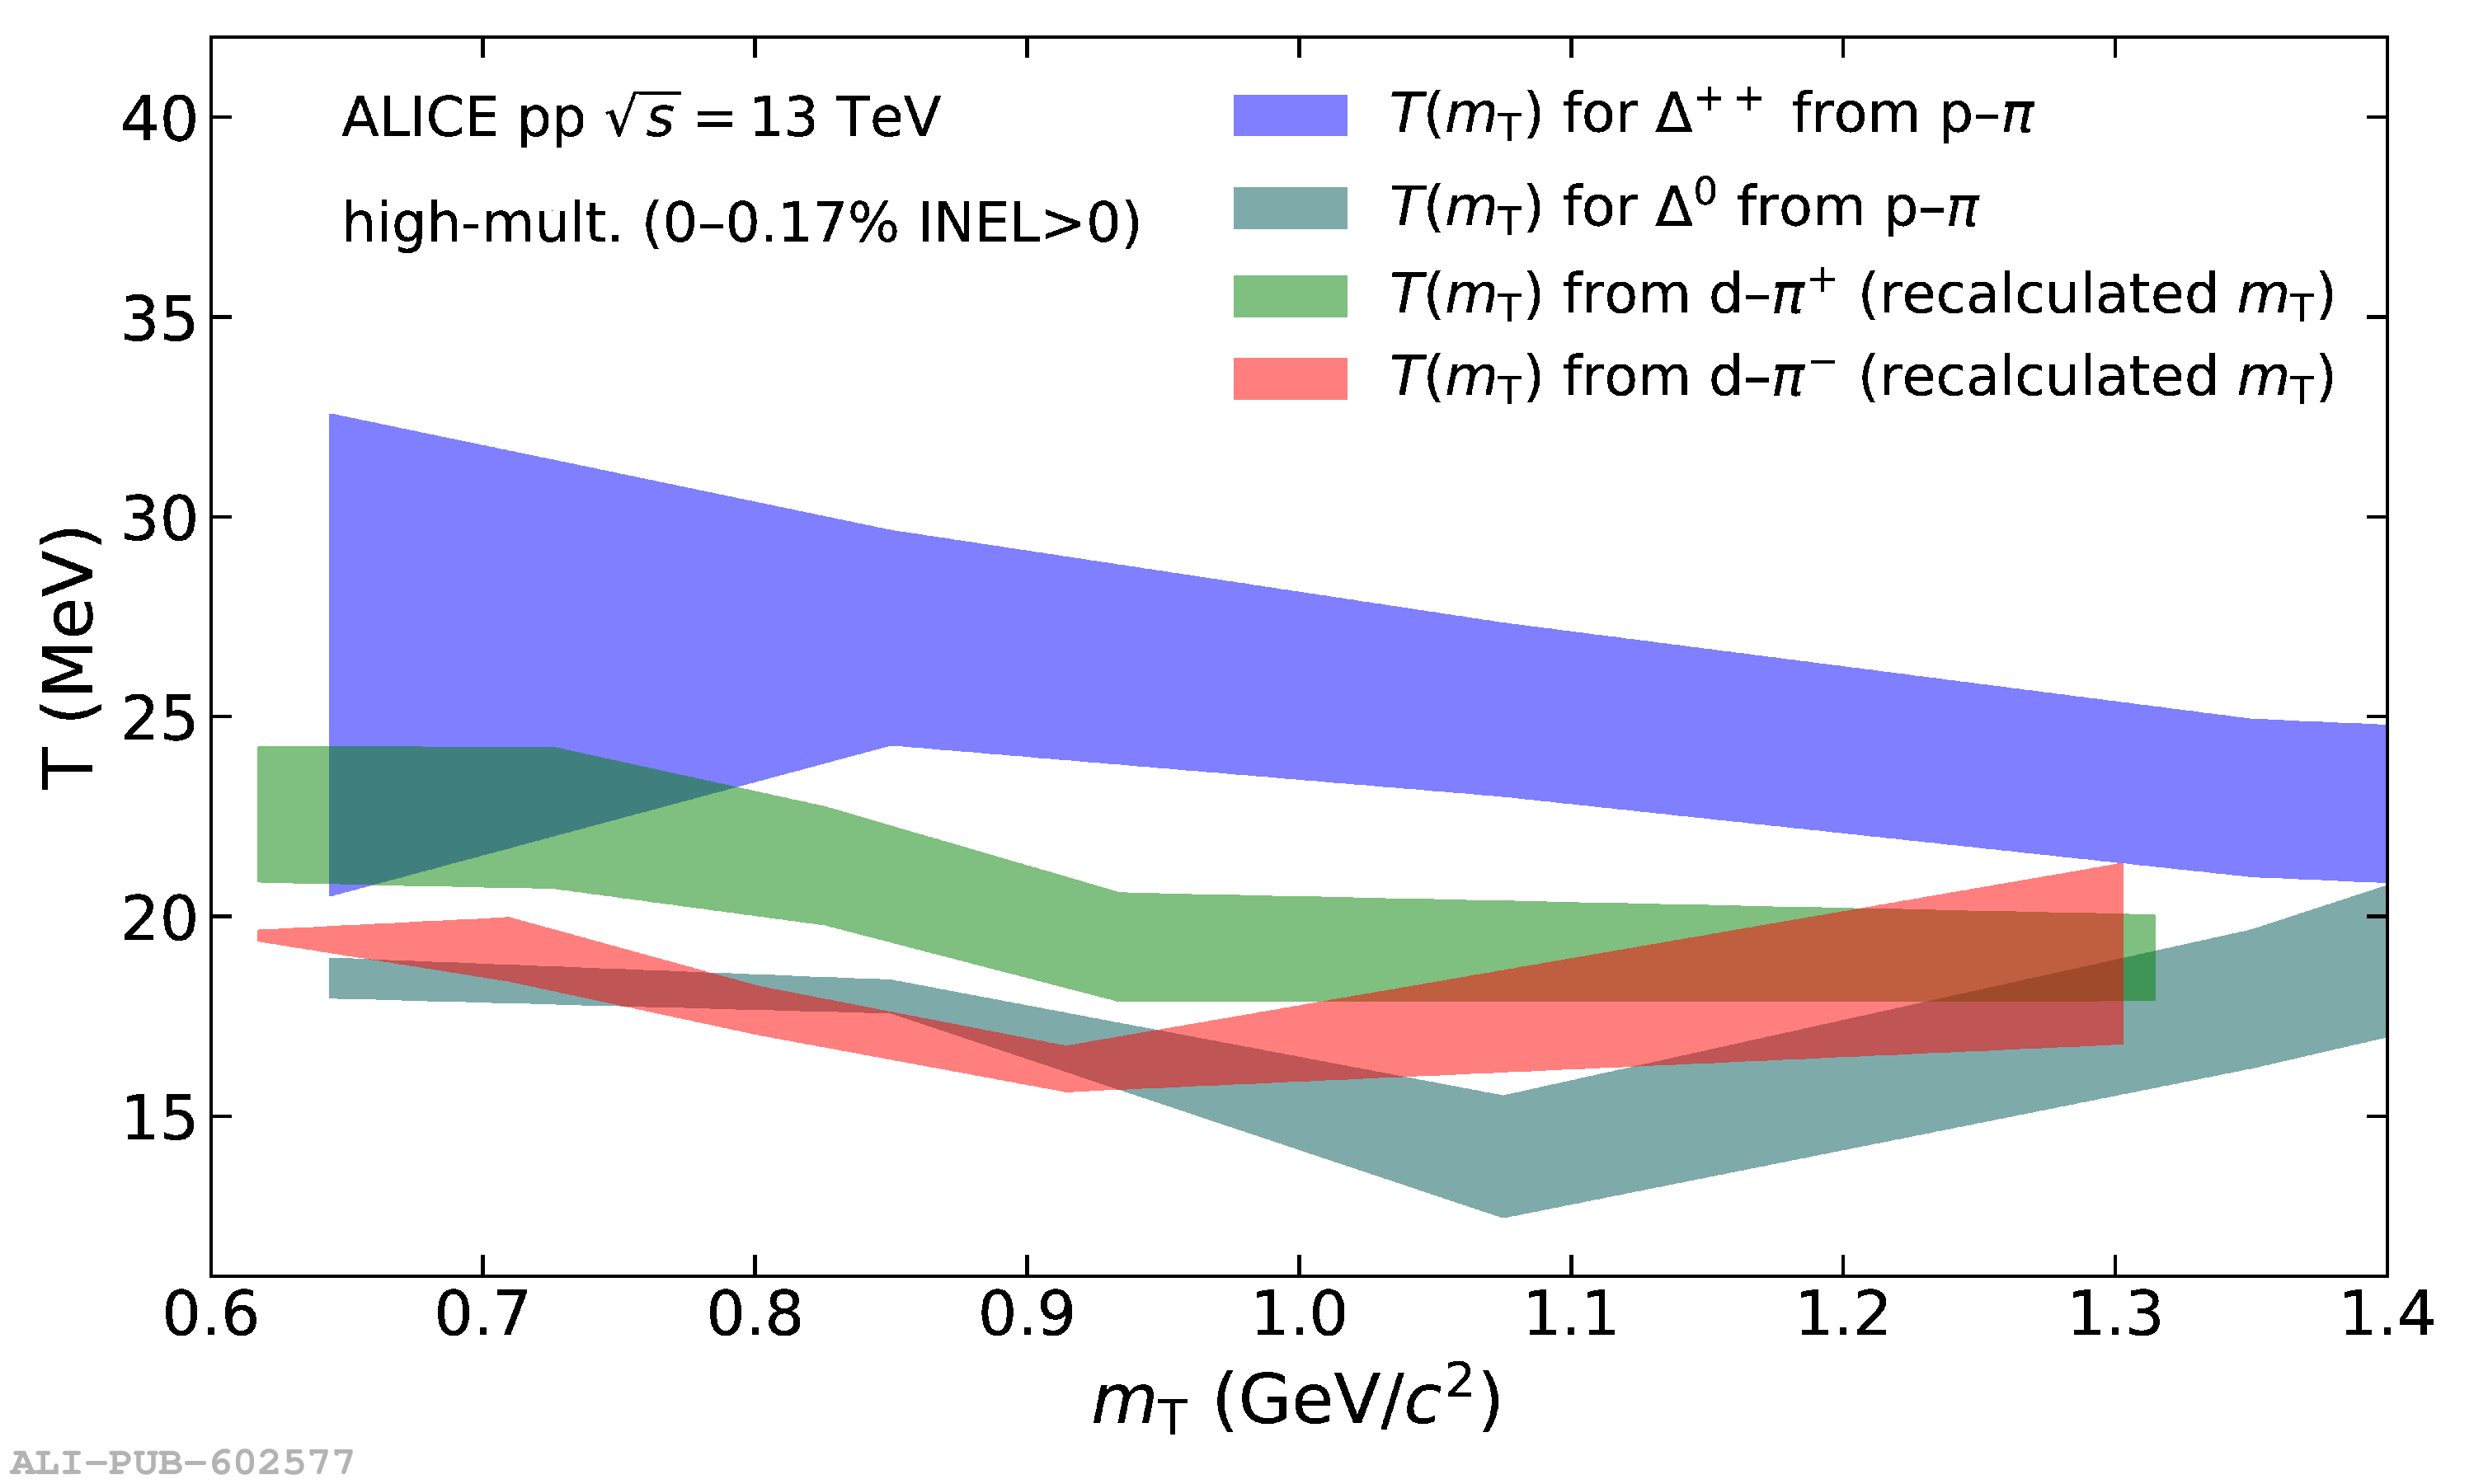 |