Multiplicity-dependent inclusive J/$ψ$ production at forward rapidity in pp collisions at $\mathbf{\sqrt{s} = 13}$ TeV

This paper presents a study of the inclusive forward J/$\psi$ yield as a function of forward charged-particle multiplicity in pp collisions at $\sqrt{s} = 13$ TeV using data collected by the ALICE experiment at the CERN LHC. The results are presented in terms of relative J/$\psi$ yields and relative charged-particle multiplicities with respect to these quantities obtained in inelastic collisions having at least one charged particle in the pseudorapidity range $|\eta| <~ 1$. The J/$\psi$ mesons are reconstructed via their decay into $\mu^+ \mu^-$ pairs in the forward rapidity region ($2.5 <~ y <~ 4$). The relative multiplicity is estimated in the forward pseudorapidity range $-3.7 <~ \eta <~ -1.7$, which overlaps with the J/$\psi$ rapidity region. The results show a steeper-than-linear increase of the J/$\psi$ yields versus the multiplicity. They are compared with previous measurements and theoretical model calculations.


Submitted to: JHEP
e-Print: arXiv:2504.00686 | PDF | inSPIRE
CERN-EP-2025-070
Figure group

Figure 1

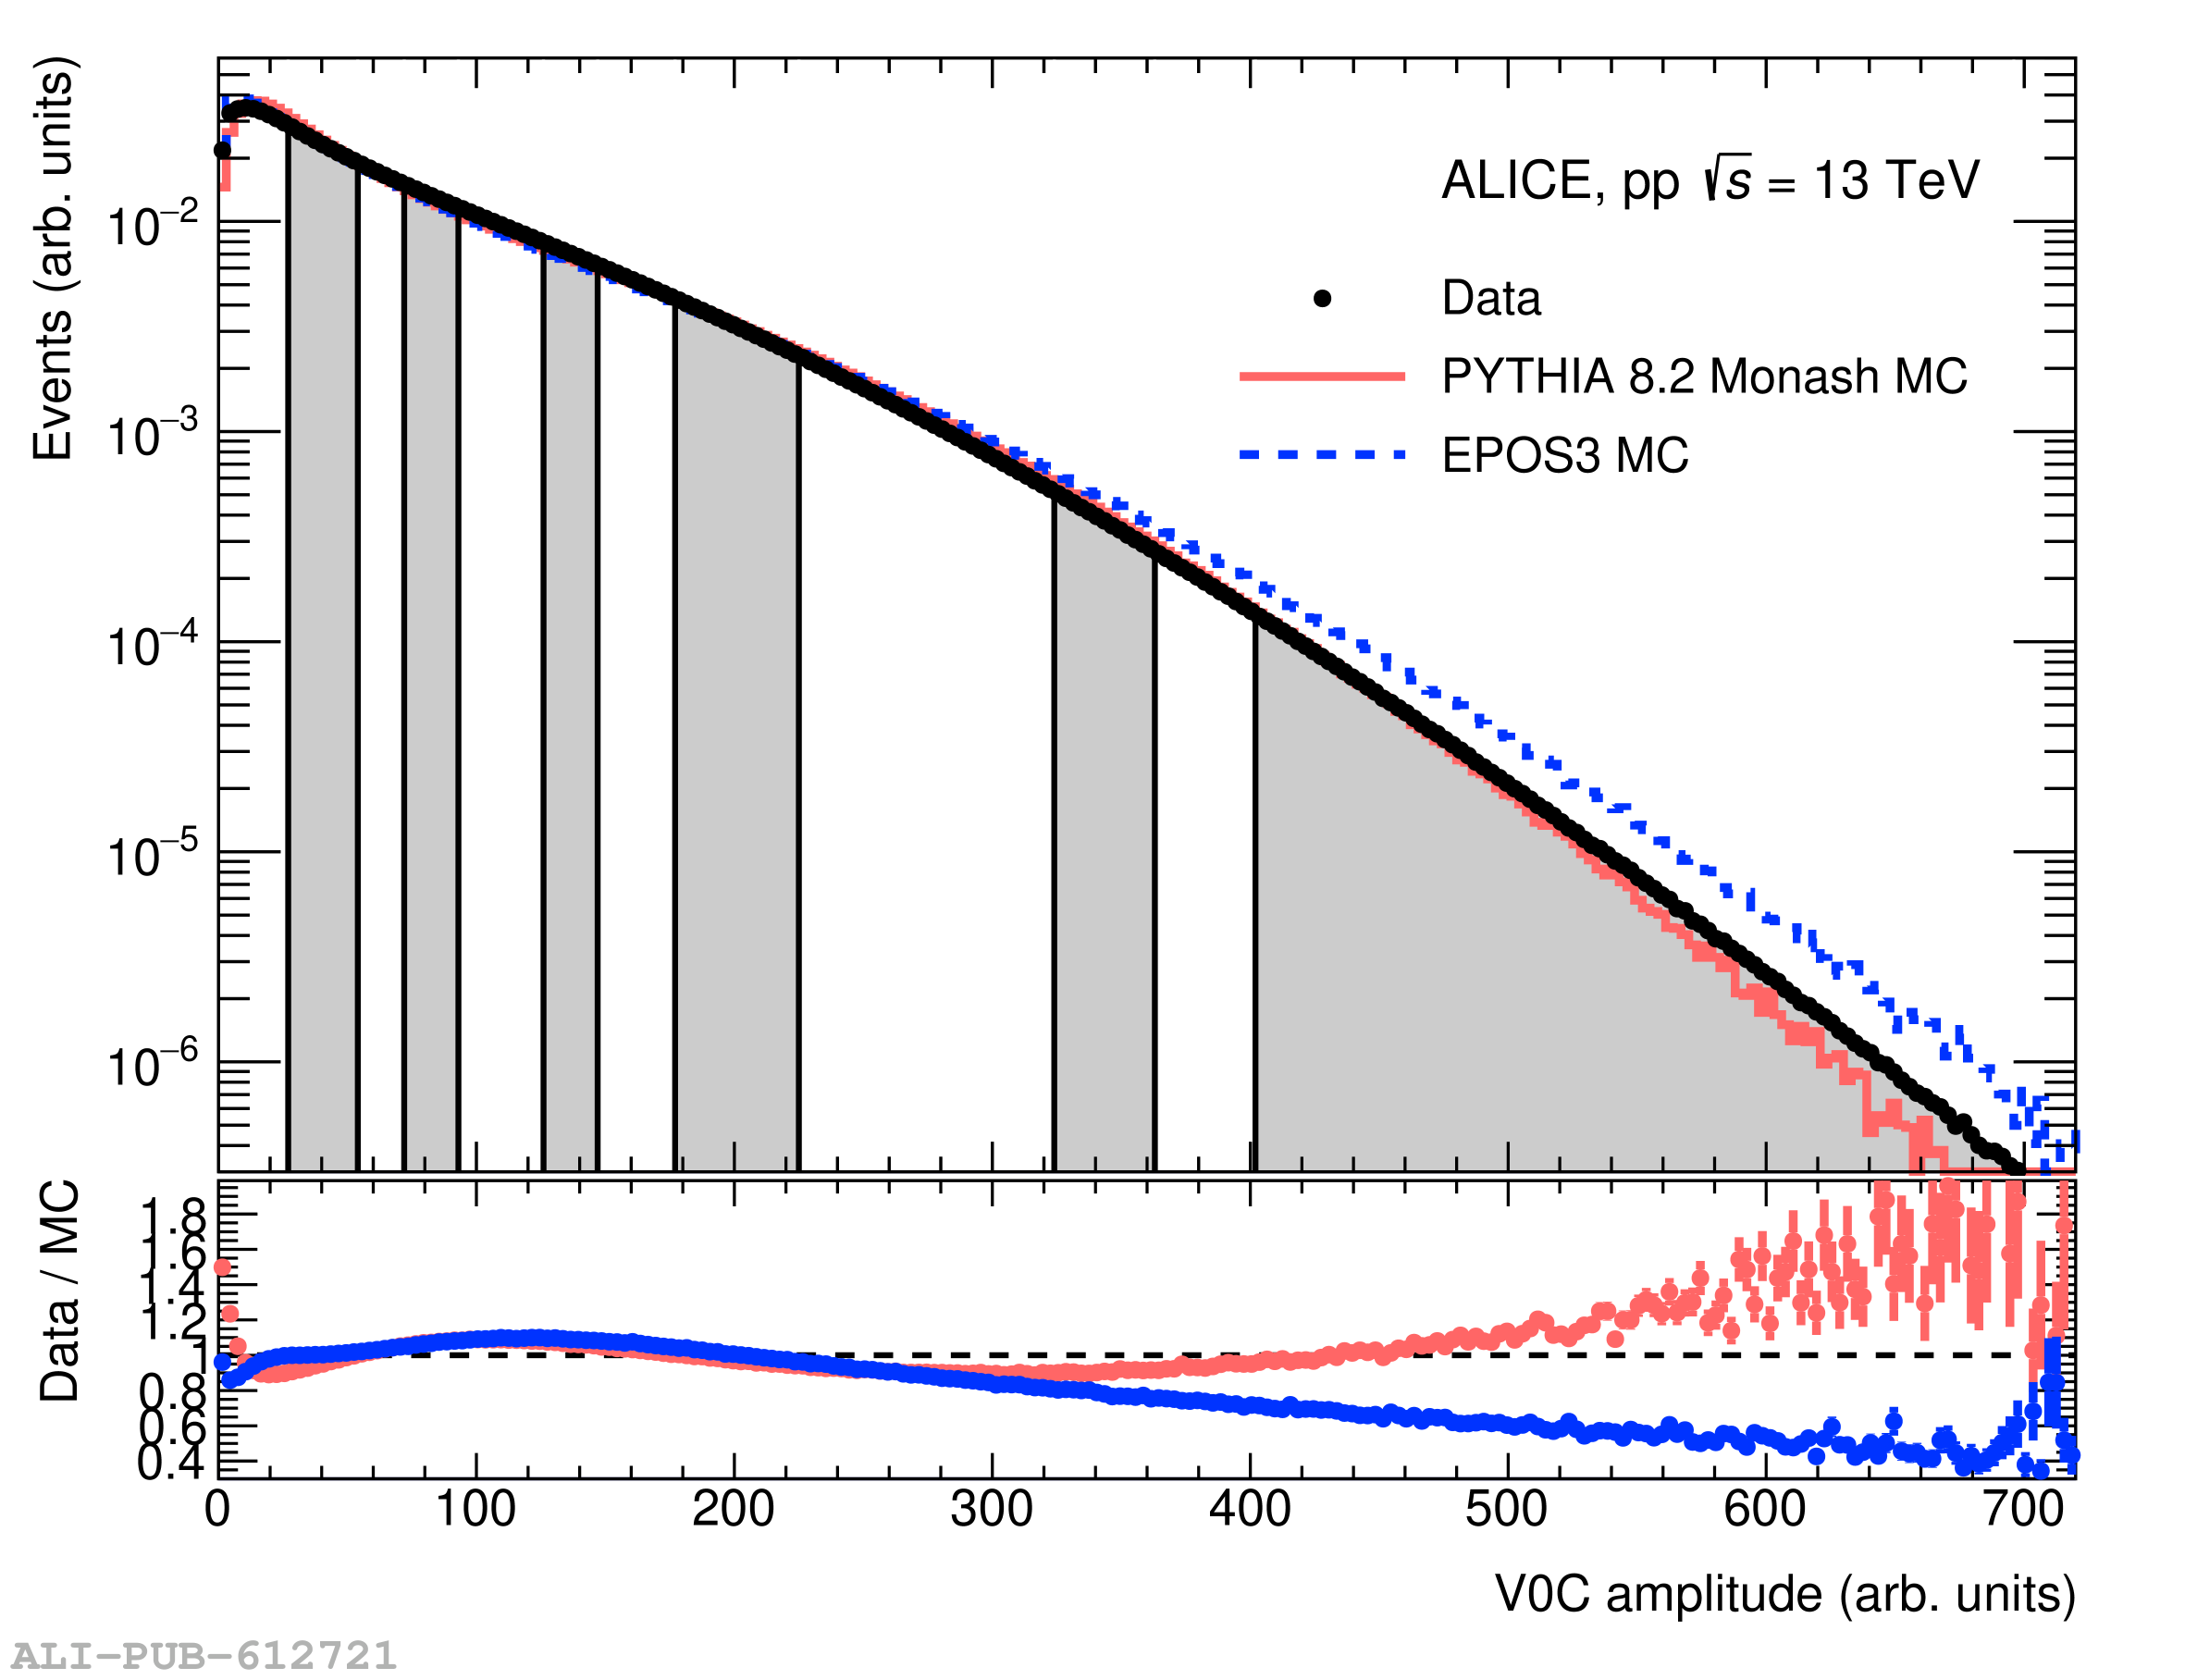
The V0C distributions in minimum-bias events in data and PYTHIA 8.2 Monash MC . The chosen multiplicity classes are indicated by alternating gray and white areas. The percentile ranges corresponding to the multiplicity classes (from low to high multiplicities) are 70-100%, 50-70%, 40-50%, 30-40%, 20-30%, 15-20%, 10-15%, 5-10%, 1-5%, 0.5-1%, 0.25-0.5%, 0-0.25%. The bottom panel shows the ratio between data and MC.

Figure 2

Forward and midrapidity J/$\psi$ relative yields versus the relative charged-particle multiplicity. The data of midrapidity J/$\psi$ and forward rapidity J/$\psi$ versus midrapidity multiplicity are taken from Refs. [11] and [12], respectively. The error bars and boxes represent the statistical and systematic uncertainties, respectively. The dotted line represents the diagonal.

Figure 3

J/$\psi$ relative yield as a function of the relative multiplicity in the V0C acceptance $-3.7\lt\eta\lt-1.7$ compared with PYTHIA 8.3 , EPOS4HQ  and two 3-Pomeron CGC model predictions . The dotted line represents the diagonal.