We present the measurement of the $p_{\rm T}$-differential production cross section of $ω$ mesons in pp and p$-$Pb collisions at $\sqrt{s_{\rm NN}} = 5.02$ TeV at midrapidity by ALICE. In addition, the first measurement of the nuclear modification factor $R_{\text{pPb}}$ for $ω$ mesons at LHC energies is presented, complementing the existing measurements of lighter neutral mesons such as the $π^0$ and $η$. Within the measured $p_{\rm T}$-range, the $R_{\text{pPb}}$ of $ω$ mesons is compatible with no cold nuclear matter effects within the uncertainties, consistent with previous measurements at lower energies. The $ω/π^0$ ratio is presented for both collision systems, showing no collision system dependence within the uncertainties. The comparison to previously published $ω/π^0$ ratios at lower and higher collision energies in pp collisions suggests a decreasing trend of the ratio above $p_{\rm T}=~4 $ GeV/$c$ with increasing collision energy. The data in both collision systems are compared to predictions from PYTHIA, EPOS LHC and DPMJET event generators, revealing significant shortcomings in these models' ability to describe the production of $ω$ mesons.
Phys. Rev. C 112 (2025) 4, 044904
HEP Data
e-Print: arXiv:2502.19956 | PDF | inSPIRE
CERN-EP-2025-033
Figure group
Figure 1
Invariant mass distributions of \pipipi triplets in the indicated \pt ranges for \piz's reconstructed with PCM (top), PCM-EMCal (middle), and EMCal (bottom) in \pp (left) and \pPb (right) collisions. Subtraction of the third-order polynomial background description (blue) from the \pipipi candidates (black) results in the signal of $\omega$ candidates (red). In \pPb collisions, this signal is scaled by a factor of three for better visibility. The vertical dashed lines denote the invariant mass region where the raw yield was obtained through bin counting, as described in \refsec{Omega}. | 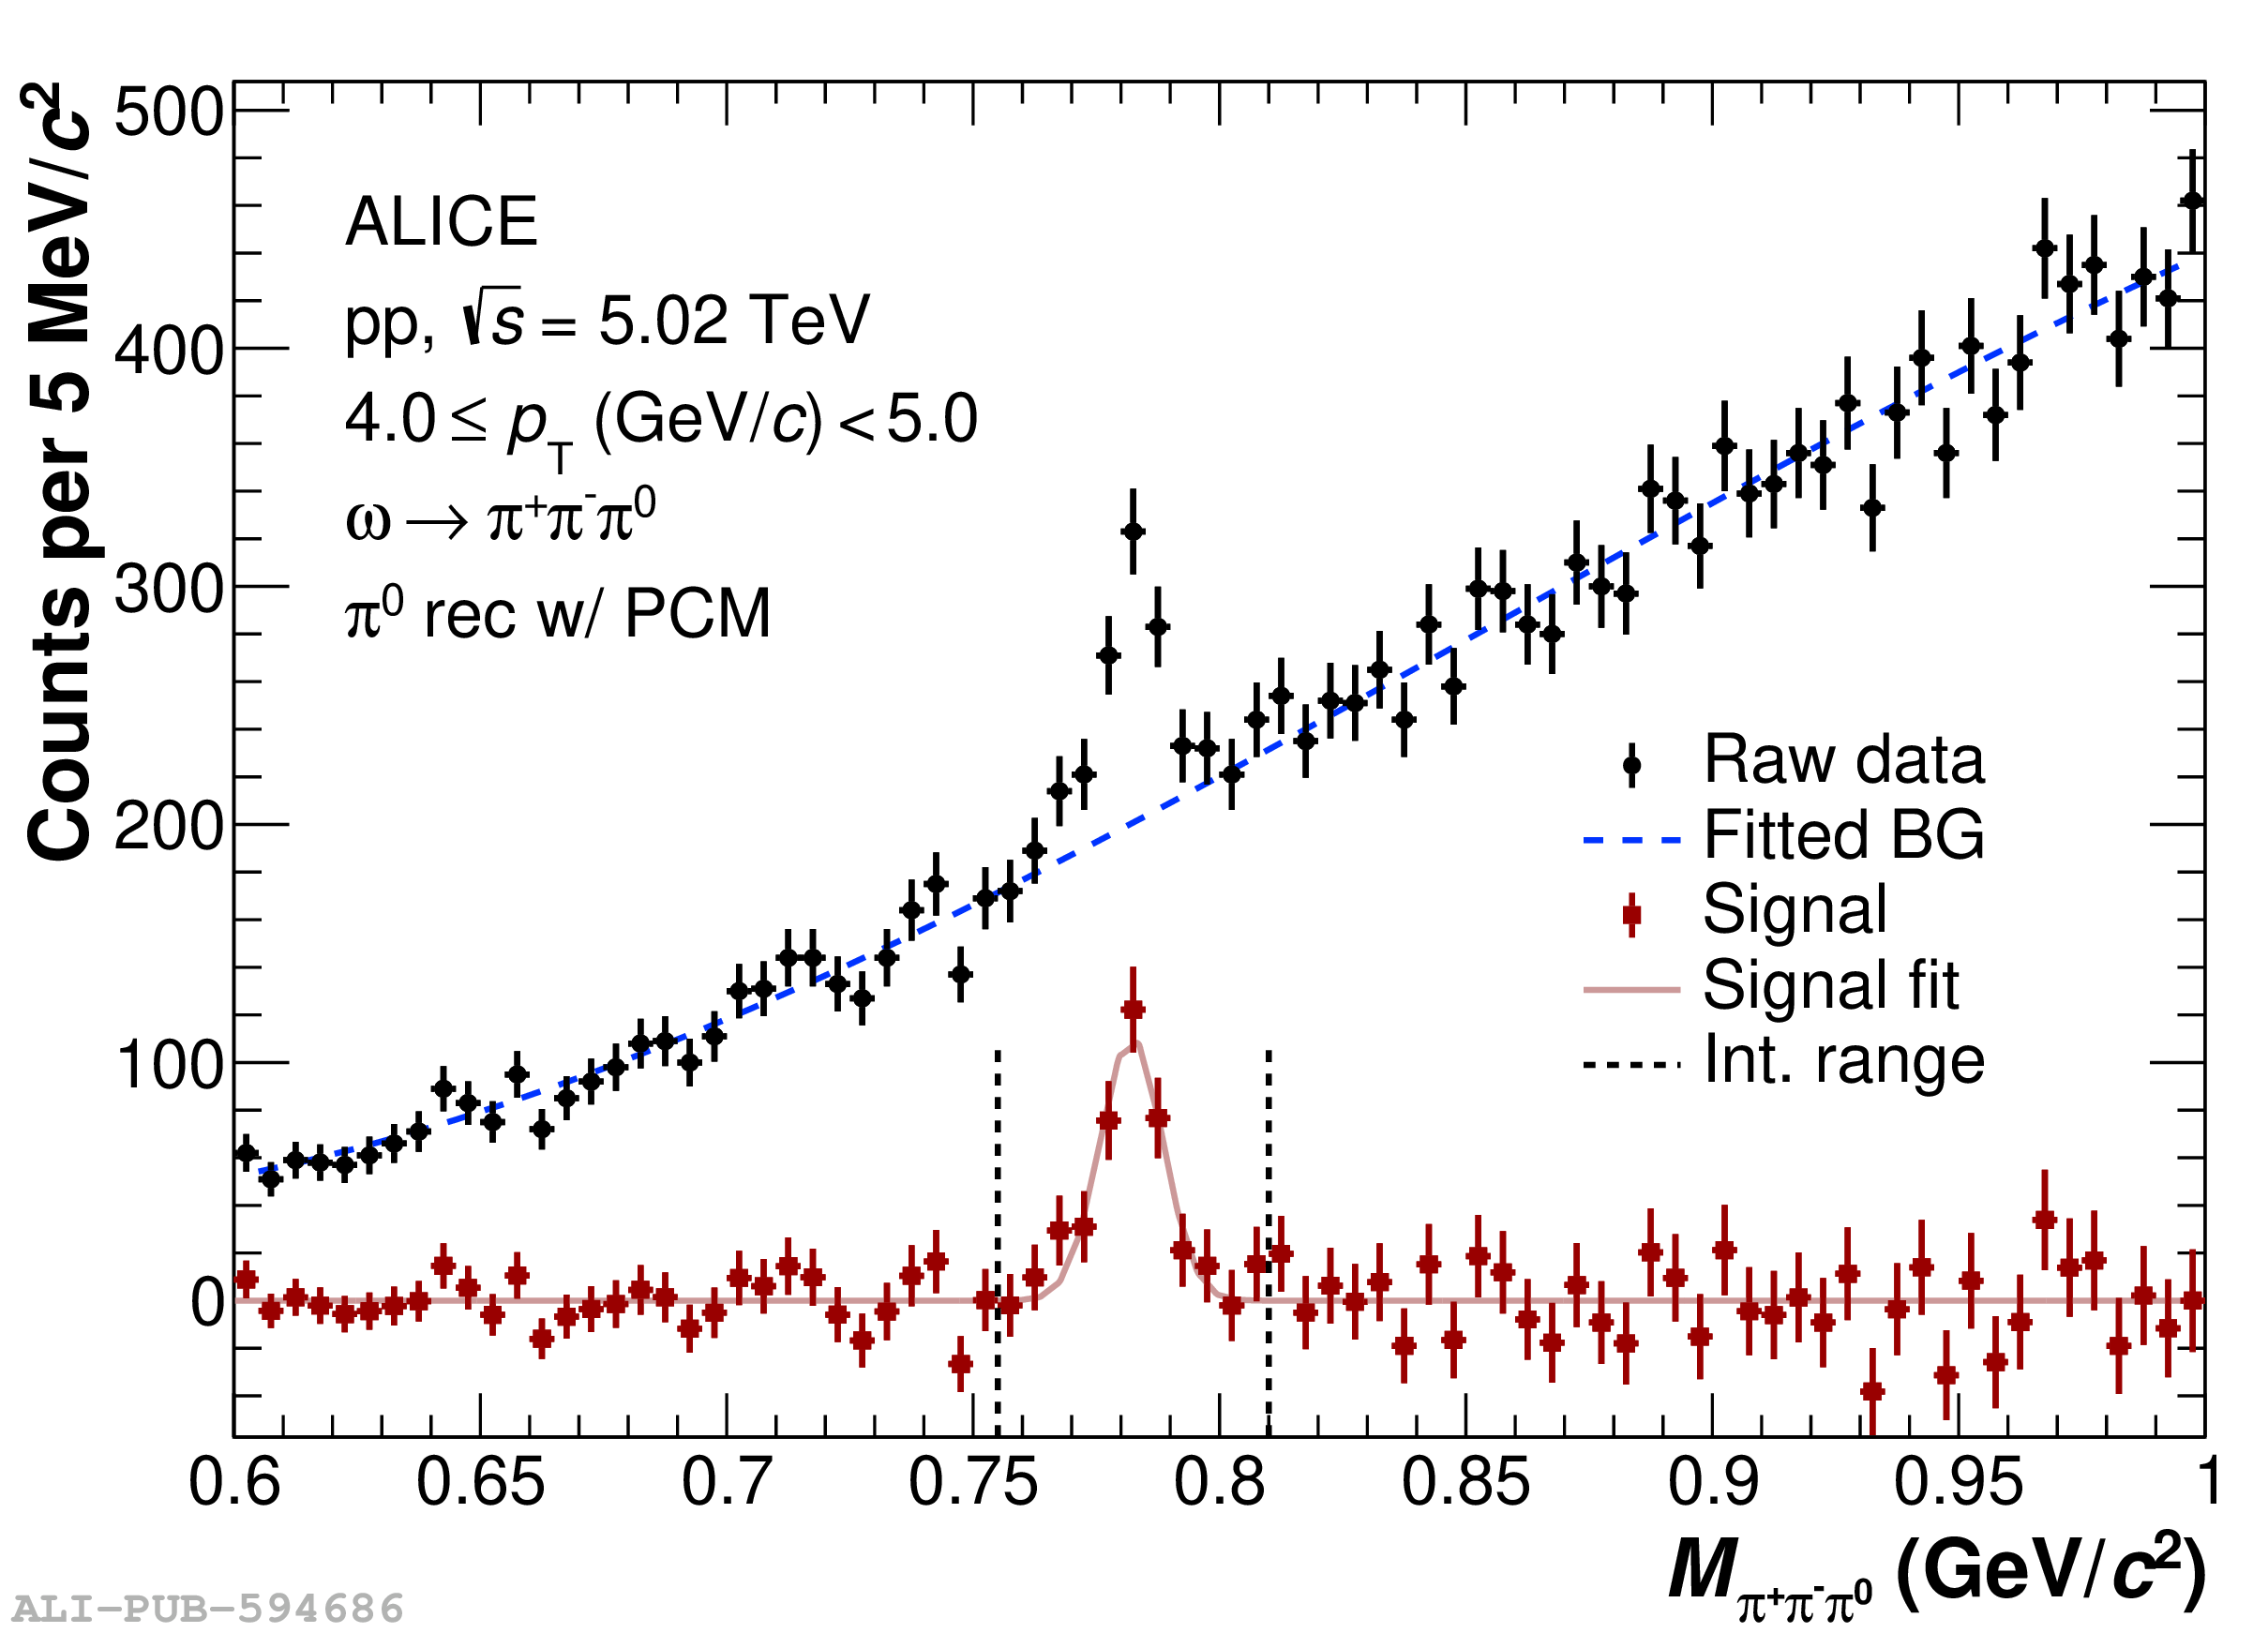 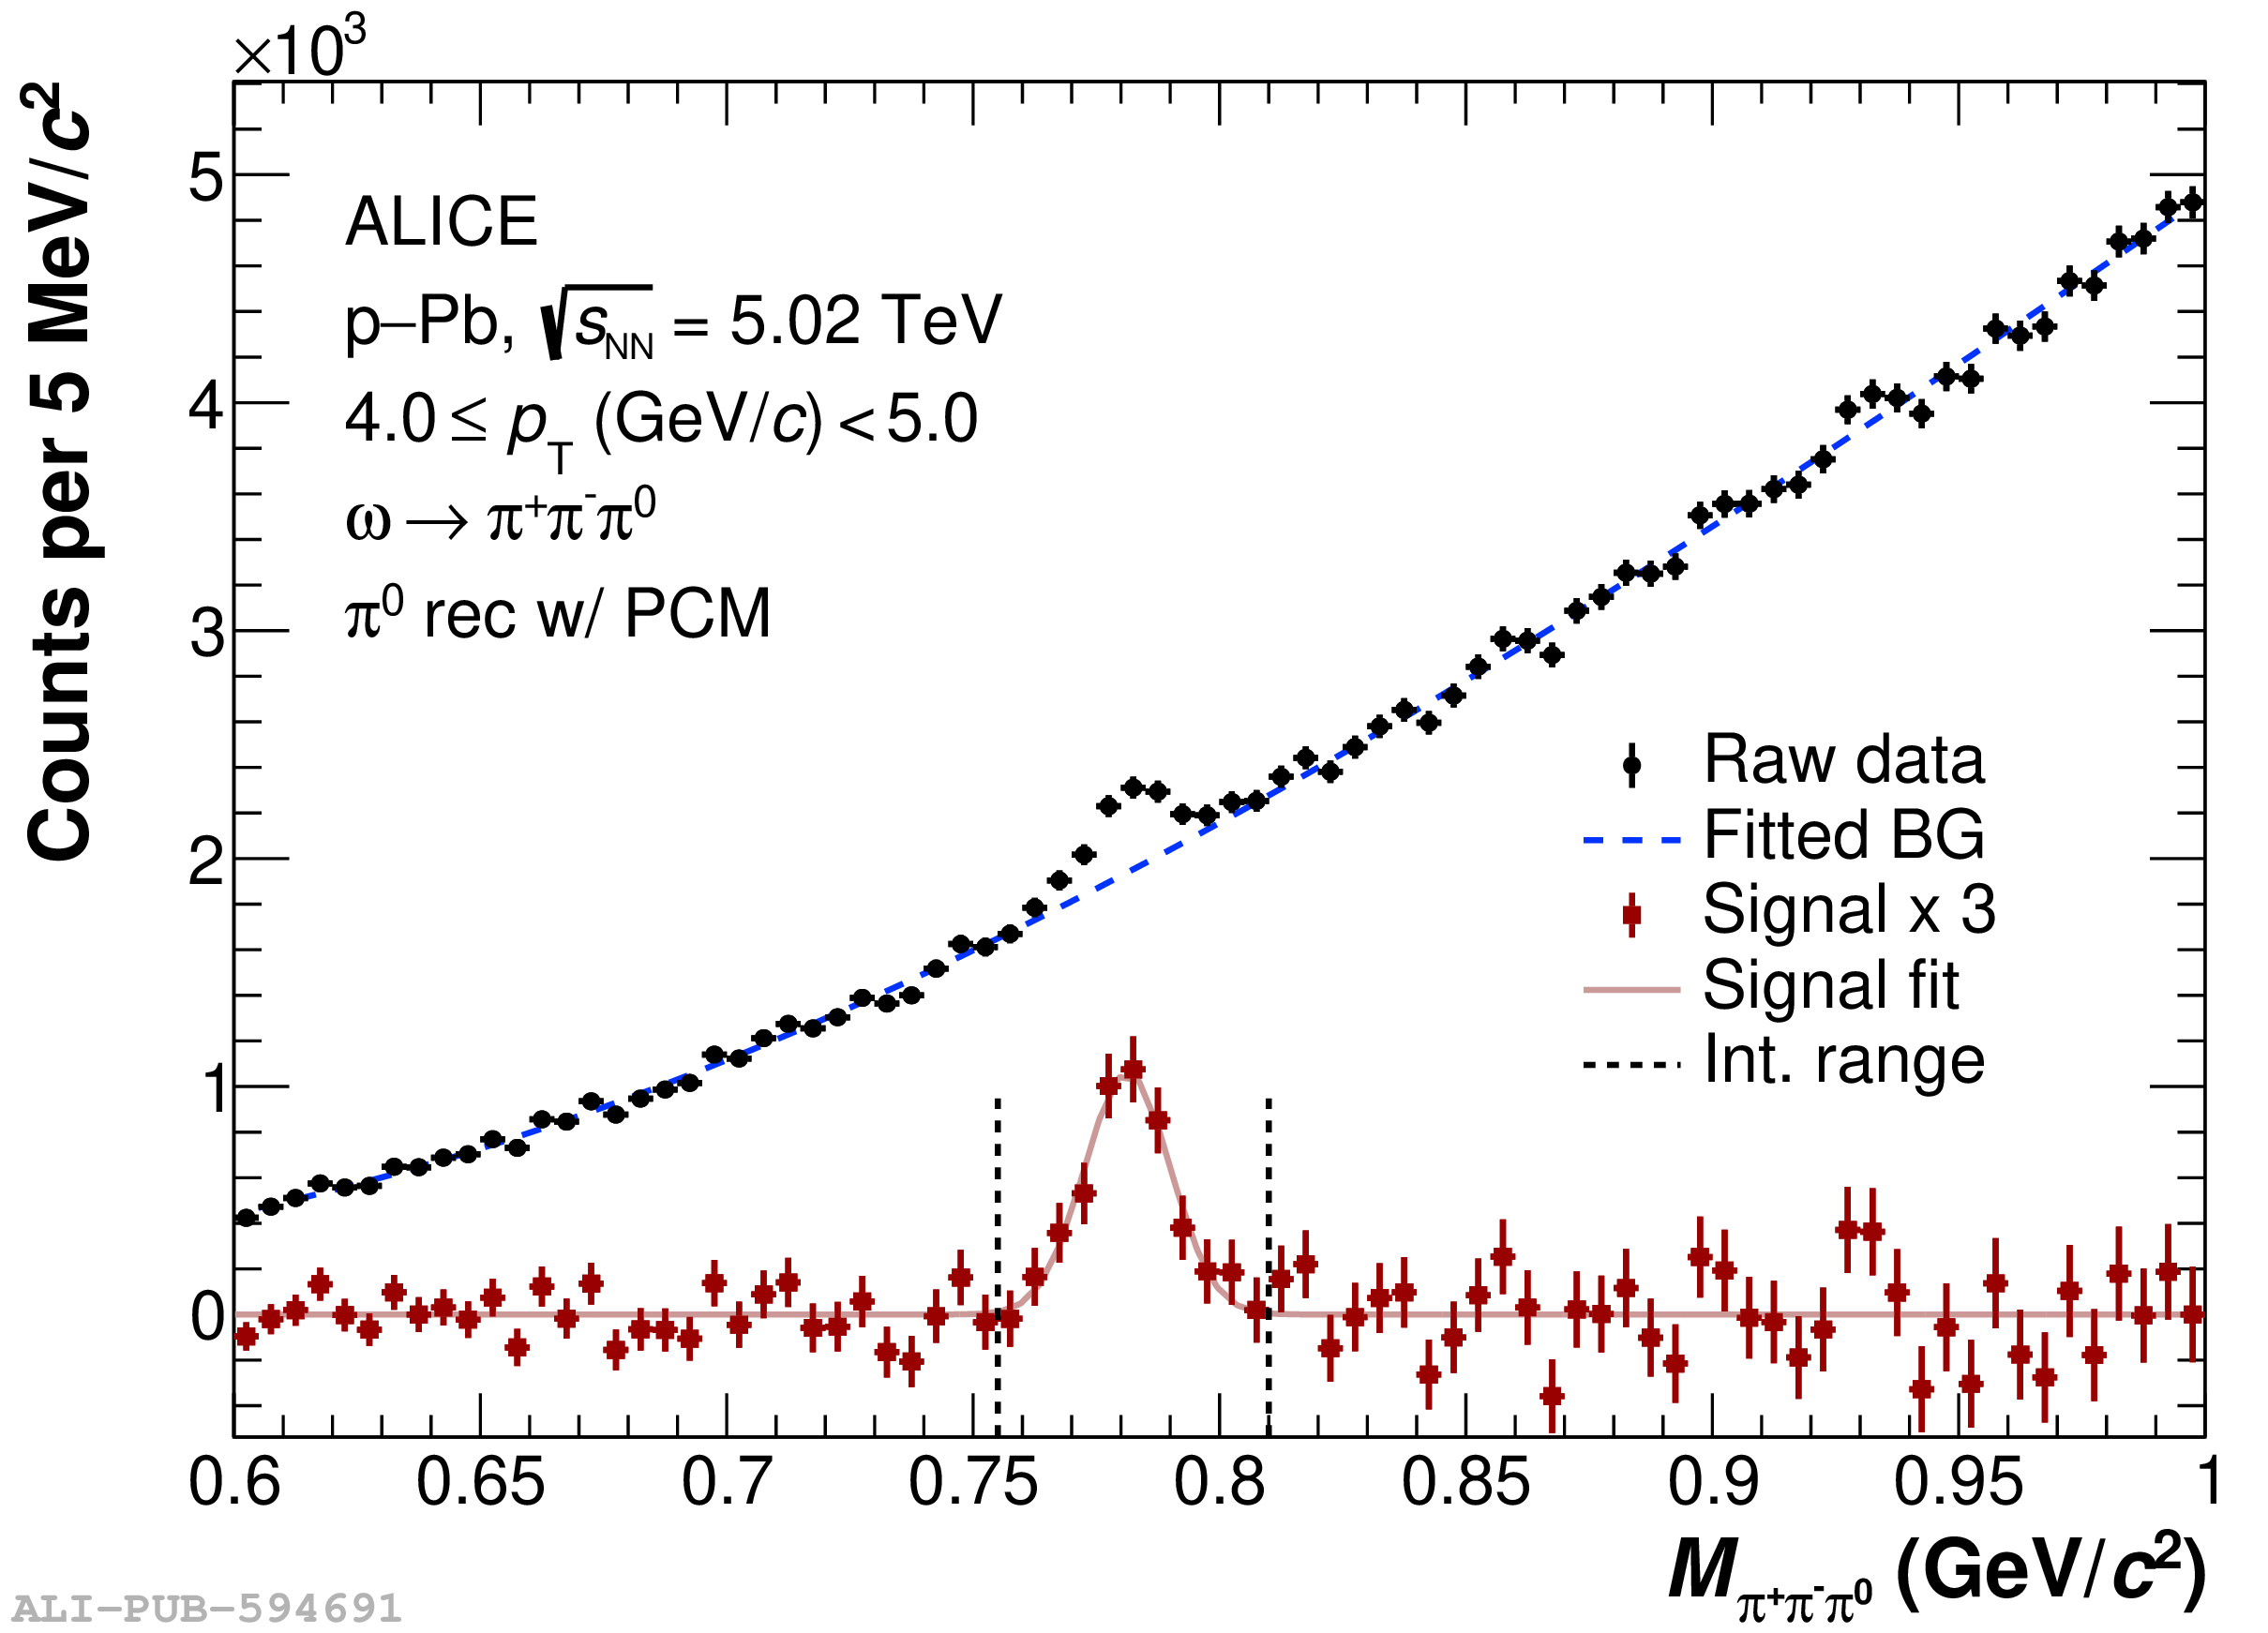 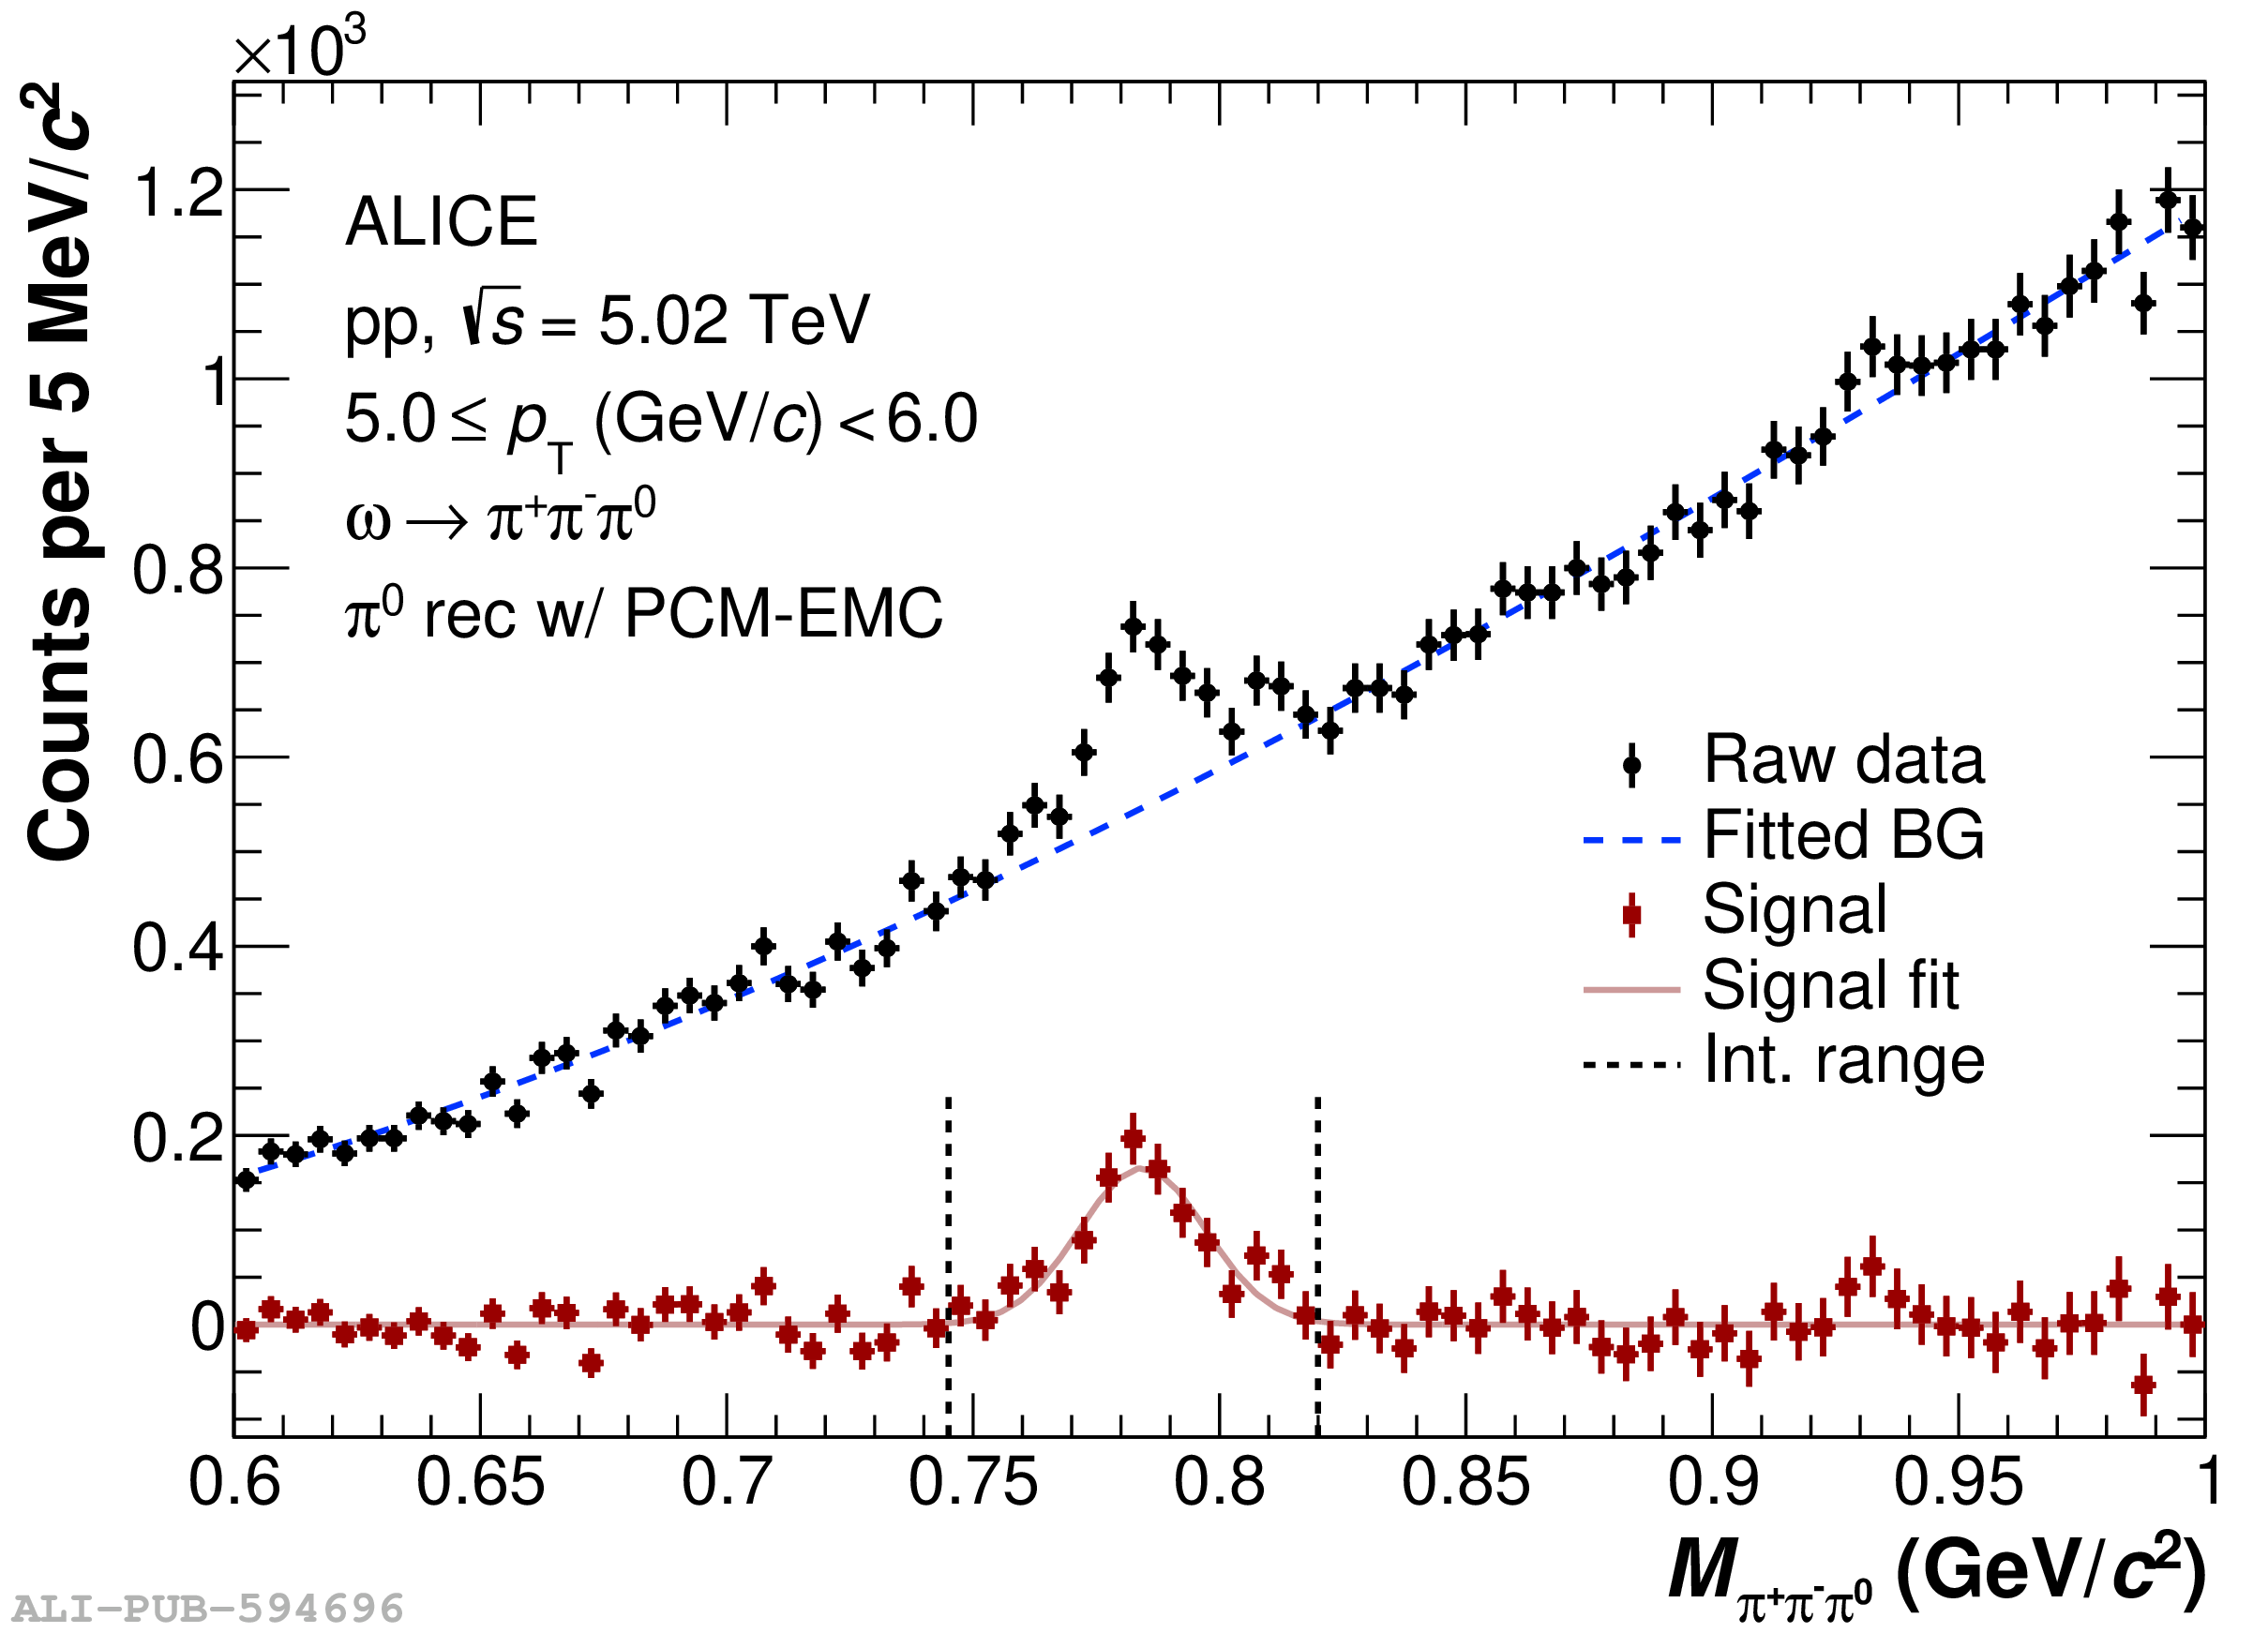 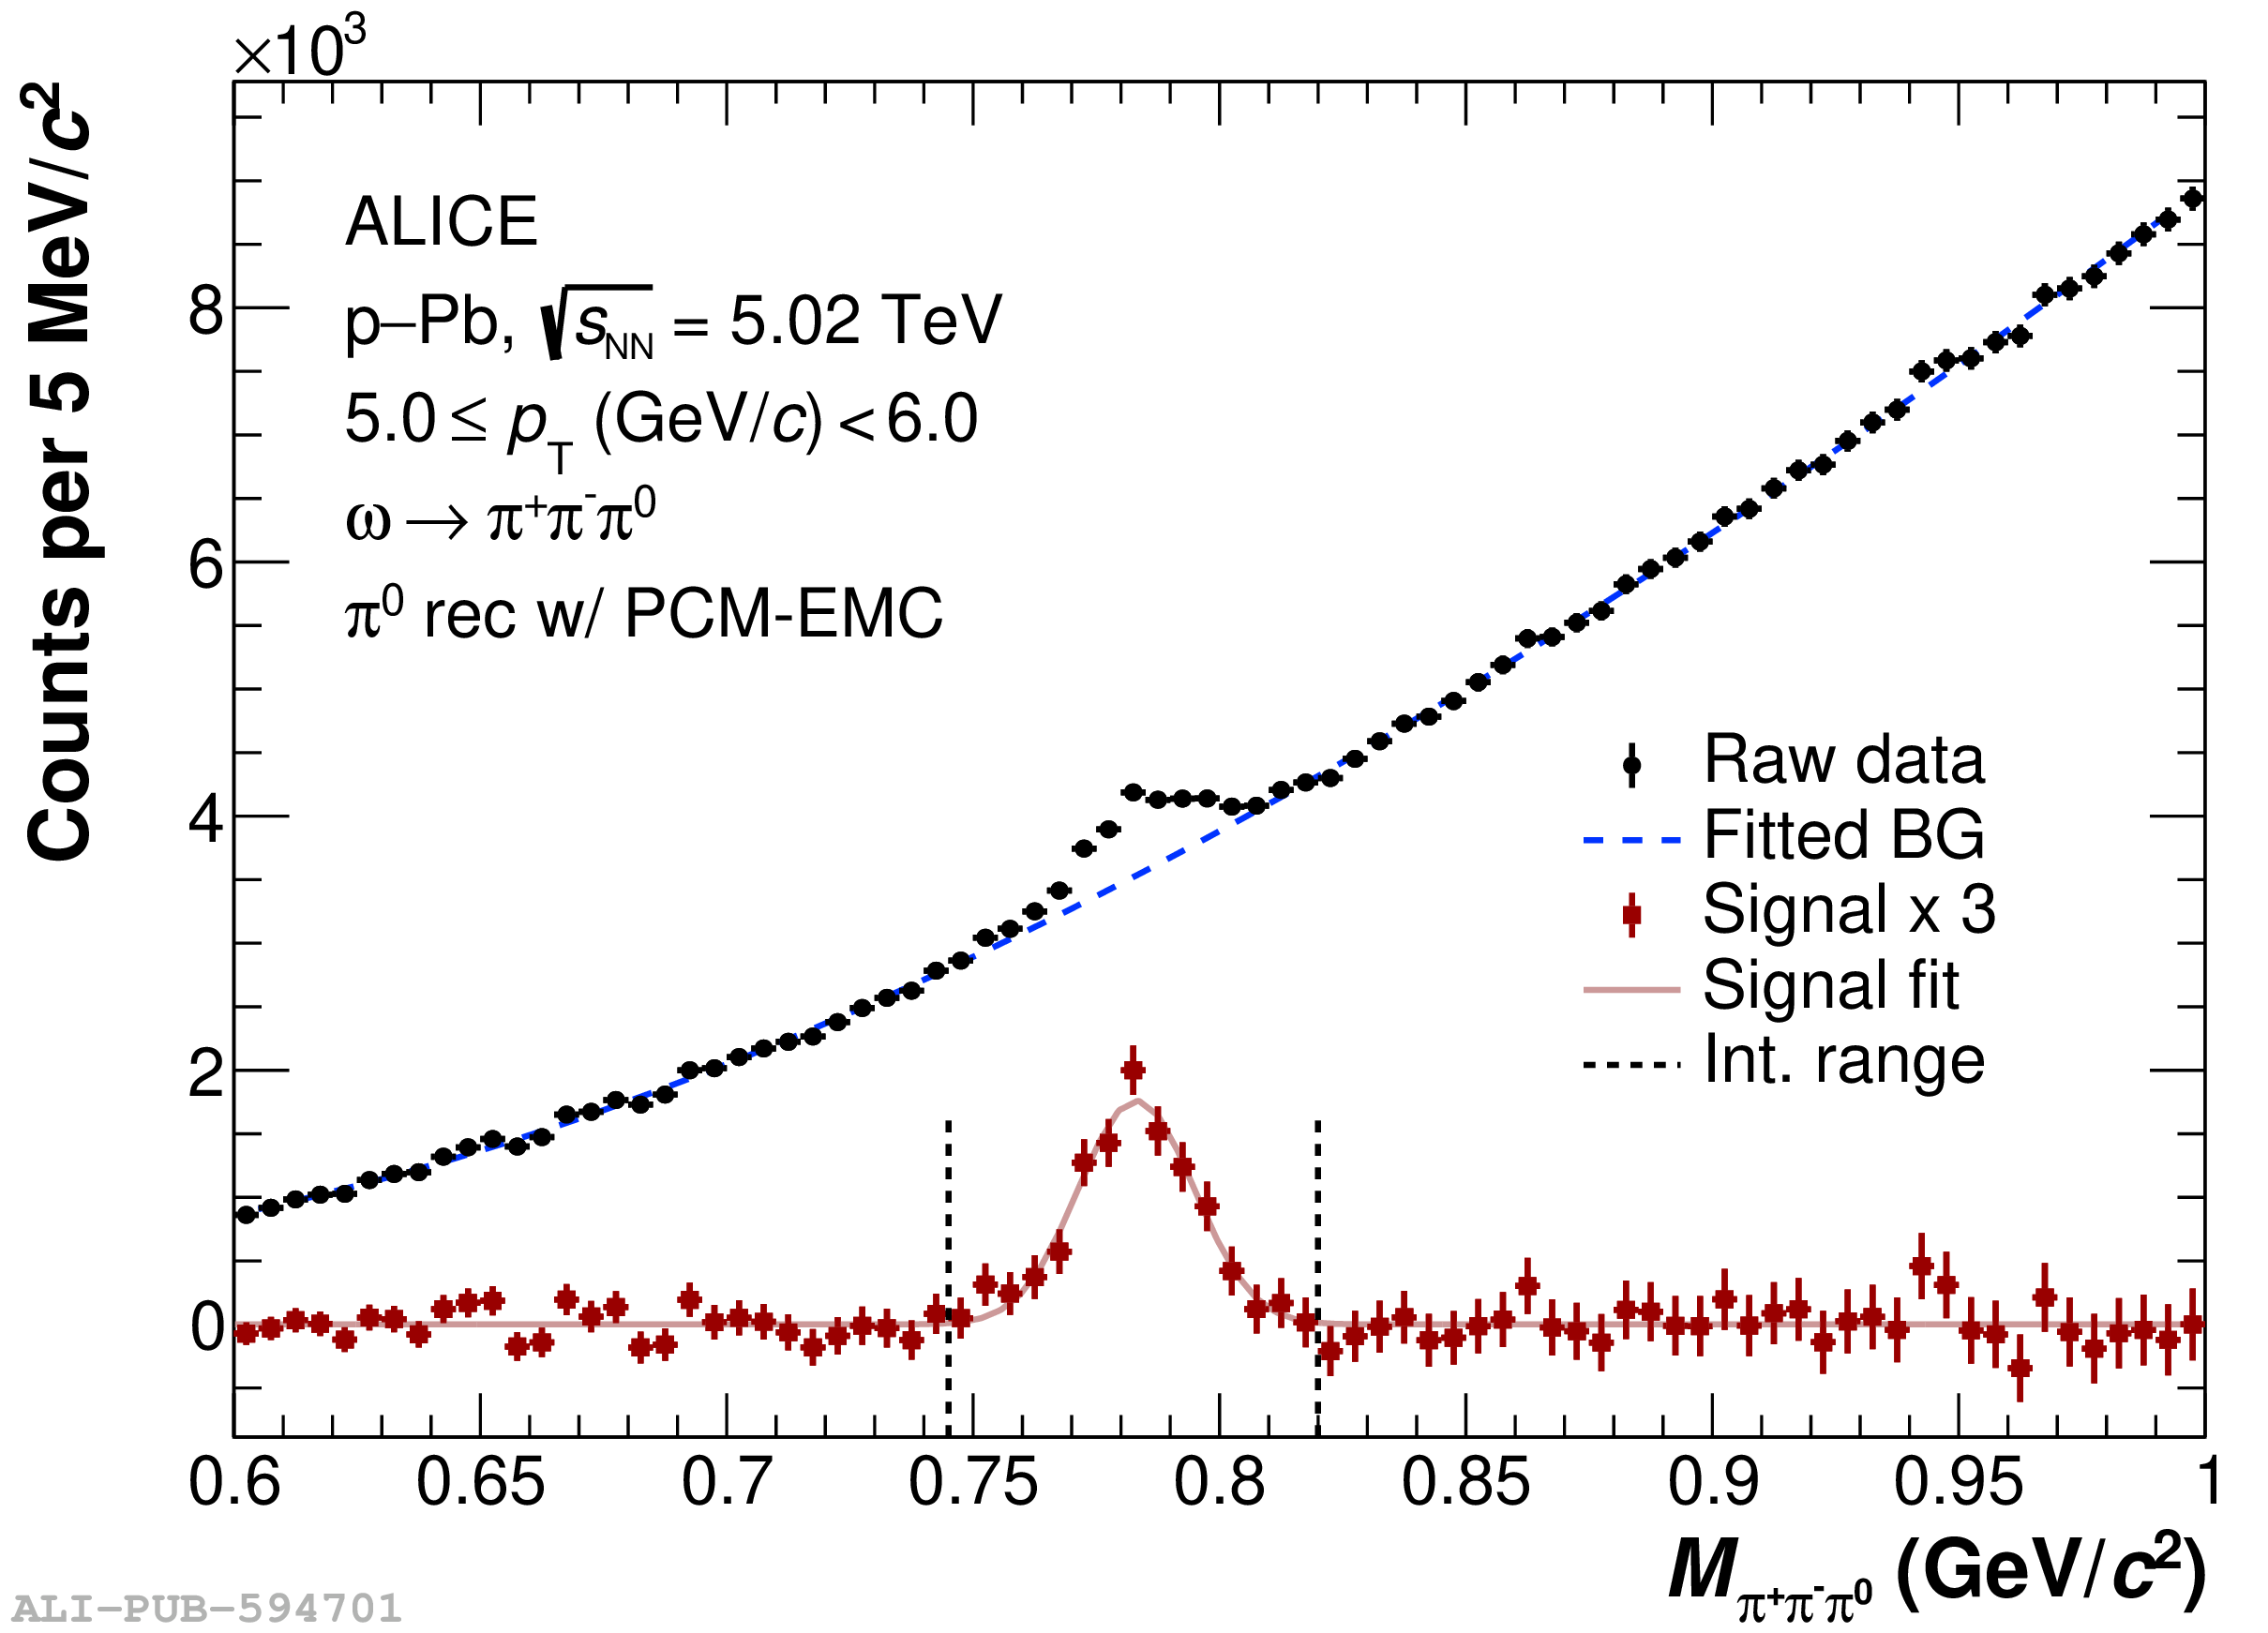 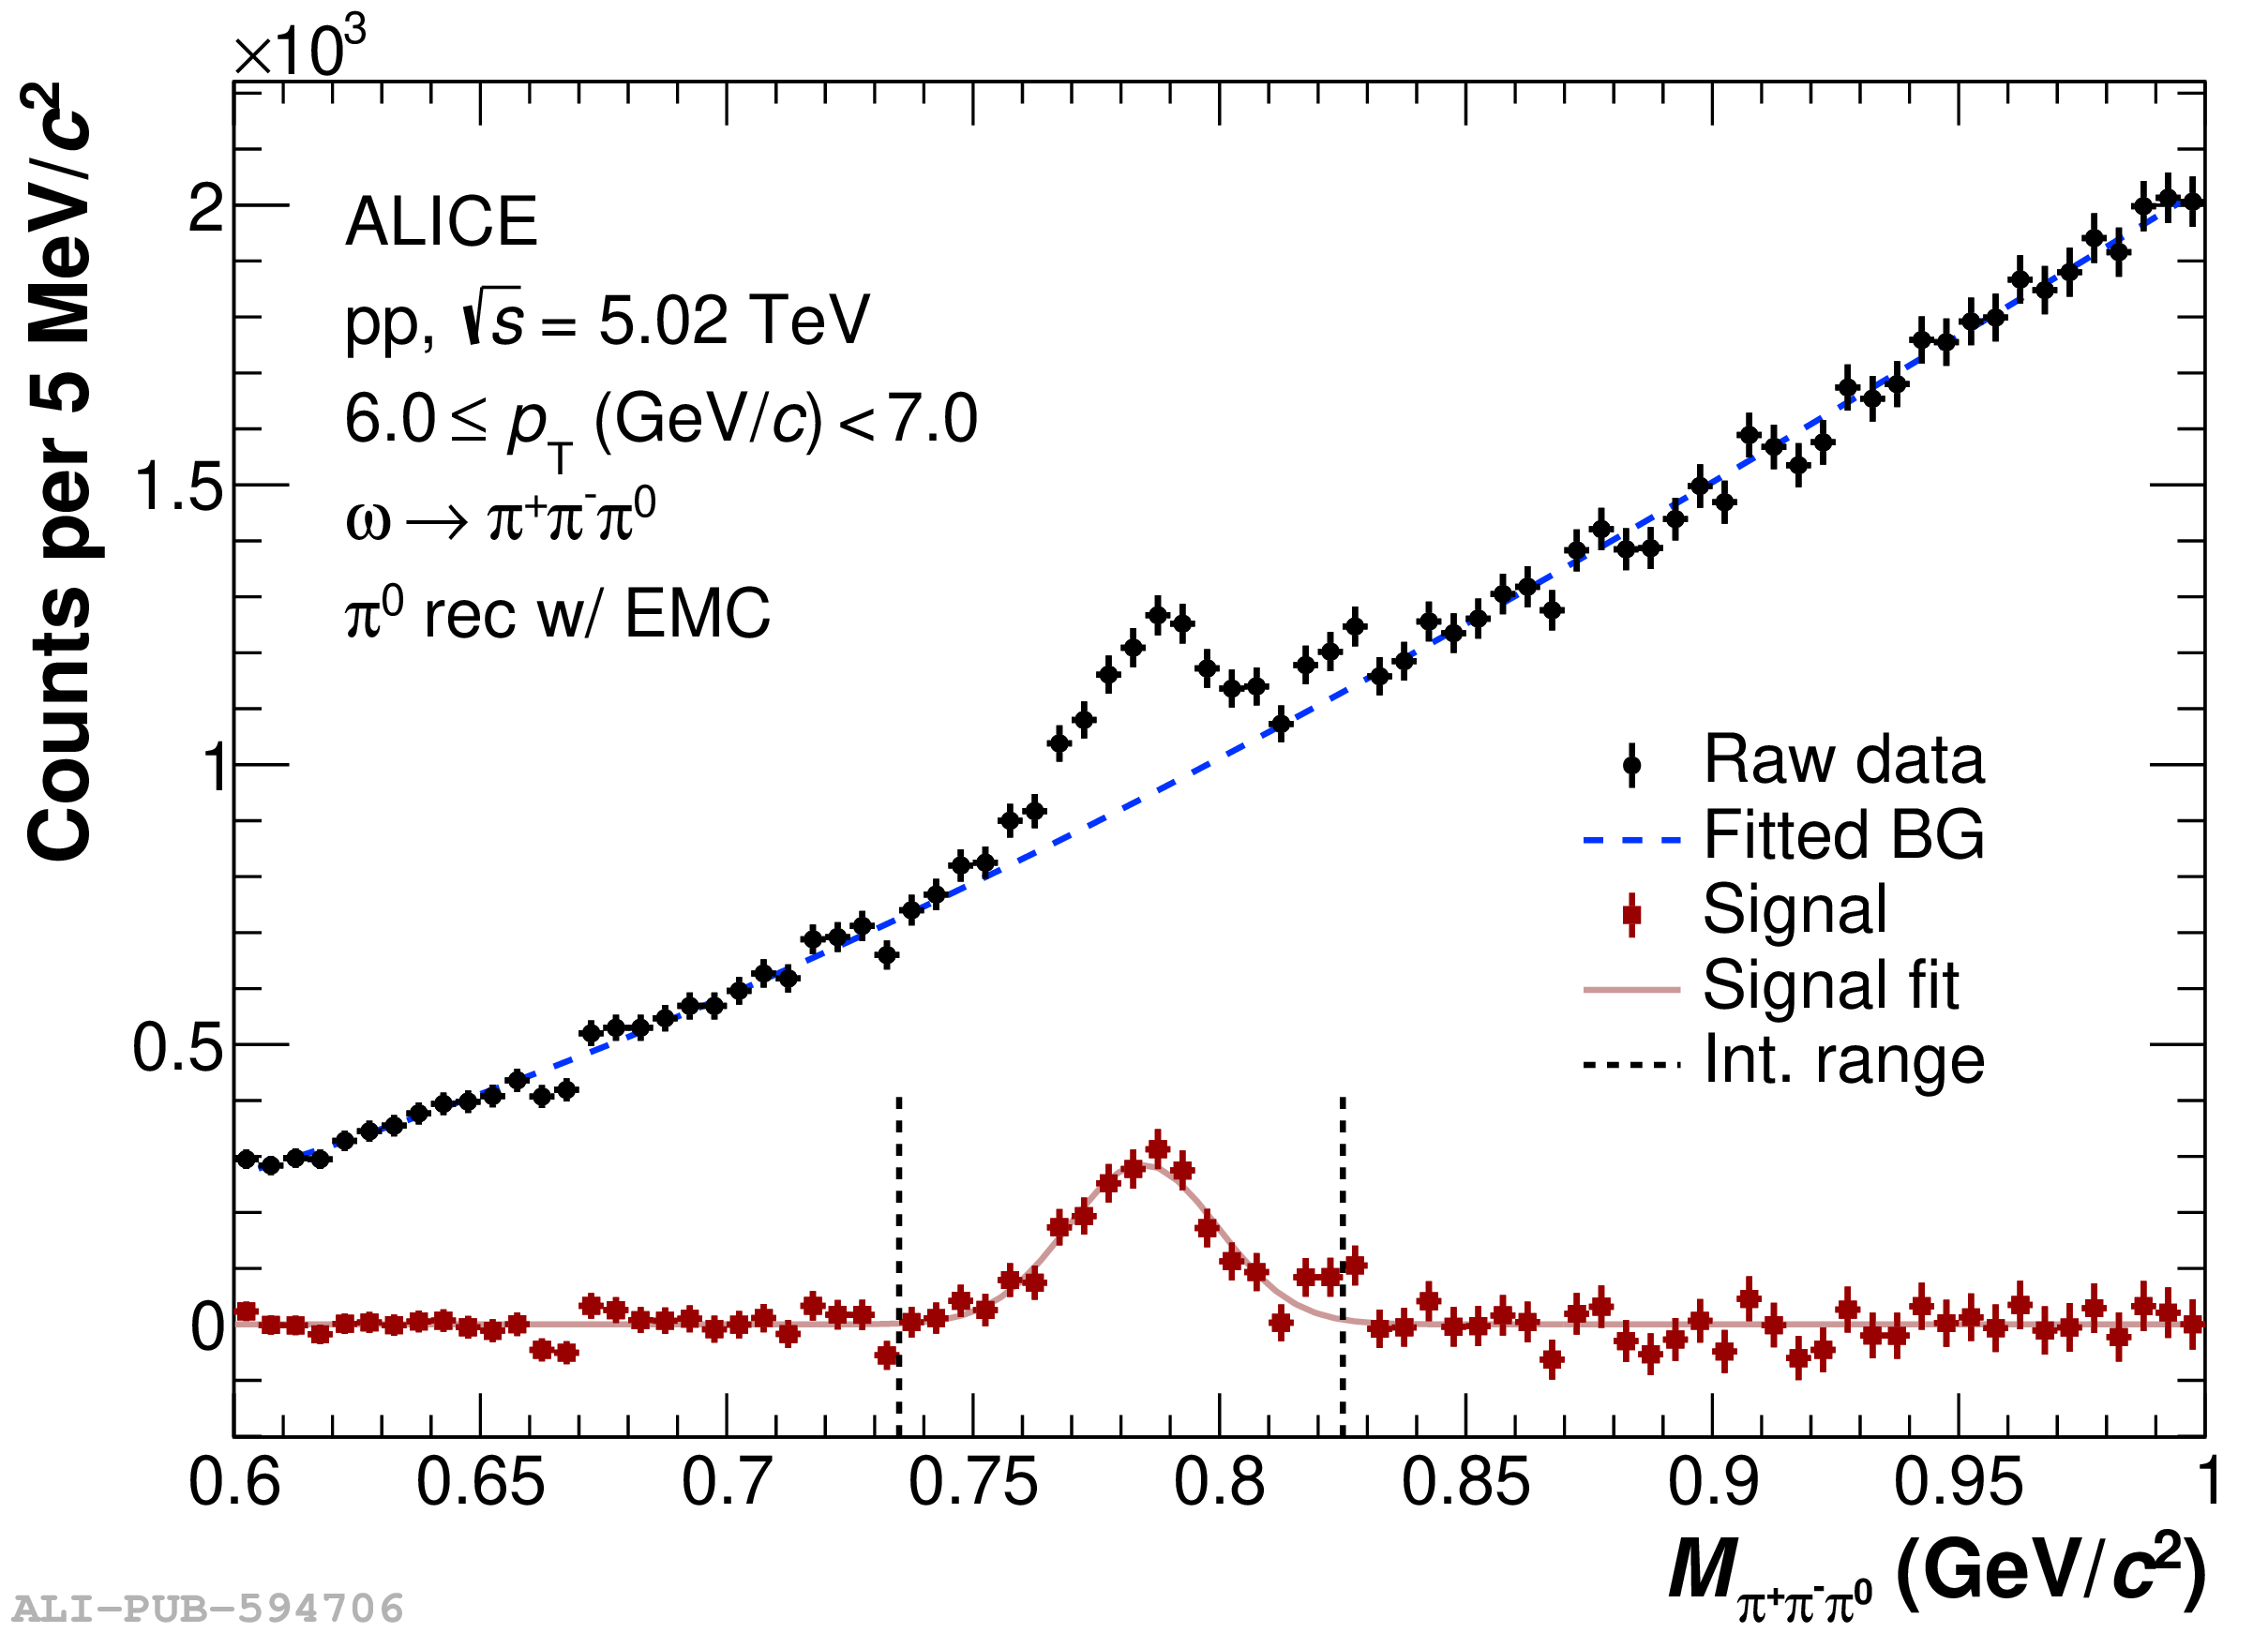 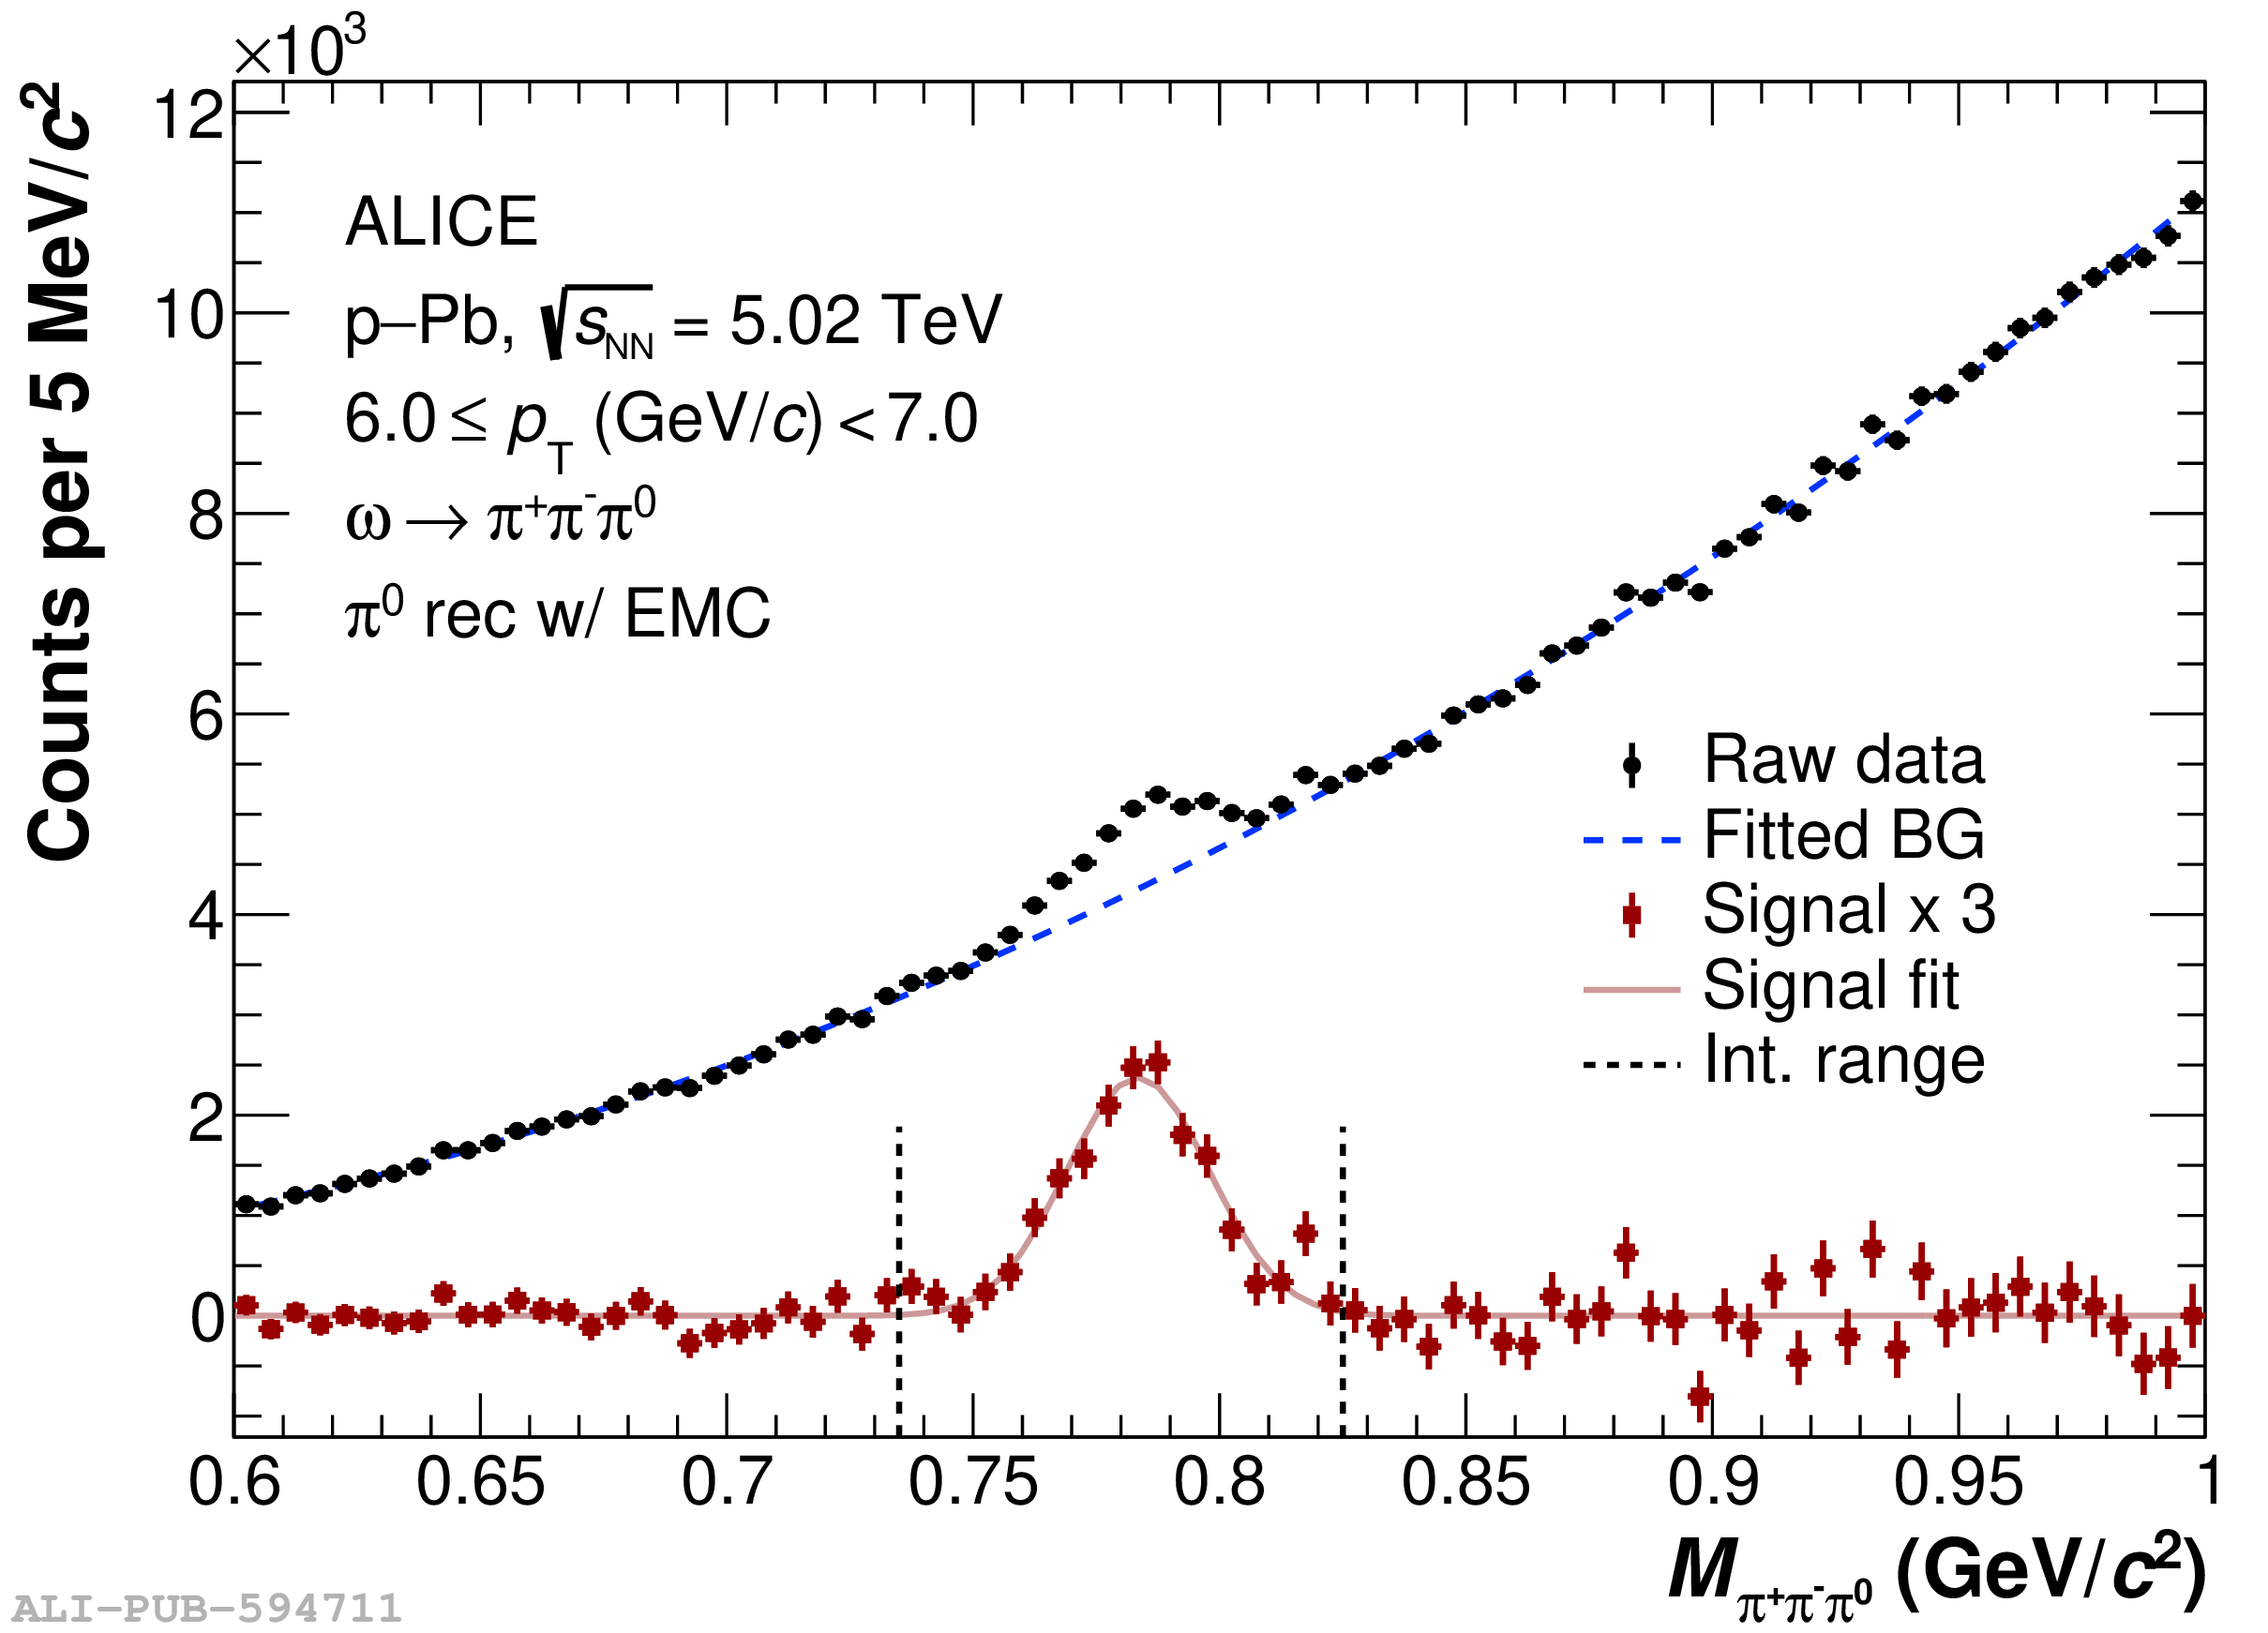 |
Figure 2
Correction factors $\epsilon$ applied to the raw $\omega$ yields for each \piz reconstruction method in \pp and \pPb collisions. The correction factor comprises the geometrical acceptance ($A$), the reconstruction efficiency ($\epsilon_\text{rec}$), and normalization to azimuthal and rapidity ranges. | 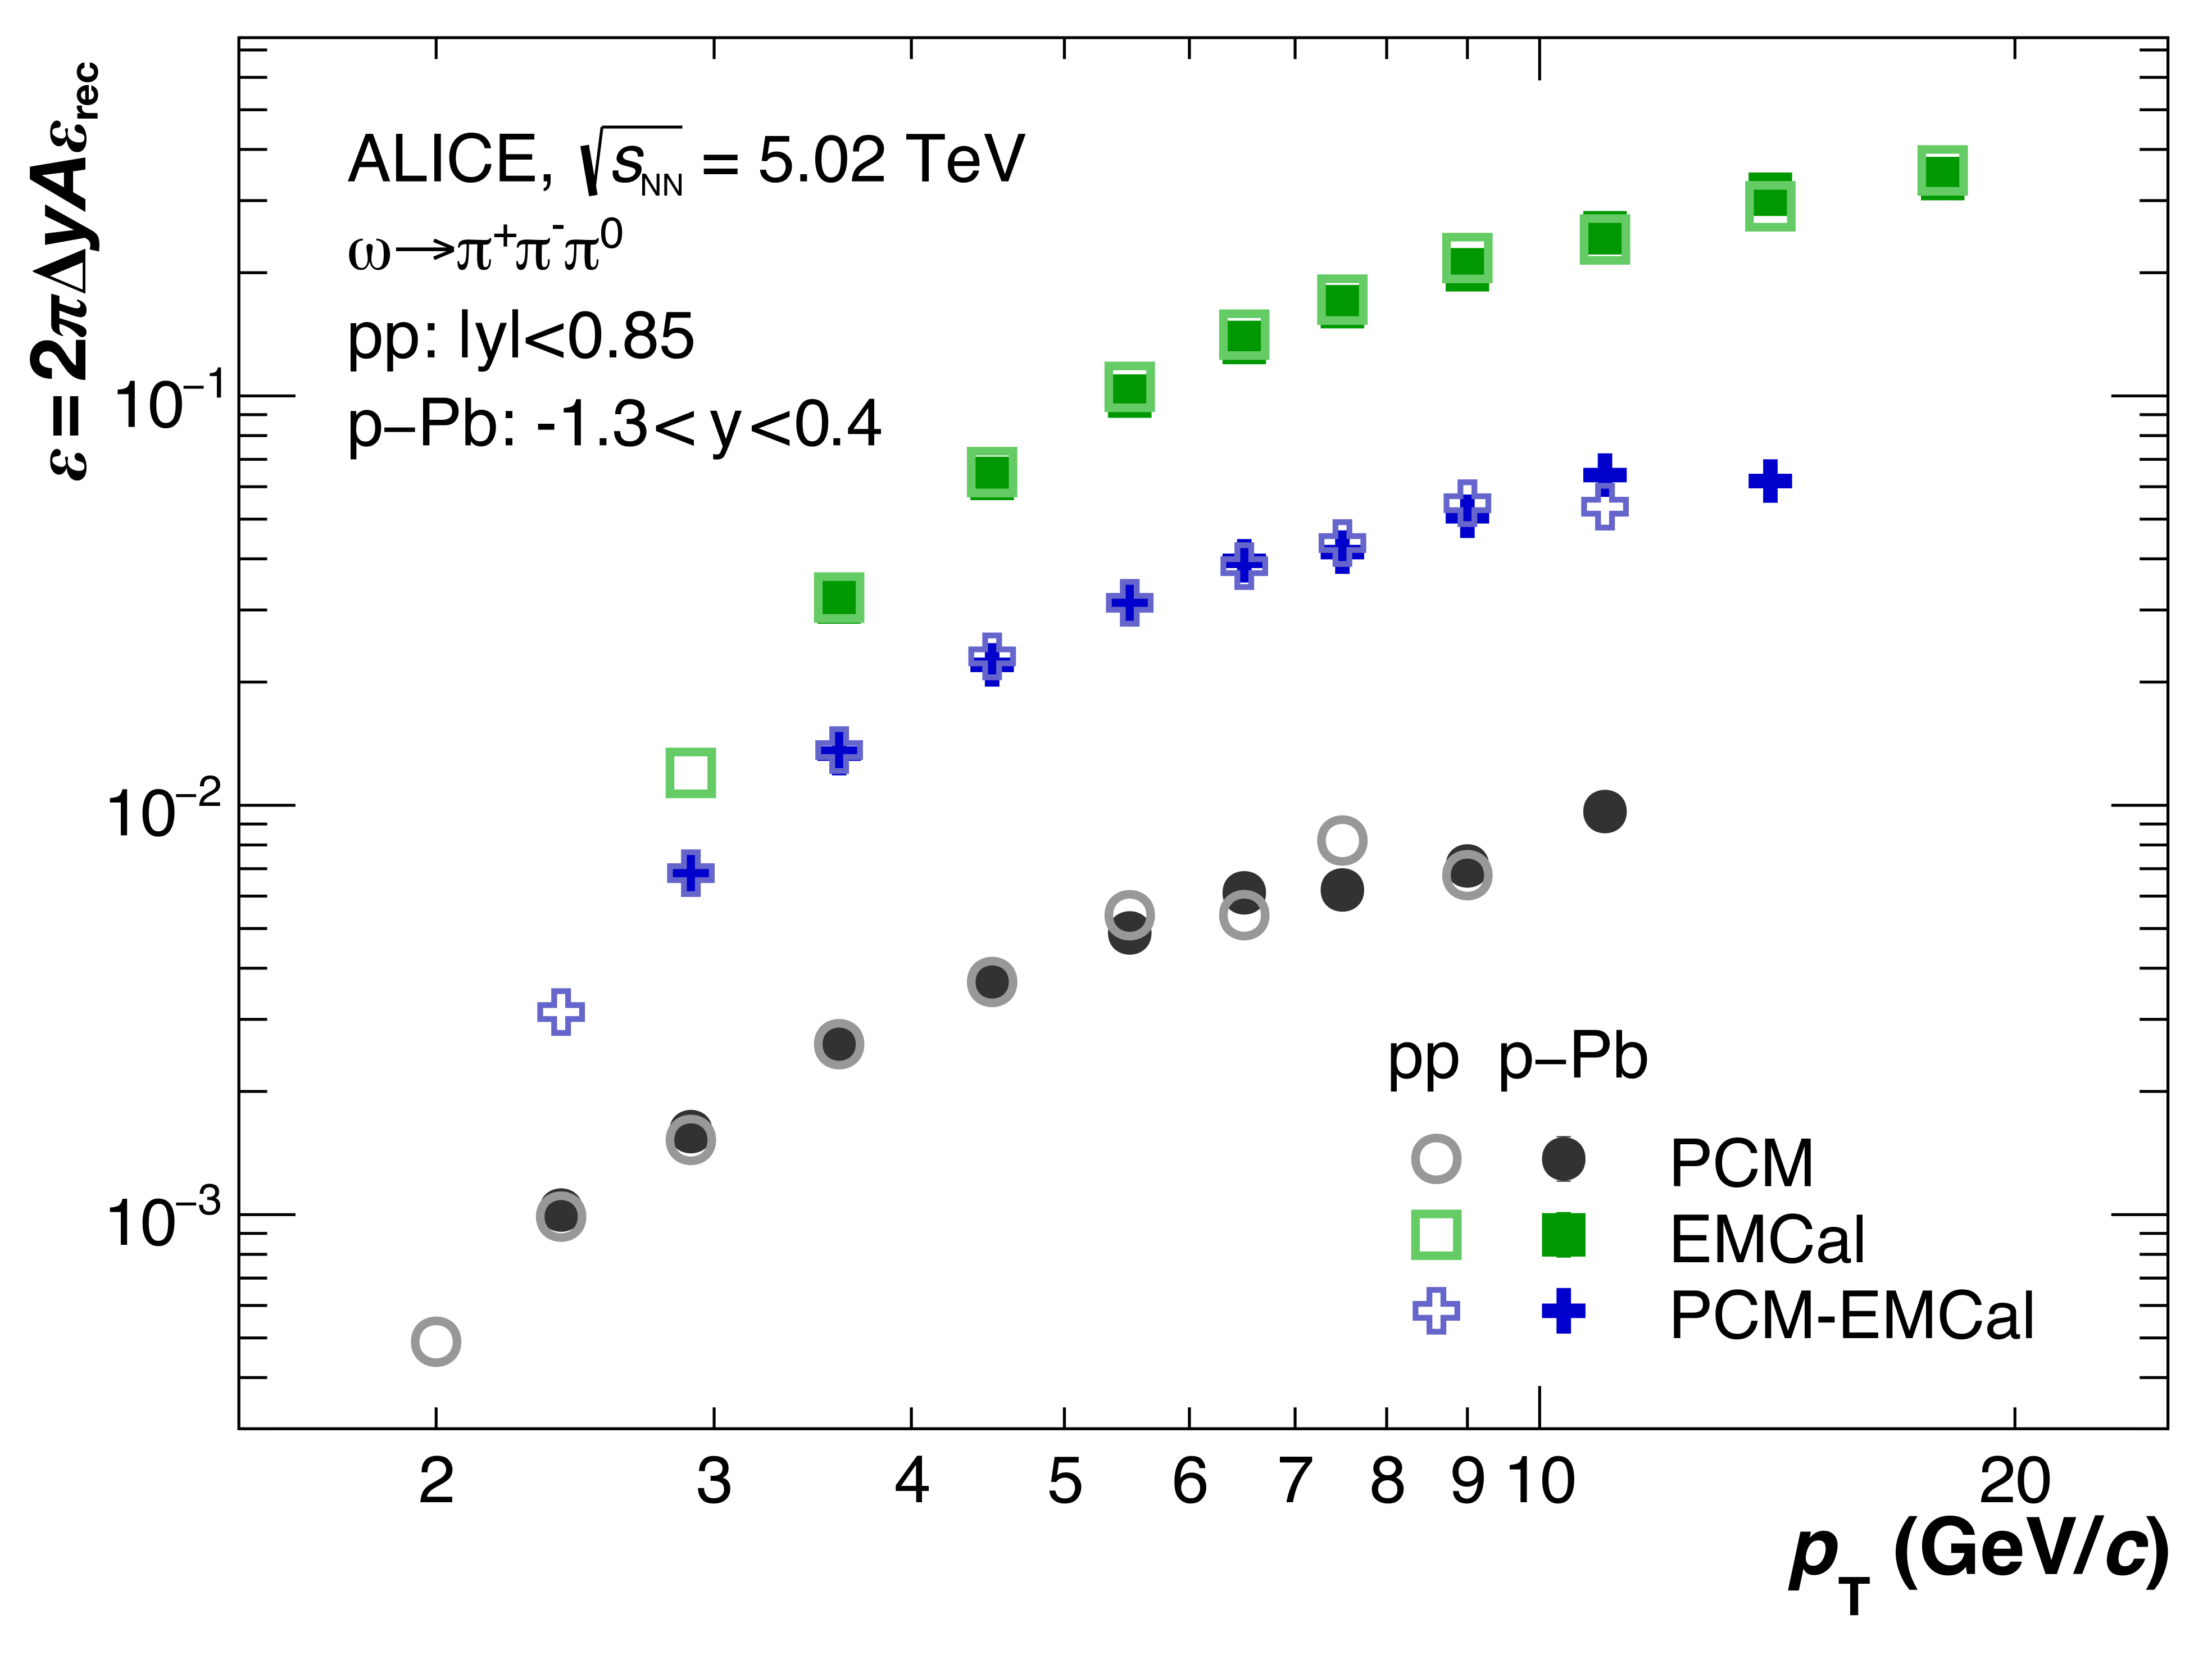 |
Figure 3
Ratio of the $\omega$ meson production cross sections extracted using the three different \piz reconstruction methods to a combined \LT parametrization. Both in \pp (left) and in \pPb (right), agreement between the reconstruction methods is observed within the statistical (bars) and systematic (boxes) uncertainties. | 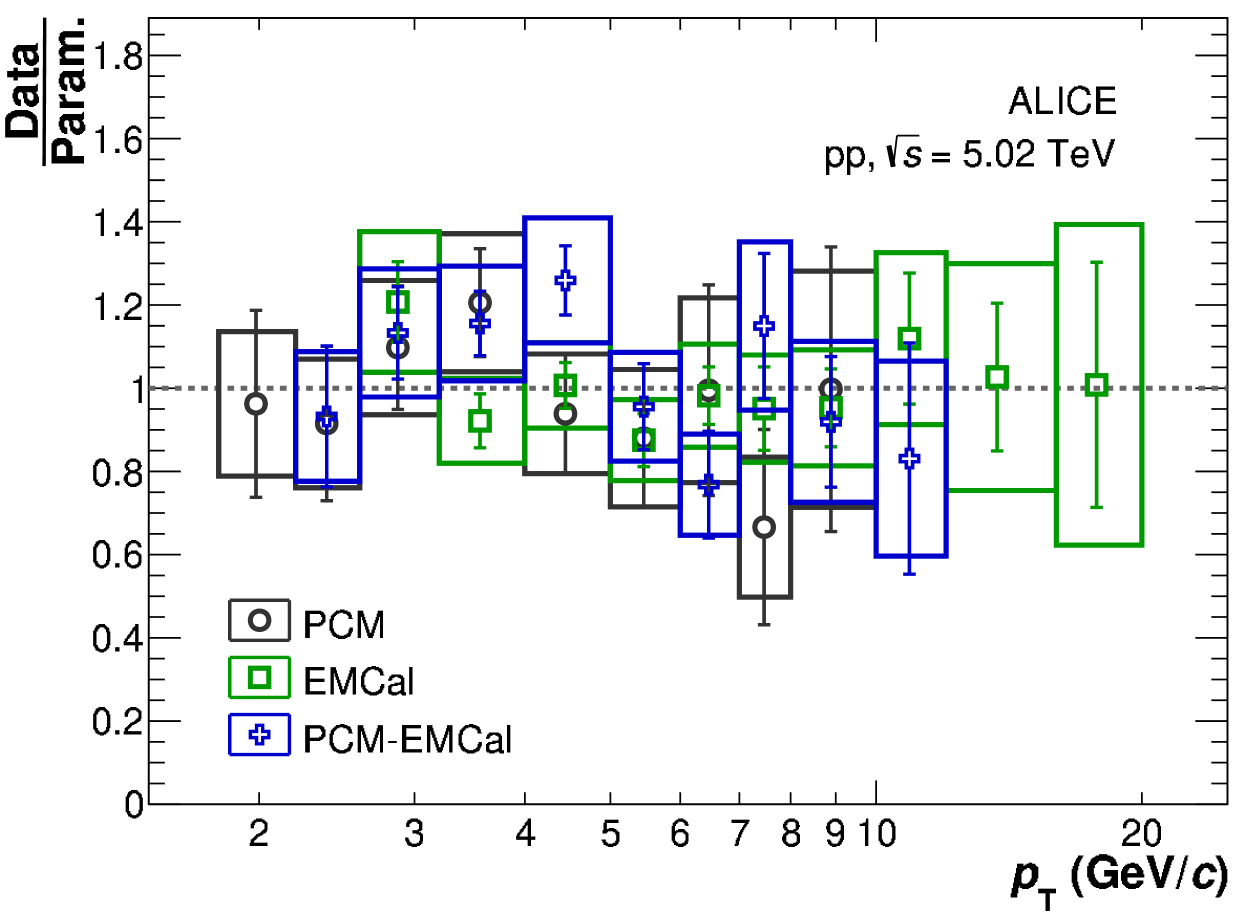 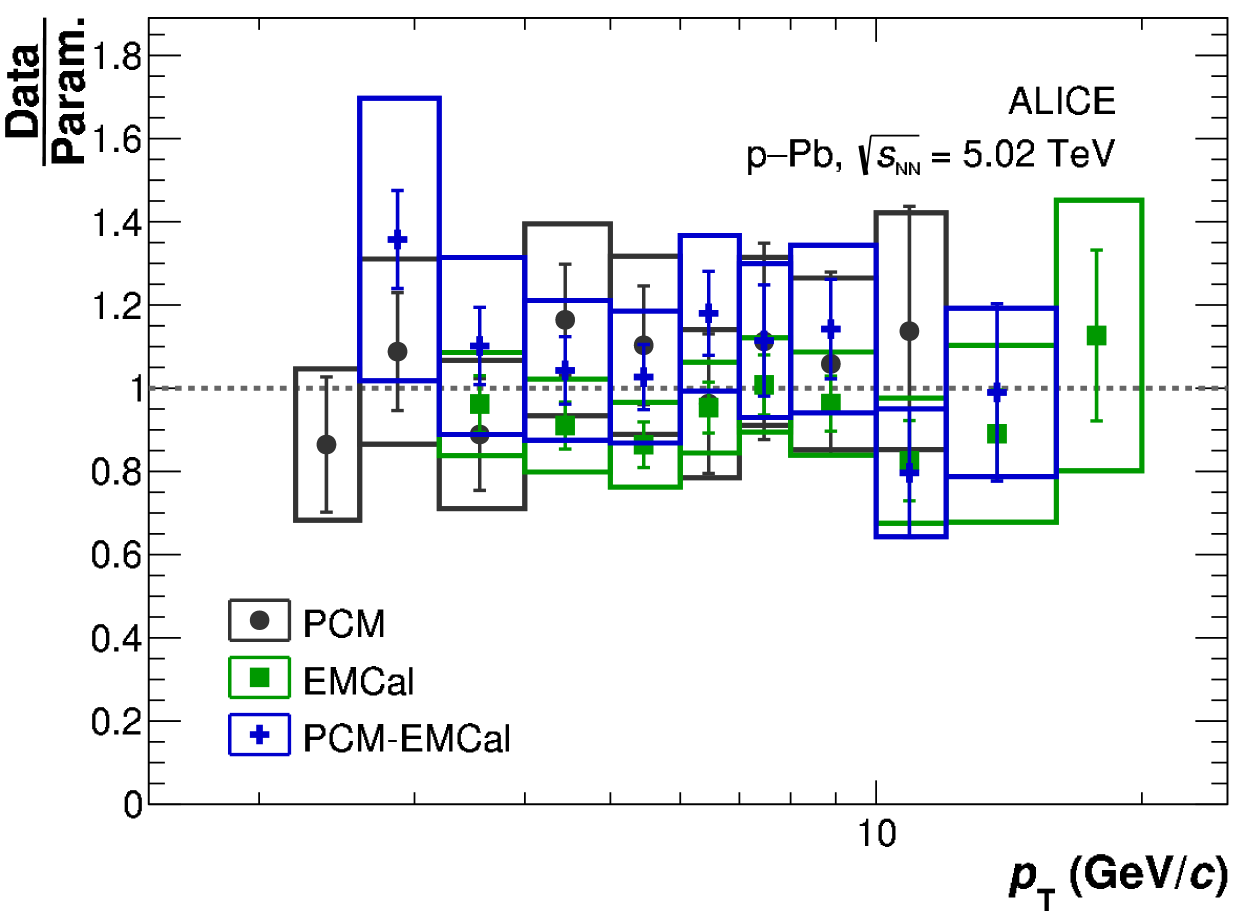 |
Figure 4
Lorentz-invariant $\omega$ meson production cross section in \pp (open markers) and \pPb (closed markers). Statistical uncertainties are represented by vertical error bars, while boxes show the systematic uncertainties. Furthermore shown are \LT parametrizations of the two cross sections and two predictions from simulations of the $\omega$ meson production per collision system. The lower panels contain the ratios of the data and simulations to the parametrization of the data points in the respective collision system. A gray box in each ratio panel depicts the normalization uncertainty of the visible minimum bias cross section. | 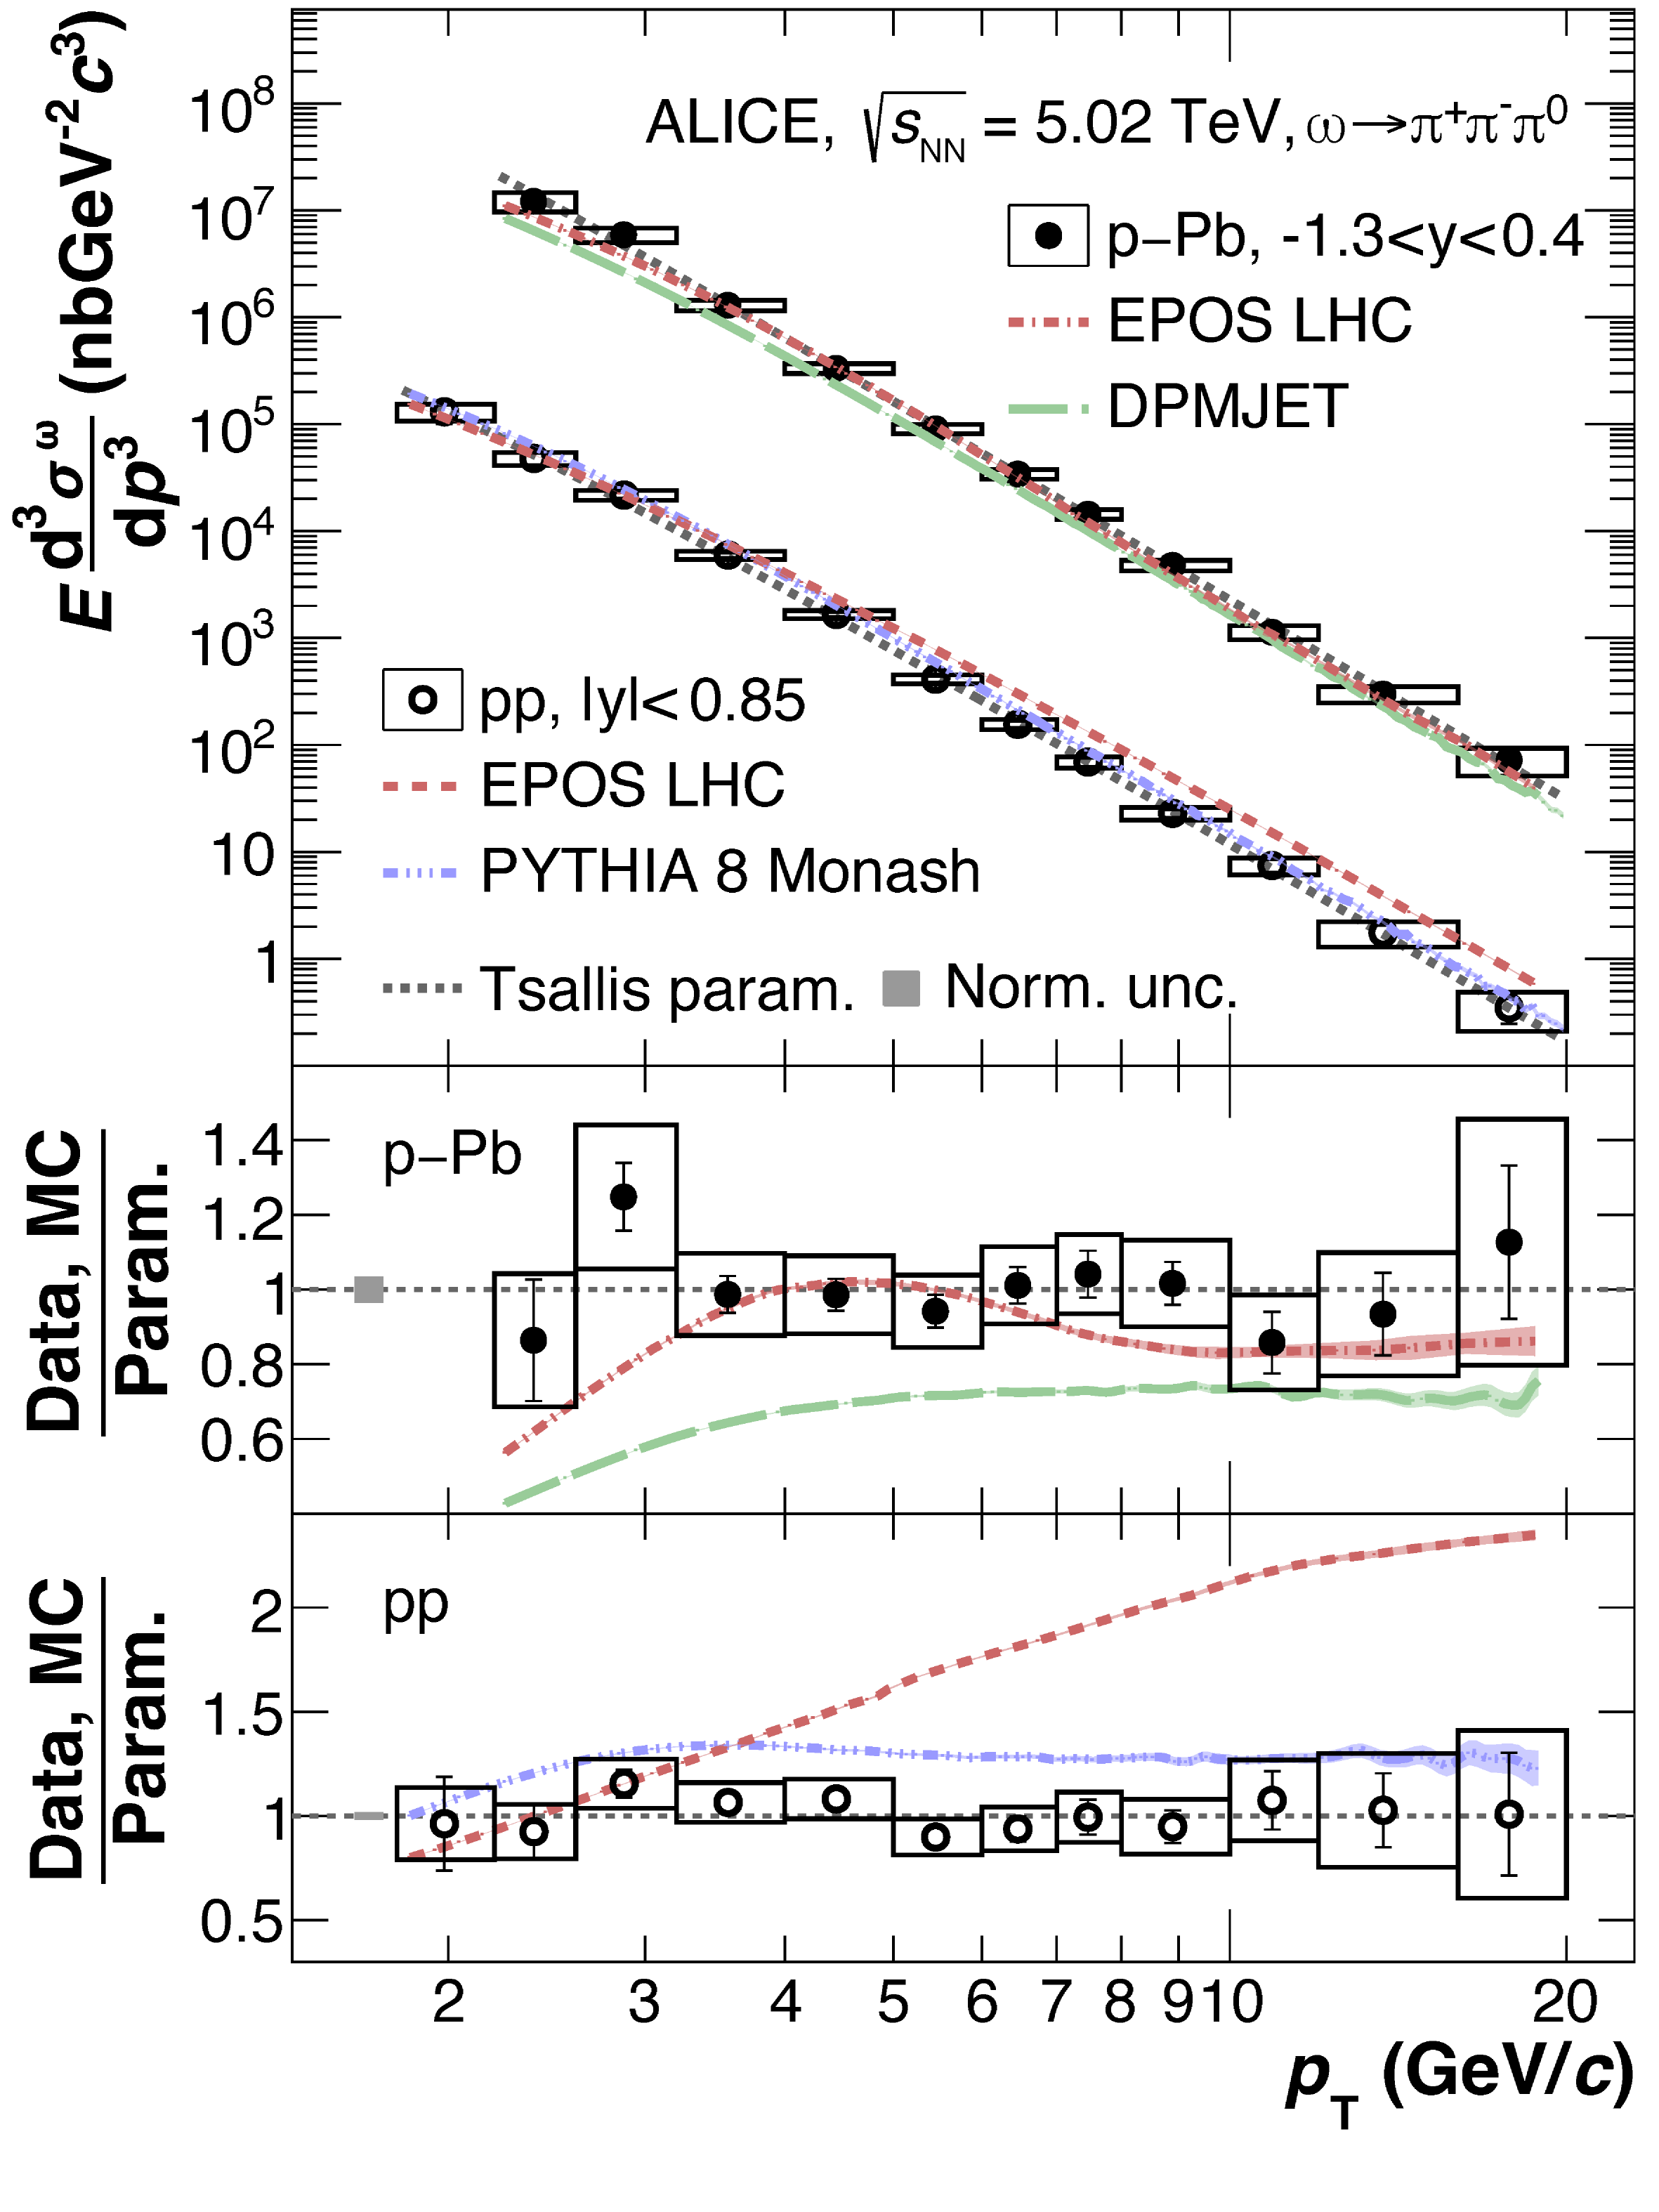 |
Figure 5
Production ratio $\omega$/\piz in \pp and \pPb collisions calculated using the $\omega$ meson production measurements and the corresponding charged and neutral pion references, respectively. The charged pion reference was scaled up by 3.3\% (see text for details). Also shown are two predictions from simulations per collision system, with bands representing their statistical uncertainties, as well as a $m_\text{T}$ scaling curve, which converges towards a high-\pt constant (C) fitted to the ratio for \pt $>$ 4 \GeVc. | 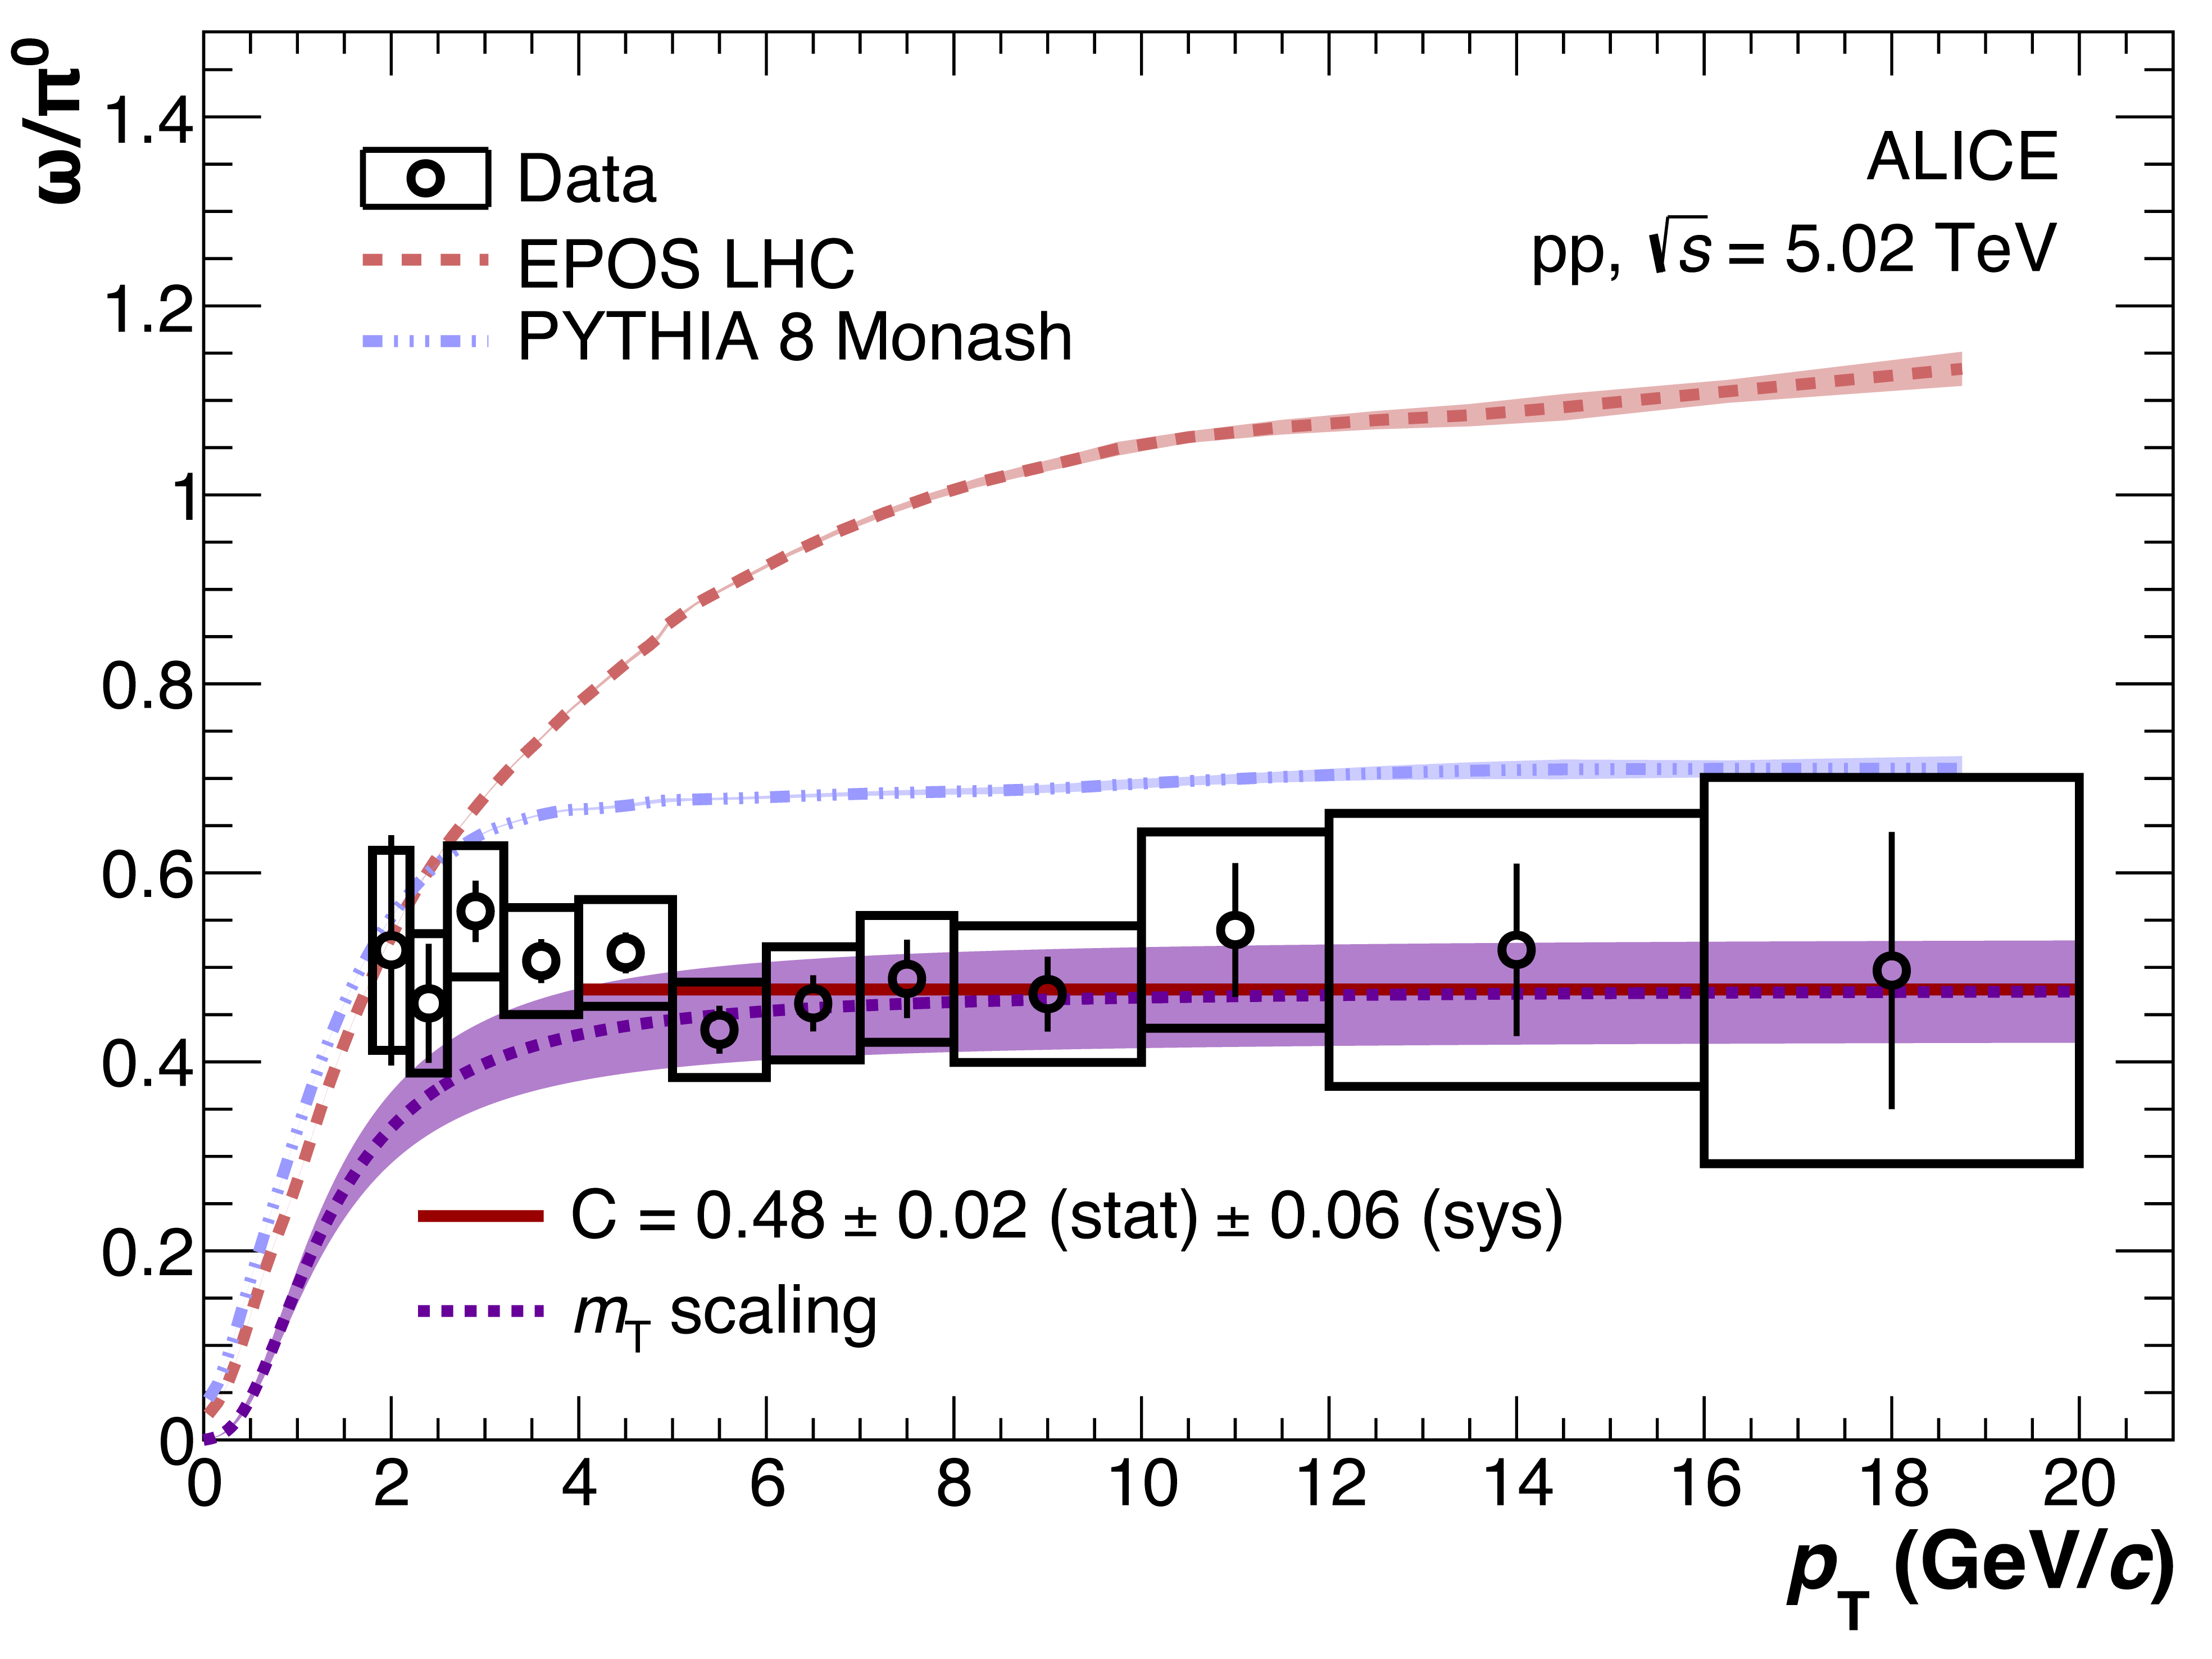 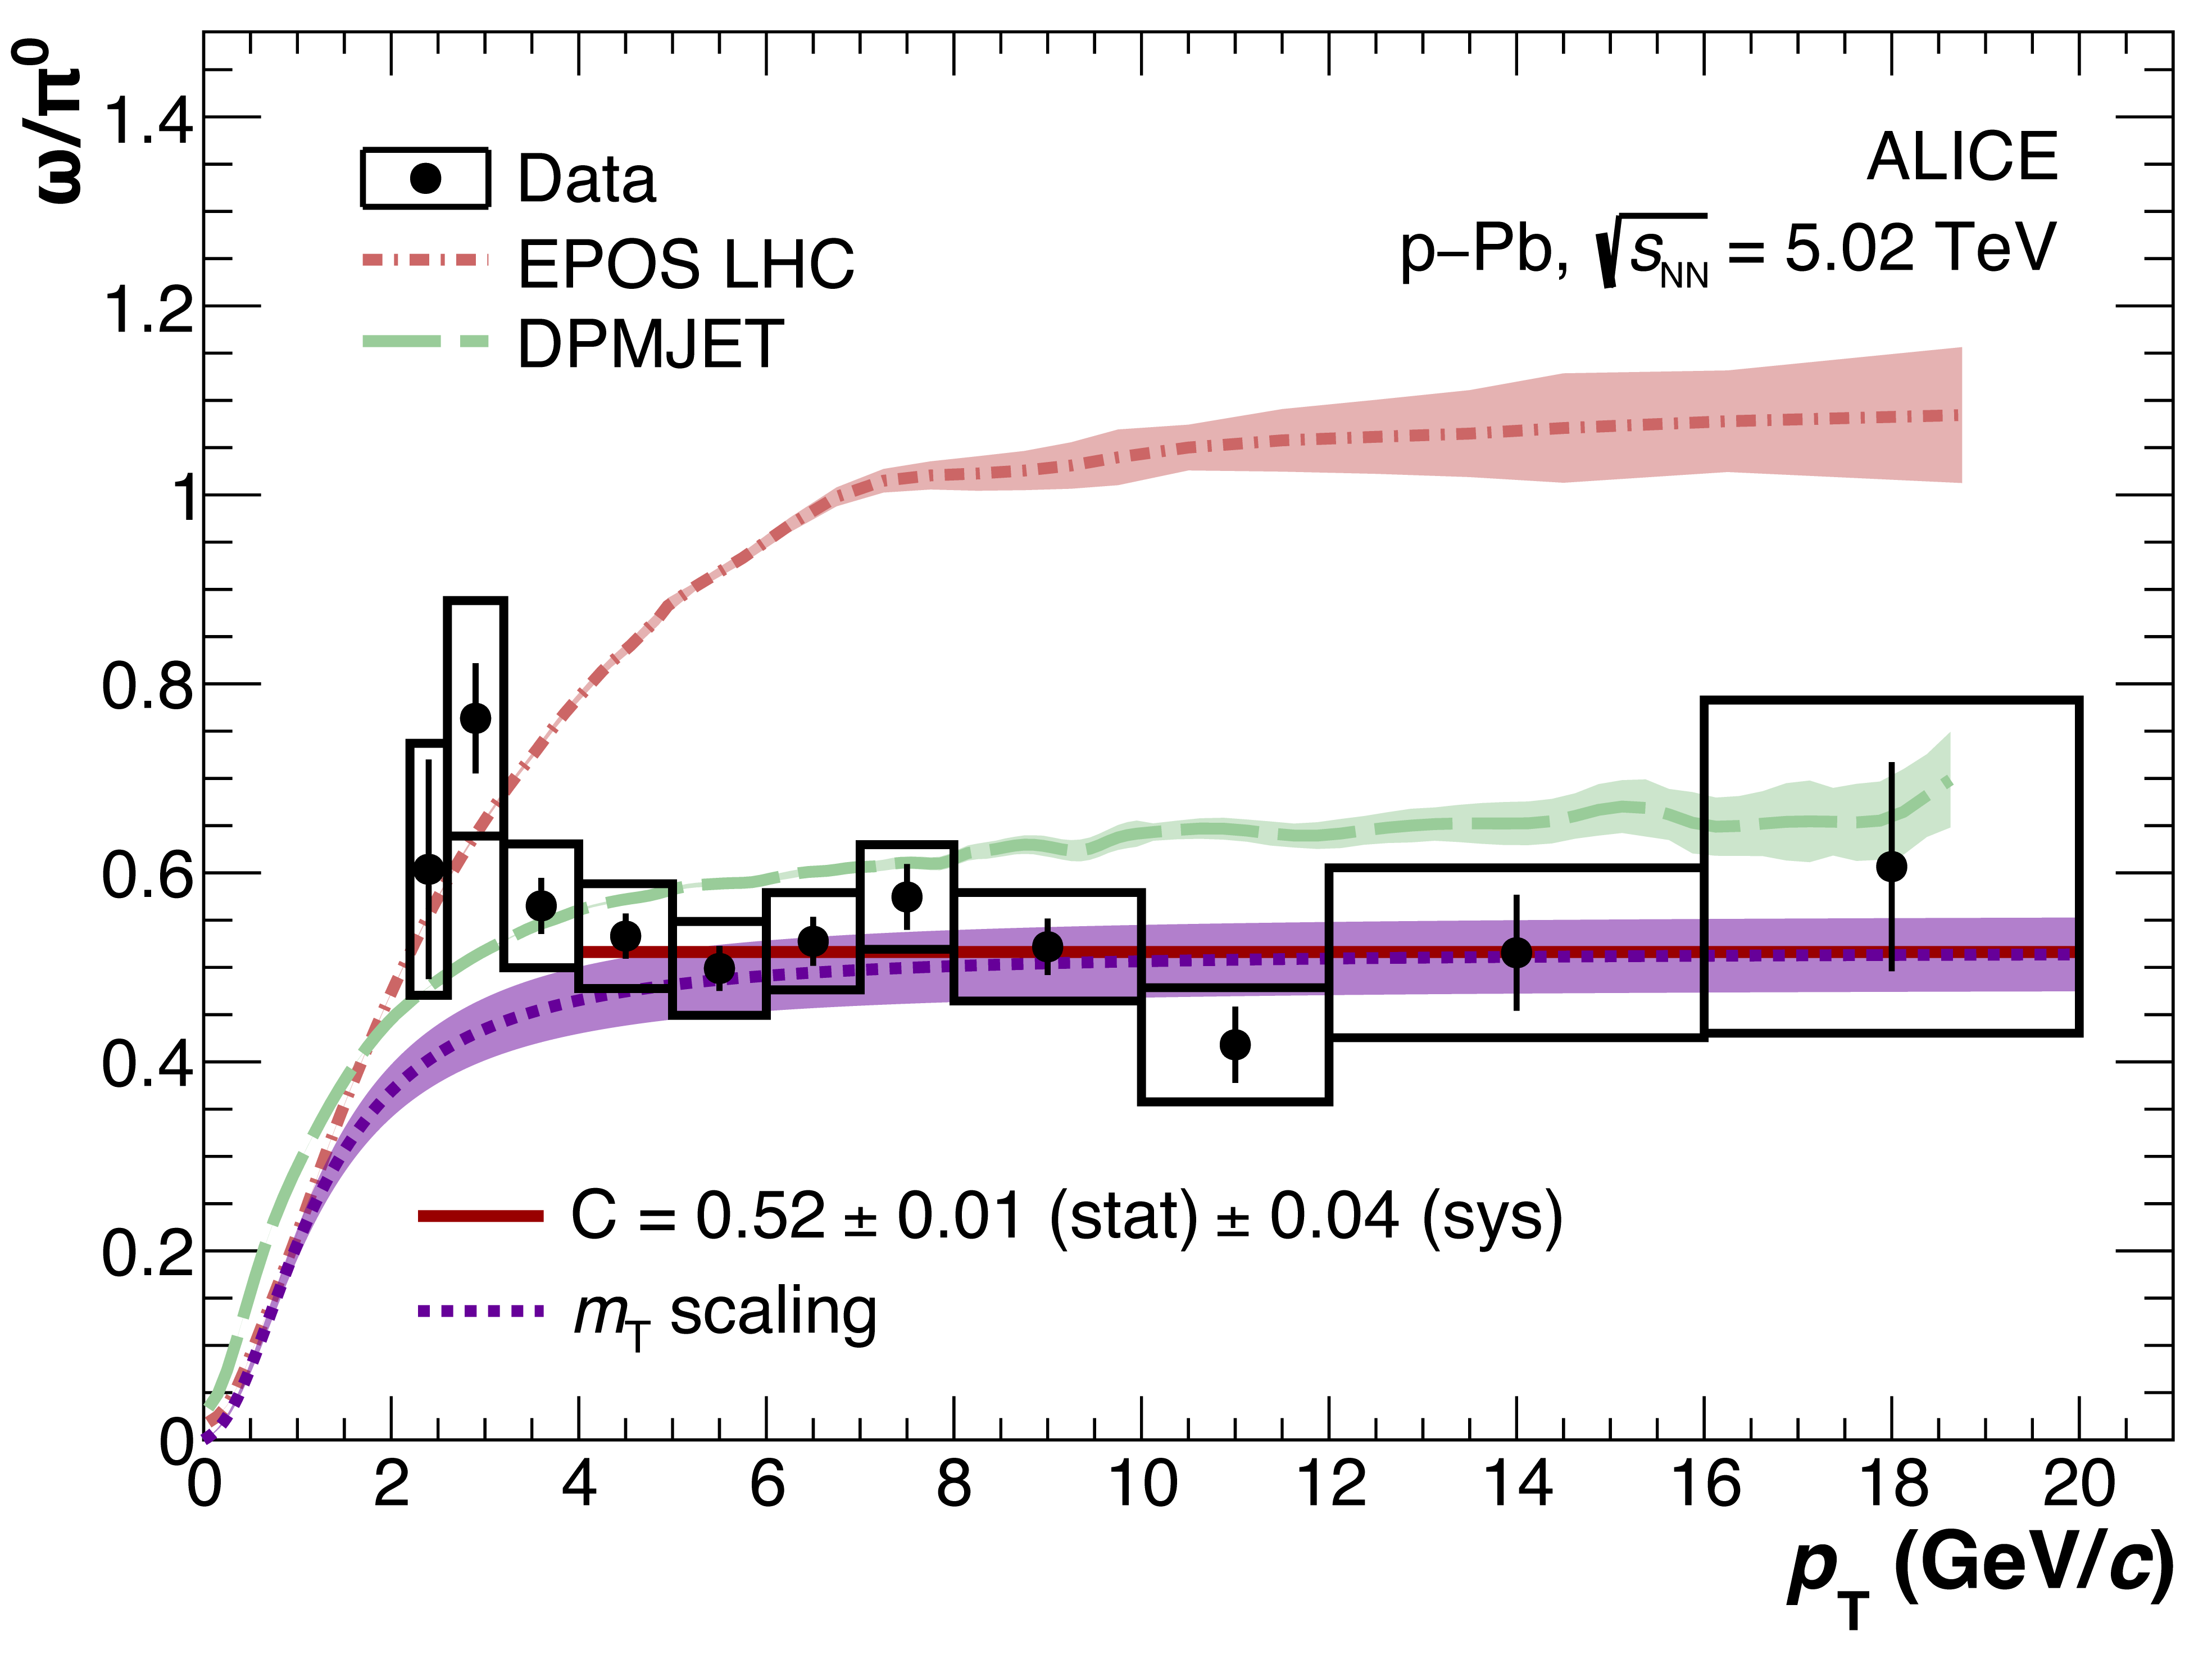 |
Figure 6
Compilation of measurements of the $\omega$/\piz ratio (left) in \pp collisions at various center-of-mass energies covering 0.062 $$ \s (\TeV) $$ 13 at the ISR , PHENIX and \acs{ALICE} , including the \pp measurement presented herein. Vertical error bars represent total uncertainties, high-\pt data points at \thirteen up to \pt = 50 \GeVc are omitted here for better visibility. The right-hand side displays values obtained from parametrizations of the $\omega/\piz$ ratios above \pt $>$ 4 \GeVc, as well as predictions of this high-\pt constant for different lower bounds using \Pythia . | 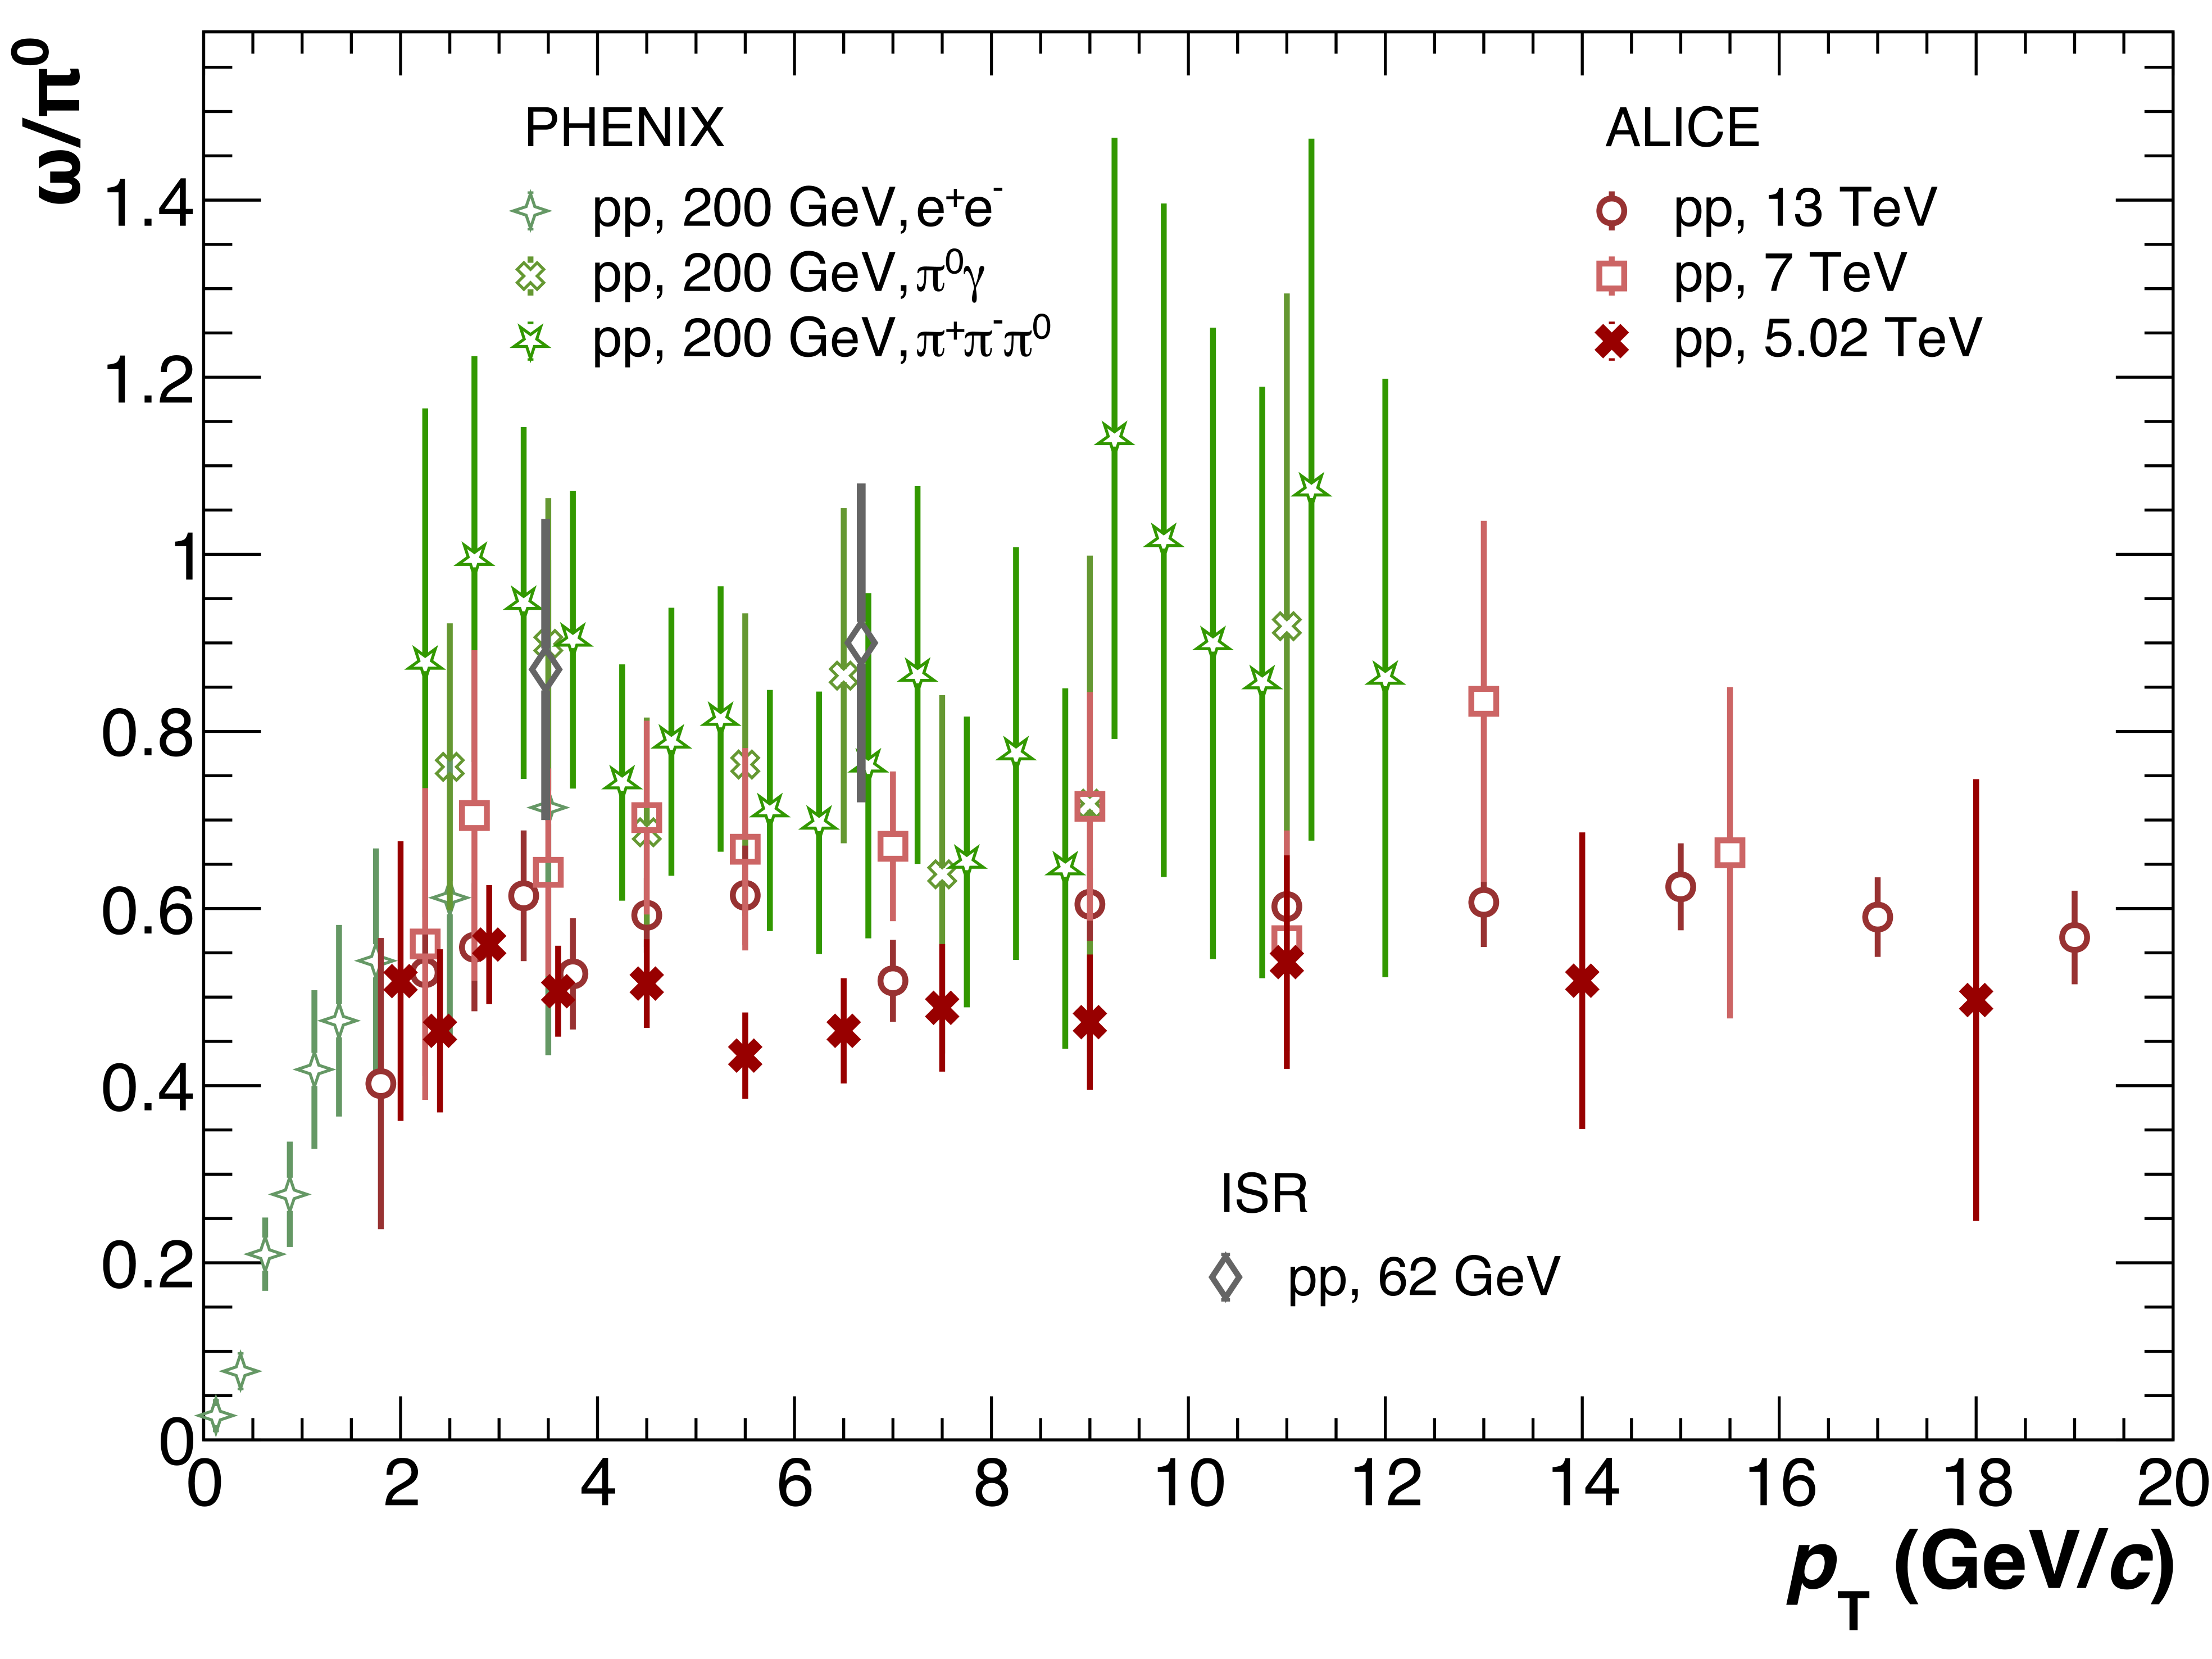 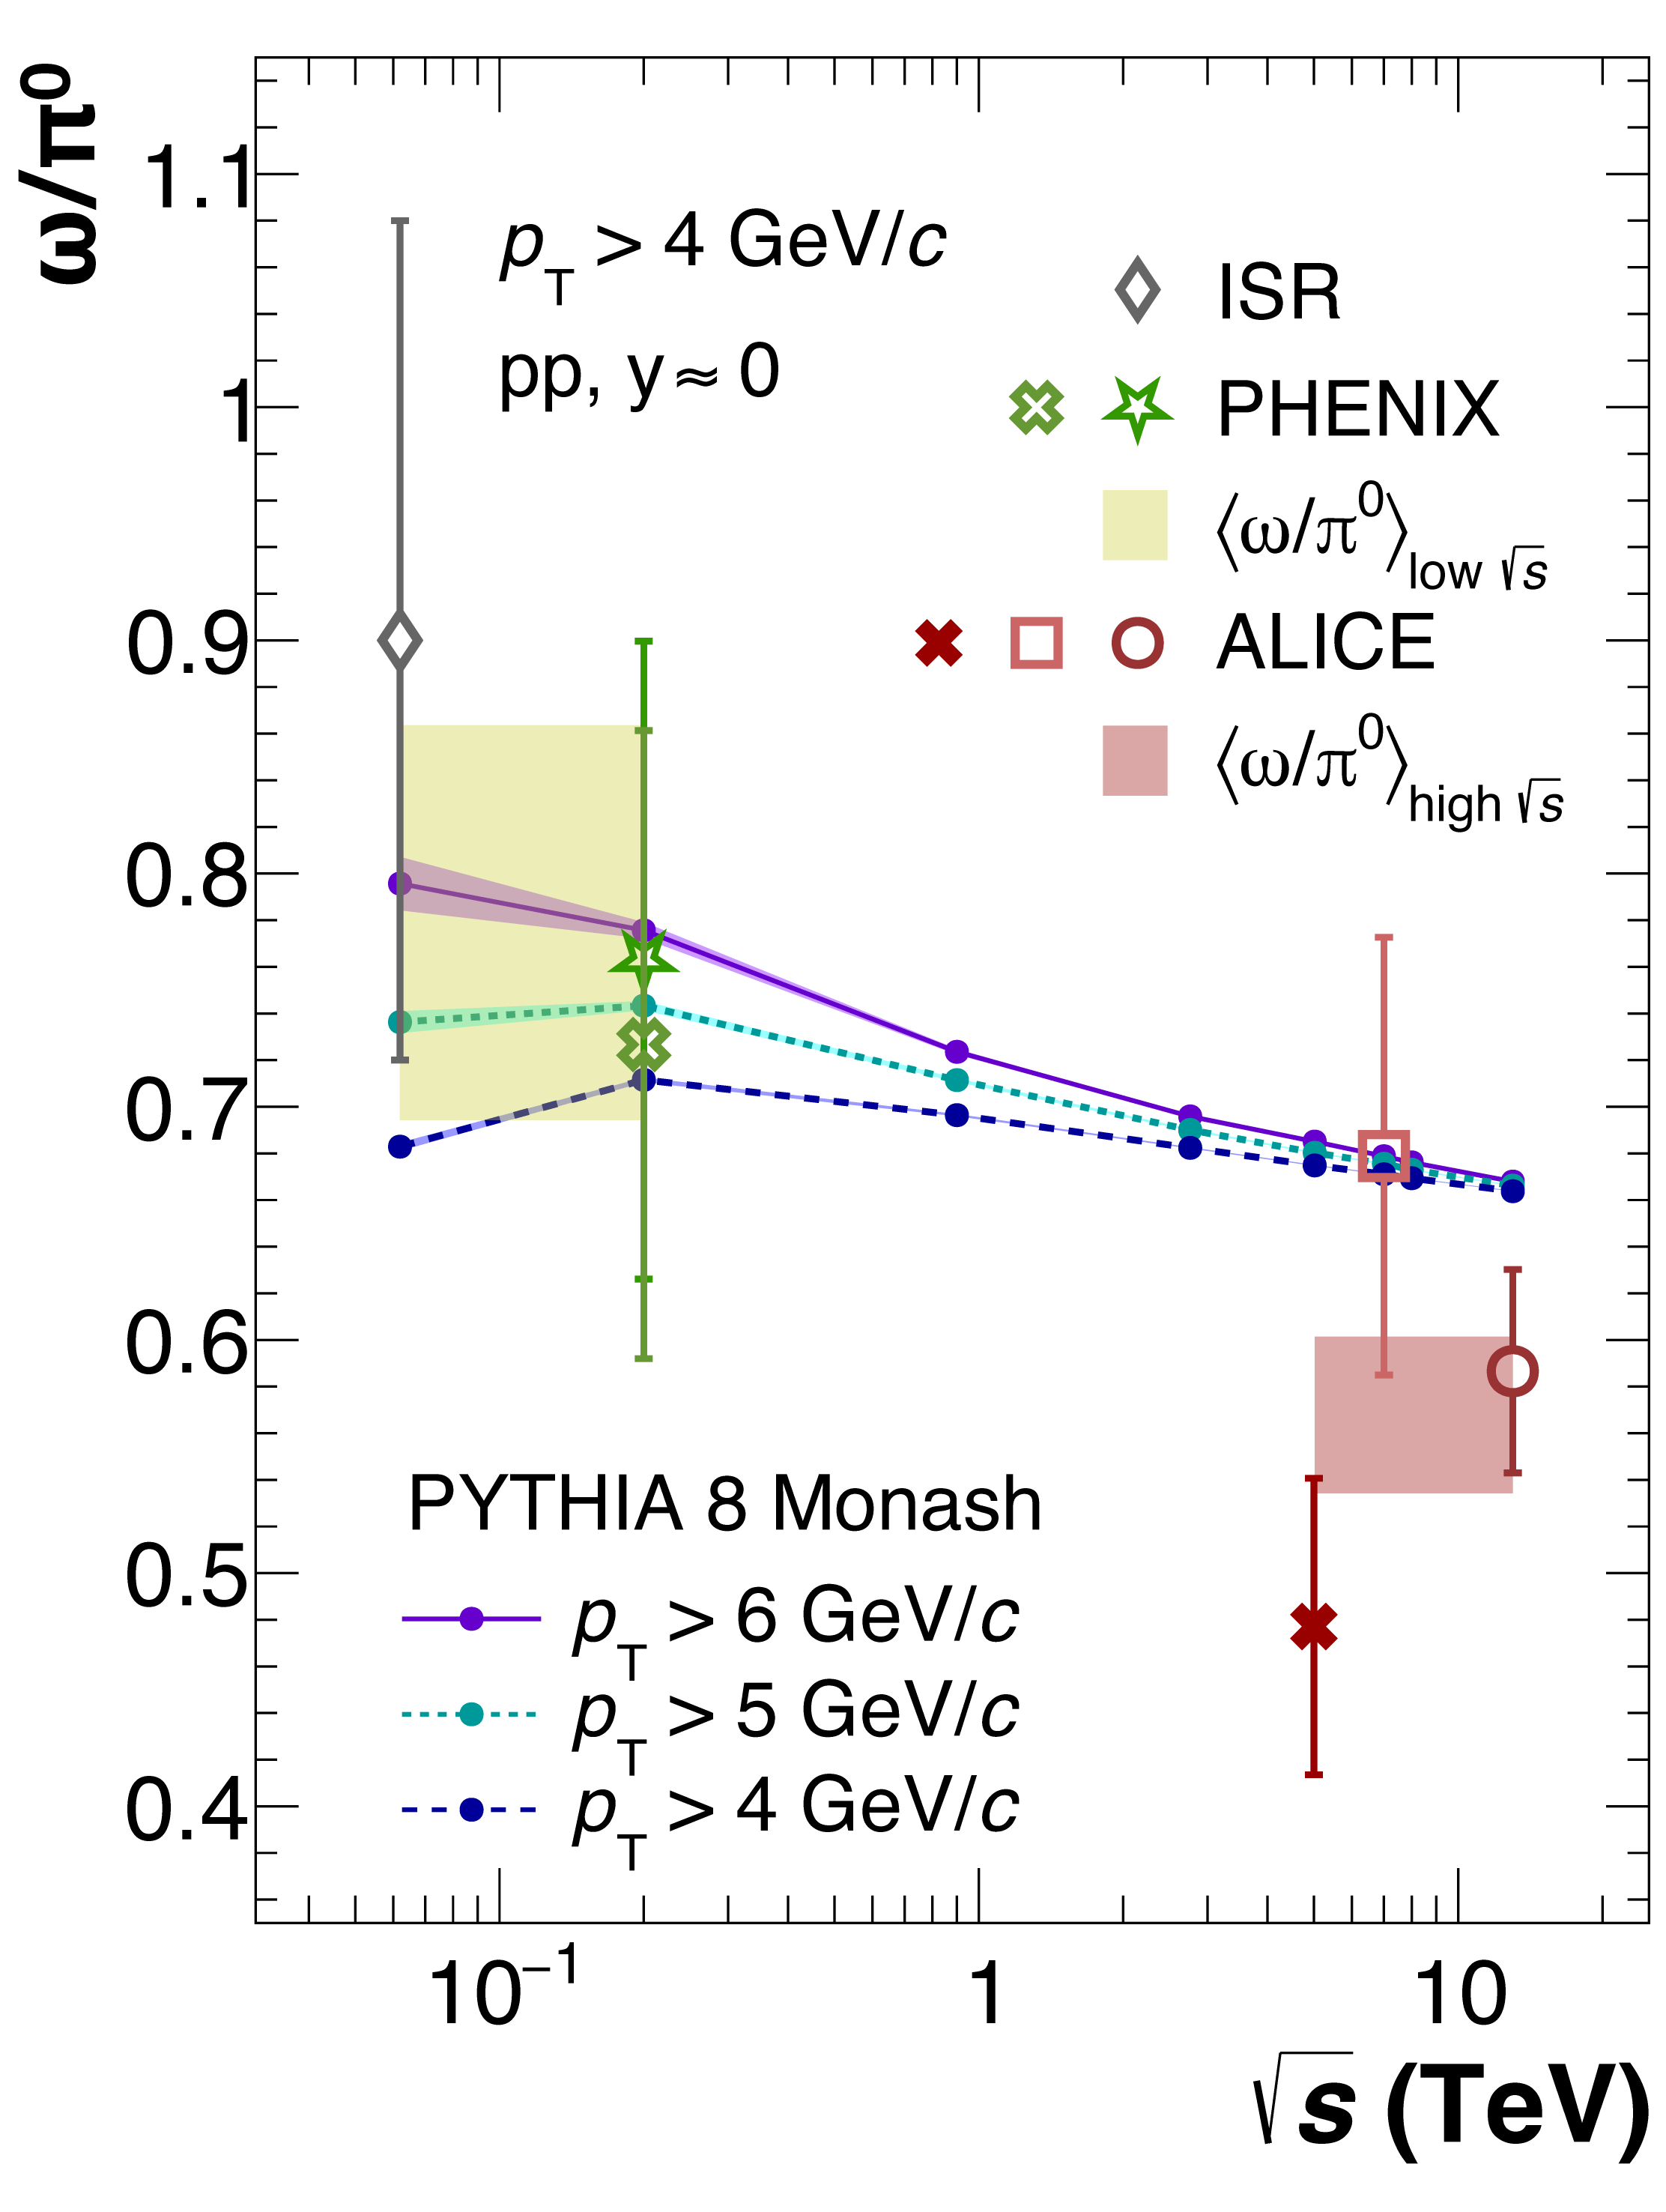 |
Figure 7
Measured nuclear modification factor \RpPb of the $\omega$ meson at \fivenn shown with red markers, as well as a nuclear modification factor of neutral pions at the same center-of-mass energy and the measurements for $\omega$ mesons at \twoHnn . Vertical error bars and boxes represent statistical and systematic uncertainties, while the two solid boxes show the normalization uncertainty of the ALICE measurements. | 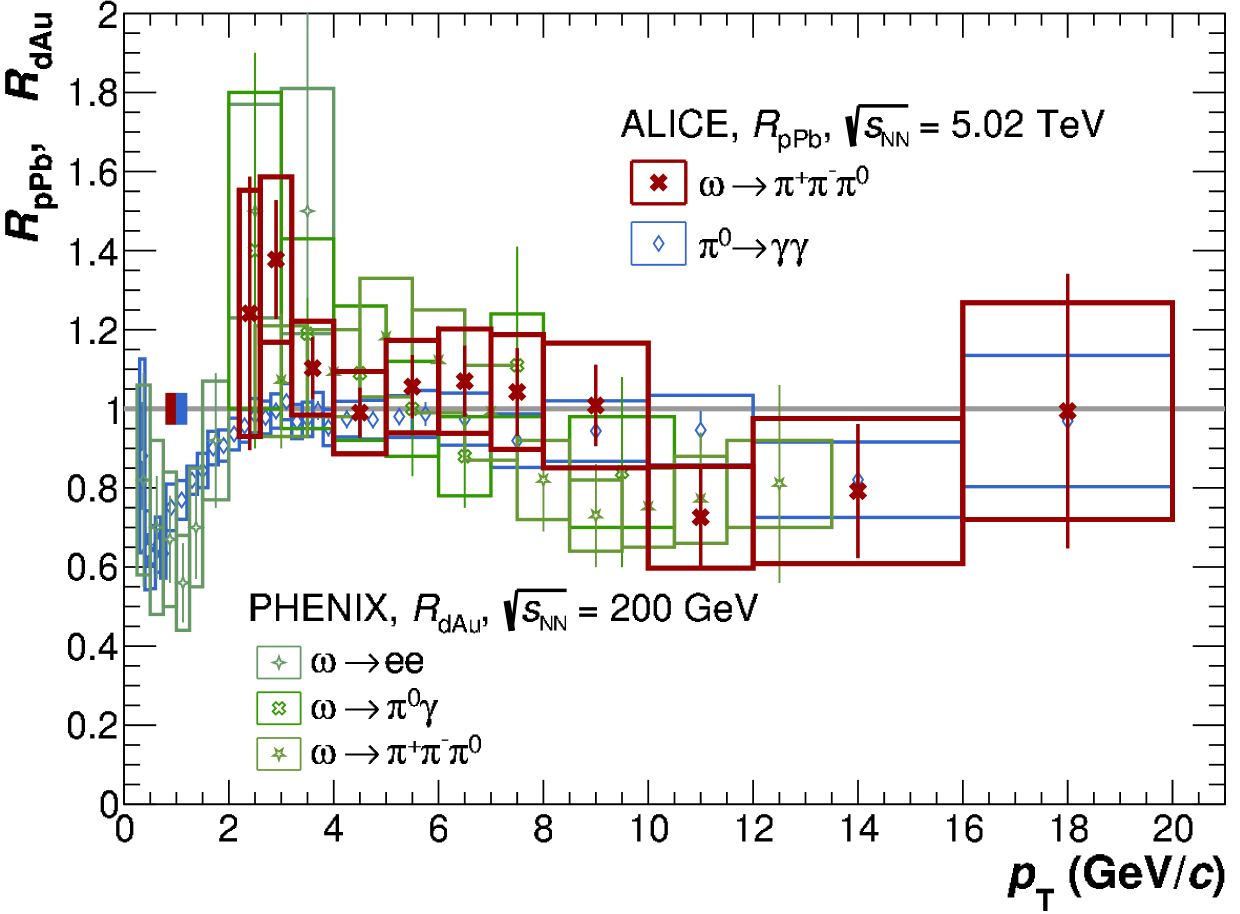 |