The strength of forward-backward (FB) multiplicity correlations is measured by the ALICE detector in proton-proton (pp) collisions at $\sqrt{s}=0.9$, 2.76 and 7 TeV. The measurement is performed in the central pseudorapidity region ($|\eta| < 0.8$) for the transverse momentum $p_{\rm T}>0.3$ GeV/$c$. Two separate pseudorapidity windows of width ($\delta \eta$) ranging from 0.2 to 0.8 are chosen symmetrically around $\eta=0$. The multiplicity correlation strength ($b_{\rm cor}$) is studied as a function of the pseudorapidity gap ($\eta_{\rm gap}$) between the two windows as well as the width of these windows. The correlation strength is found to decrease with increasing $\eta_{\rm gap}$ and shows a non-linear increase with $\delta\eta$. A sizable increase of the correlation strength with the collision energy, which cannot be explained exclusively by the increase of the mean multiplicity inside the windows, is observed. The correlation coefficient is also measured for multiplicities in different configurations of two azimuthal sectors selected within the symmetric FB $\eta$-windows. Two different contributions, the short-range (SR) and the long-range (LR), are observed. The energy dependence of $b_{\rm cor}$ is found to be weak for the SR component while it is strong for the LR component. Moreover, the correlation coefficient is studied for particles belonging to various transverse momentum intervals chosen to have the same mean multiplicity. Both SR and LR contributions to $b_{\rm cor}$ are found to increase with $p_{\rm T}$ in this case. Results are compared to PYTHIA and PHOJET event generators and to a string-based phenomenological model. The observed dependencies of $b_{\rm cor}$ add new constraints on phenomenological models.
JHEP 05 (2015) 097
HEP Data
e-Print: arXiv:1502.00230 | PDF | inSPIRE
CERN-PH-EP-2015-012

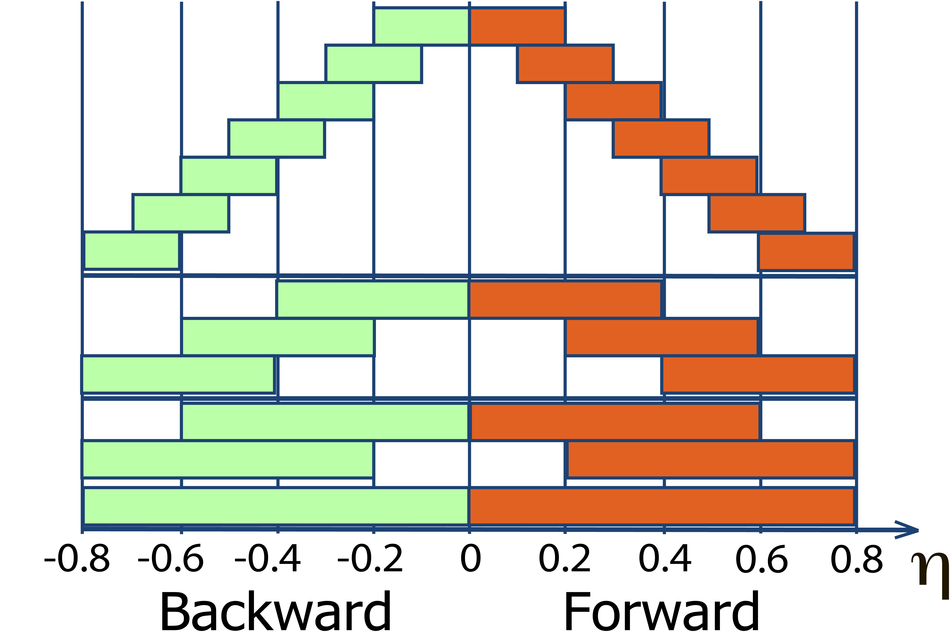
Figure 3
Illustration of 8 configurations of azimuthal sectors. Forward and backward pseudorapidity windows of the width $\deta=0.2$ are additionally split into 8 azimuthal sectors with the width $\dphi$=$\pi$/4. The red sectors correspond to the first window of the FB pair, the green sectors to the second one. The variable $\phi_{sep}$ is the separation in azimuthal angle between centres of the sectors | 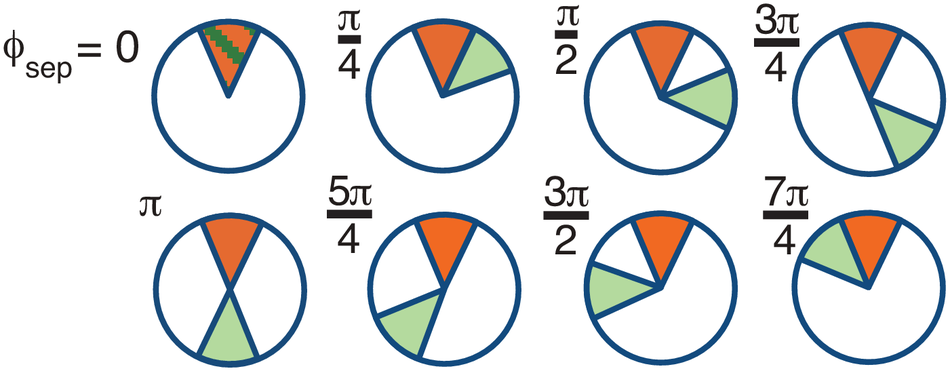 |
Figure 4
Illustrative example of forward versus backward raw multiplicity distribution for windows with $\deta=0.6$ and $\eta_{gap}=0.4$ at $\sqrt{s}=7$ TeV (left) and corresponding correlation function (right) The correlation strength $b_{corr}$ is obtained from a linear fit according to Eq. \ref{linear}. Since most of the statistics is at low multiplicities,the fit is mainly determined by the first points | 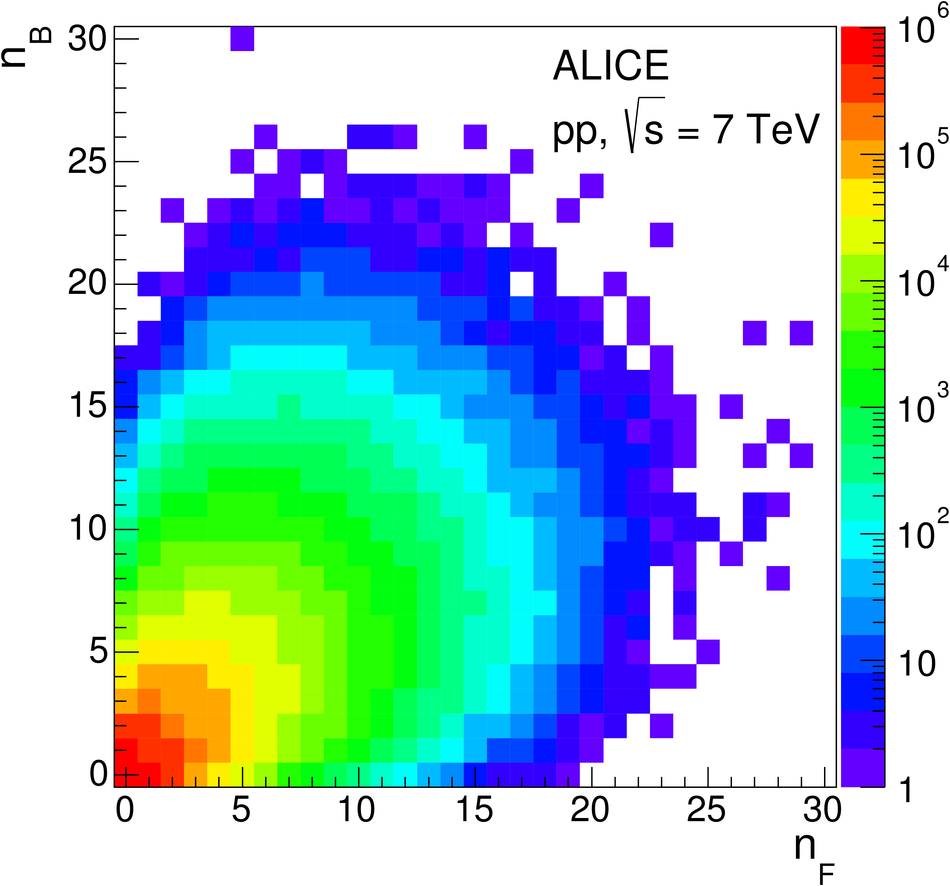 |

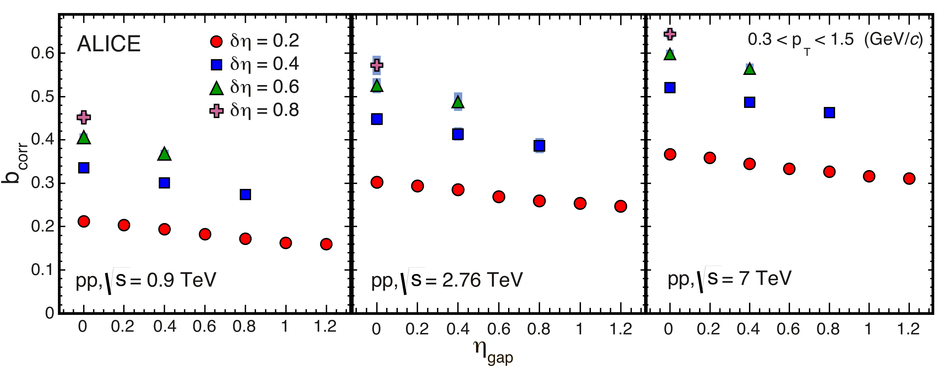
Figure 6
Correlation strength $b_{corr}$ as a function of $\delta\eta$ for $\eta_{gap}=0$ in pp collisionsfor $\sqrt{s}=0.9$, 2.76 and 7 TeV The MC results from PYTHIA6 Perugia 0 (solid line), Perugia 2011 (dotted line) and PHOJET (dashed line), calculated at generator level, are shown for comparison. The bottom panels show the ratio of $b_{corr}$ between data and MC. The red dashed curves correspond to the model of independent particle emission from a fluctuating source (see text) | 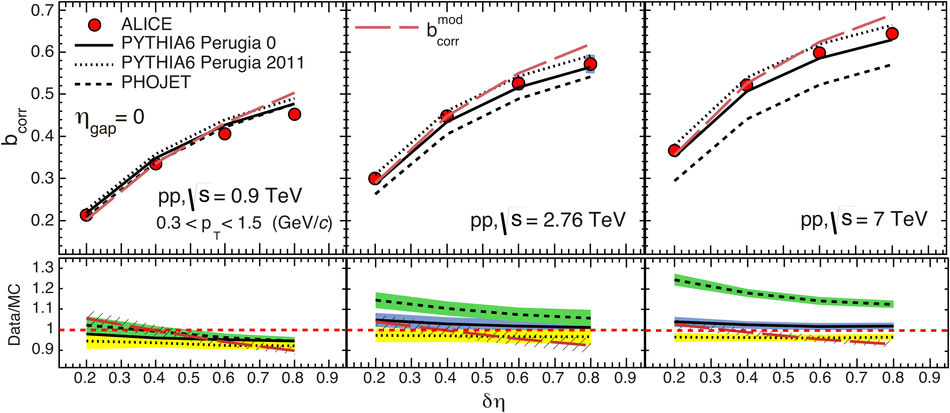 |
Figure 7
Correlation strength $b_{corr}$ for separated $\eta$-$\varphi$ window pairs at $\sqrt{s}=0.9$ TeV as a function of $\eta$ separation, with fixed window width $\delta\eta$=0.2 and $\delta\varphi$=$\pi$/4 The panels are for different separation distances between the two azimuthal sectors:$\varphi_{\rm sep}=0$, $\pi/4$, $\pi/2$, $(3/4)\pi$ and $\pi$ MC results from PYTHIA6 Perugia 0 (blue lines), Perugia 2011 (orange dashed lines) and PHOJET(pink dashed lines) and string model (thin green lines) are also shown The bottom panelsshow the ratio $b_{corr}$ between data and MC results. |  |
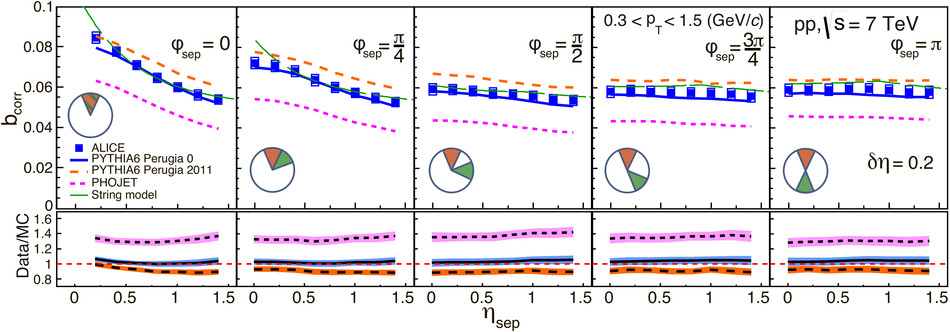
Figure 9
2D representation of $b_{corr}$ at (a) $\sqrt{s}=0.9$ TeV and (b) at $\sqrt{s}=7$ TeV for separated $\eta$-$\varphi$ window pairs with $\delta\eta$=0.2 and $\delta\varphi$=$\pi$/4. To improve visibility, the point ($\eta_{sep}$,$\phi_{sep}$)=(0,0) and thus $b_{corr}$=1 is limited to the level of the maximum value in adjacent bins |  |

Figure 10
Correlation strength $b_{corr}$ as a function of $\eta_{\rm gap}$ in pp collisions fordata taken from Fig.\,\ref{fig:fullPhiAllWindows}and compared to MC generators PYTHIA Perugia 0 (solid line), Perugia 2011 (dotted line) and PHOJET(dashed line) for $\sqrt{s}=0.9$, 2.76 and 7 TeV collision energies,windows width $\deta$ is 0.2. The bottom panelsshow the ratio of the data to MC. |  |
Figure 11
Ratio of $b_{corr}$ at 2.76 (blue squares) and 7 TeV (red circles) with respect to 0.9 TeV vs. $\eta_{\rm gap}$ The calculations from MC generators are also shown: PYTHIA Perugia 0 (solid line), Perugia 2011 (dotted line) and PHOJET (dashed line), for 2.76 TeV (blue lines) and 7 TeV (red lines). | 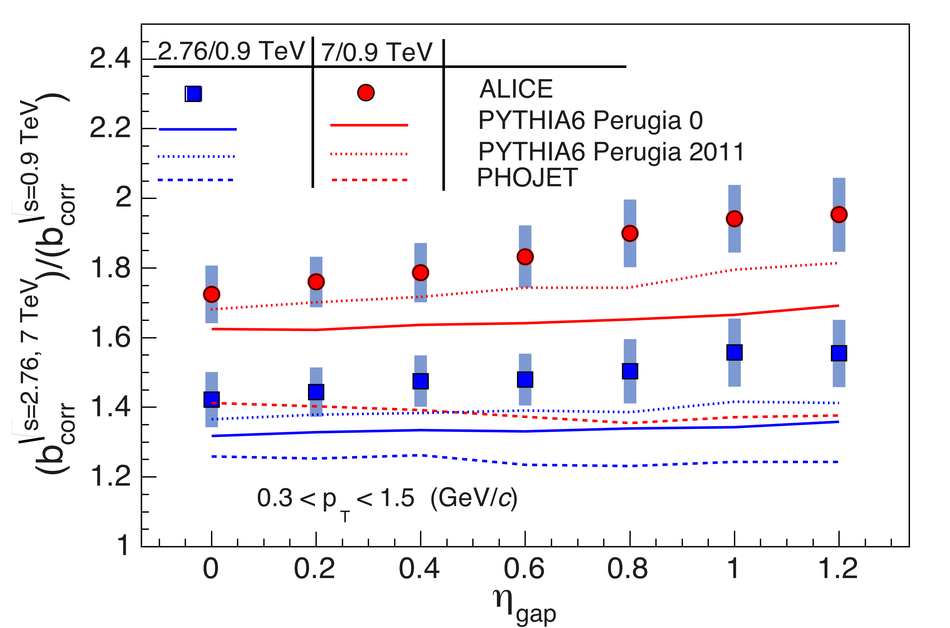 |
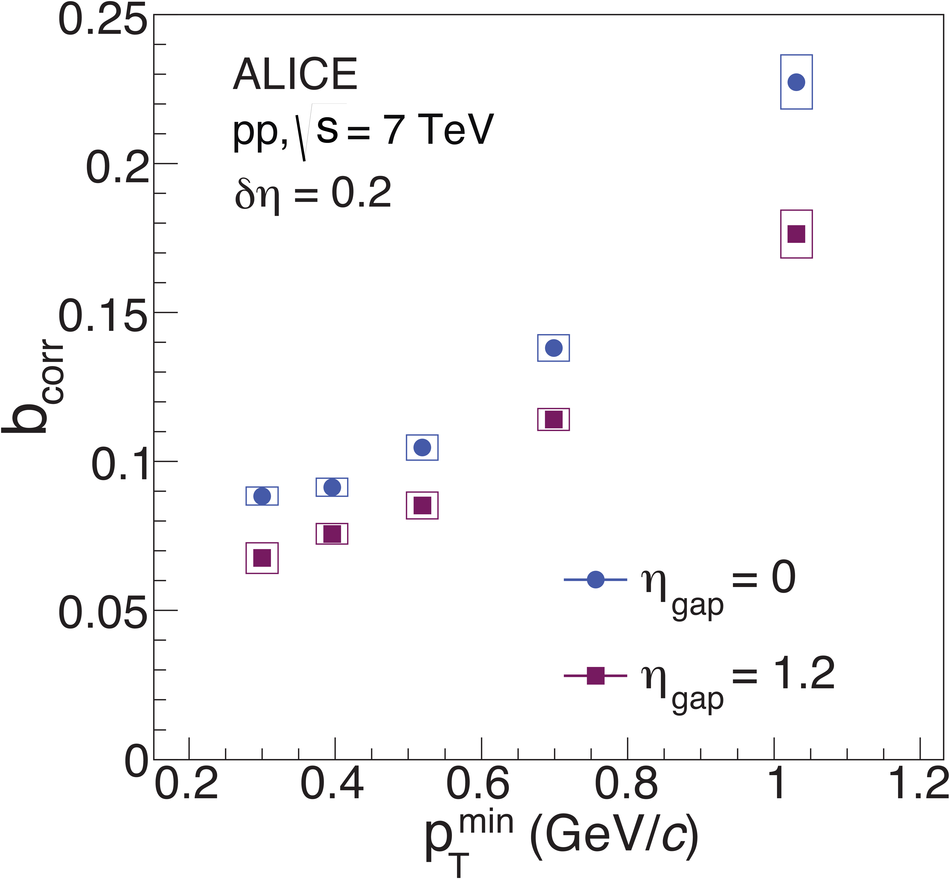
Figure 13
Correlation strength $b_{corr}$ at $\sqrt{s}=7$ TeV for separated pseudorapidity window pairs, measured in $\pt$ intervals with same $\langle \rm n_{\rm ch}\rangle$ as a function of $\eta_{gap}$. Windows of width $\delta\eta$=0.2 Left and right panels contain same data points, lines correspond to PYTHIA6 Perugia 2011 (left) andto PHOJET (right) | 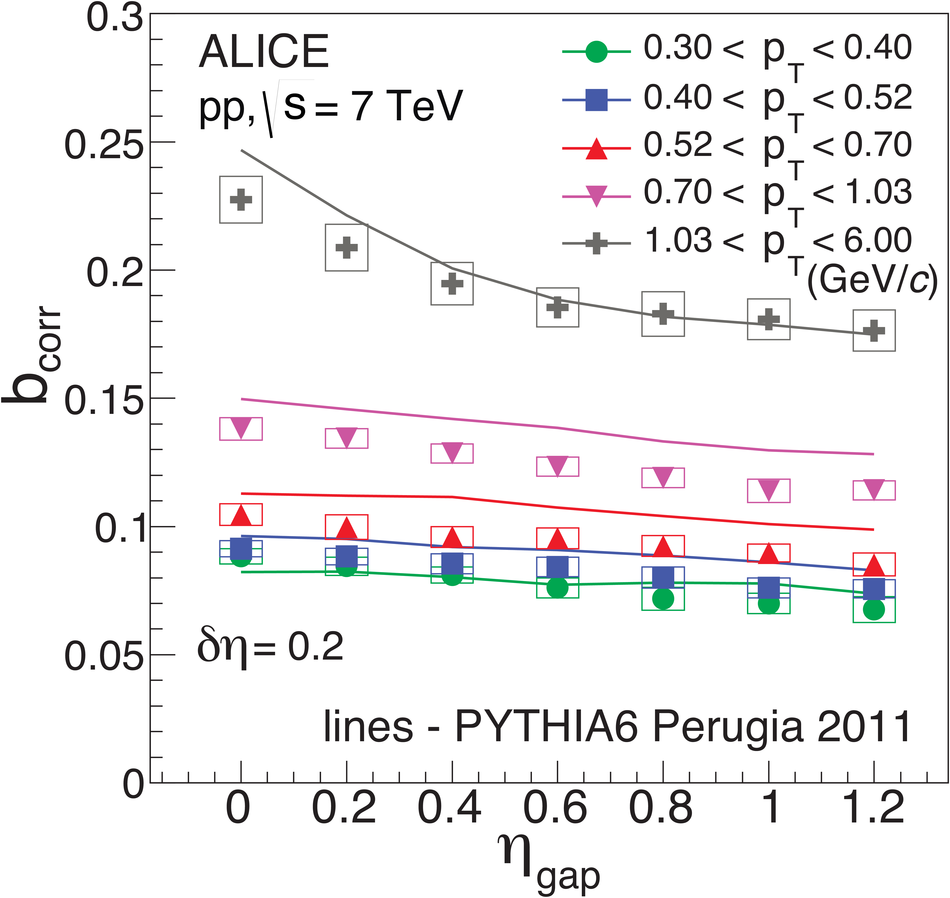 |
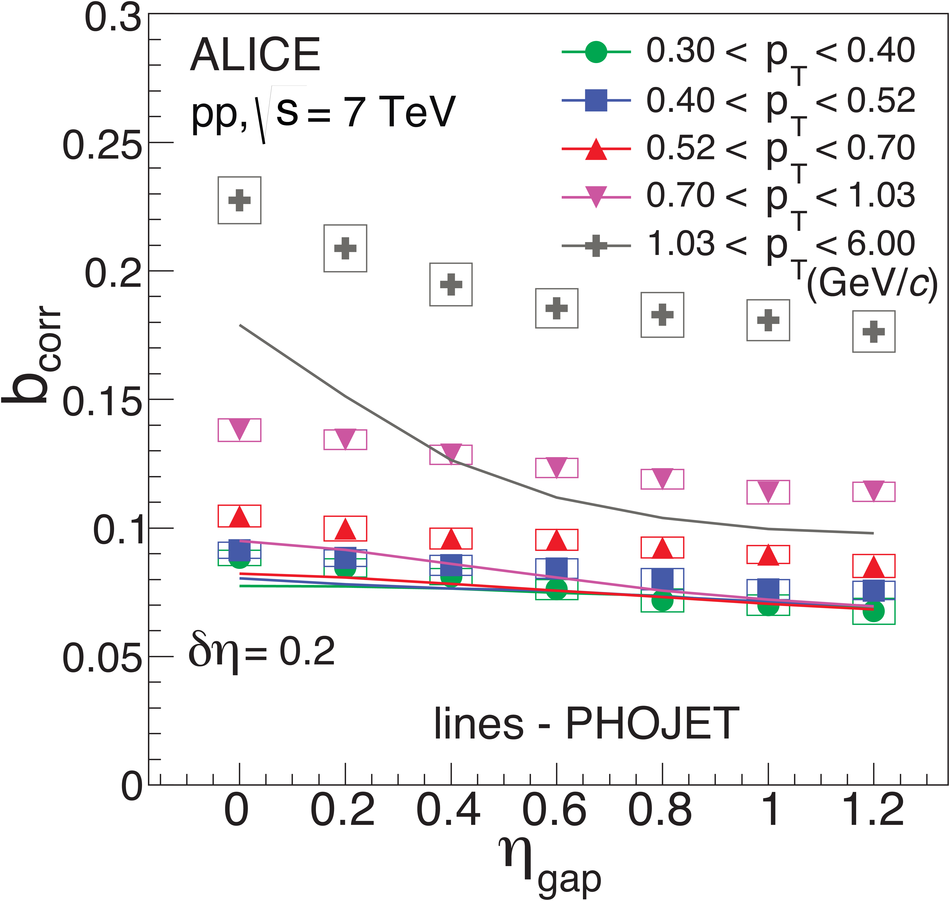
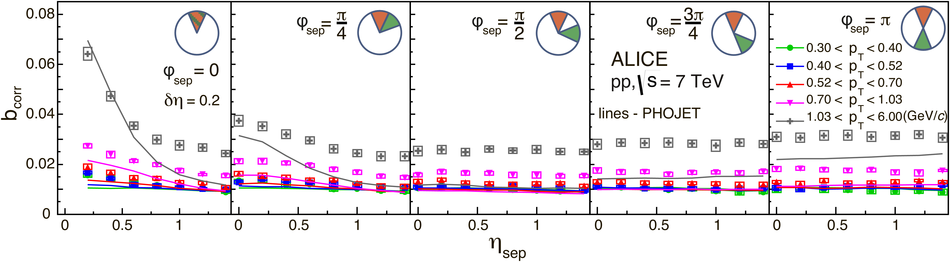
Figure 14
Correlation strength $b_{corr}$ at $\sqrt{s}=7$ TeV for separated $\eta$-$\varphi$ windows in different $\pt$ intervals with same $\langle \rm n_{\rm ch}\rangle$. Five $\phi_{sep}$ values are shown as a function of $\eta_{sep}$. Windows of $\delta\eta$=0.2 and $\dphi$=$\pi$/4. Top and bottom panels contain the same experimental data, lines correspond to PYTHIA6 Perugia 2011 .top) andto PHOJET (bottom) | 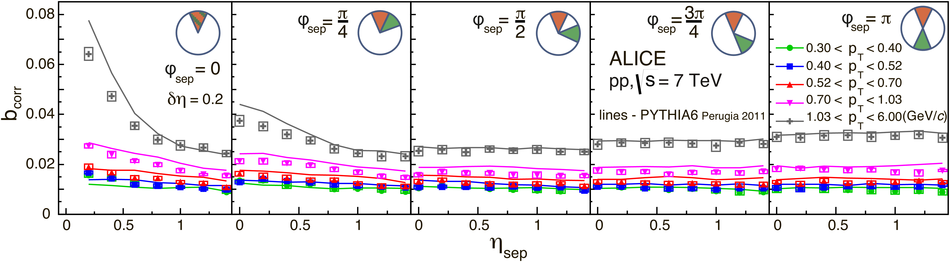 |