The measurement of the deuteron and anti-deuteron production in the rapidity range $-1 <~ y <~ 0$ as a function of transverse momentum and event multiplicity in p-Pb collisions at $\sqrt{s_{\rm{NN}}}$ = 5.02 TeV is presented. (Anti-)deuterons are identified via their specific energy loss $\rm{d}E/\rm{d}x$ and via their time-of-flight. Their production in p-Pb collisions is compared to pp and Pb-Pb collisions and is discussed within the context of thermal and coalescence models. The ratio of integrated yields of deuterons to protons (d/p) shows a significant increase as a function of the charged-particle multiplicity of the event starting from values similar to those observed in pp collisions at low multiplicities and approaching those observed in Pb-Pb collisions at high multiplicities. The mean transverse momenta are extracted from the deuteron spectra and the values are similar to those obtained for p and $\Lambda$ particles. Thus, deuteron spectra do not follow mass ordering. This behaviour is in contrast to the trend observed for non-composite particles in p-Pb collisions. In addition, the production of the rare $^{3}{\rm{He}}$ and $^{3}\bar{\rm He}$ nuclei has been studied. The spectrum corresponding to all non-single diffractive p-Pb collisions is obtained in the rapidity window $-1 <~ y <~ 0$ and the $p_{\rm{T}}$-integrated yield d$N$/d$y$ is extracted. It is found that the yields of protons, deuterons, and $^{3}{\rm{He}}$, normalised by the spin degeneracy factor, follow an exponential decrease with mass number.
Phys.Lett. B800 (2020) 135043
HEP Data
e-Print: arXiv:1906.03136 | PDF | inSPIRE
CERN-EP-2019-120
Figure 1
Energy loss \dedx{} in the TPC and the corresponding expected energy loss from a parametrization of the Bethe-Bloch curve (left). Example of the fit to the squared TOF mass difference which shows separately the signal and the background from the exponential tail of protons and from mismatched tracks (right). | 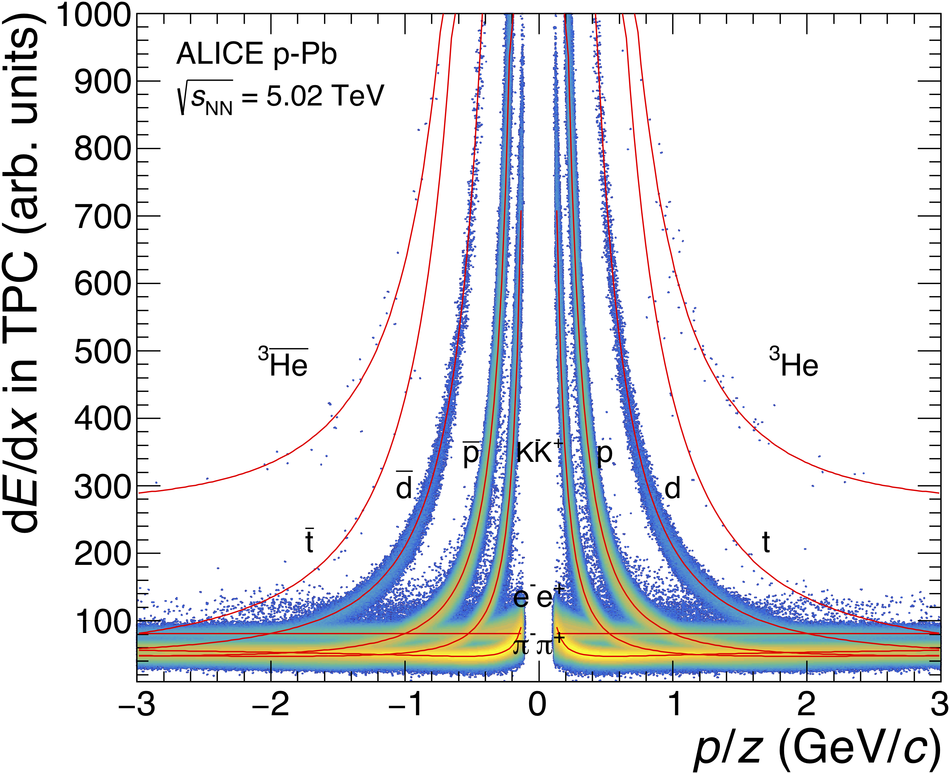 |
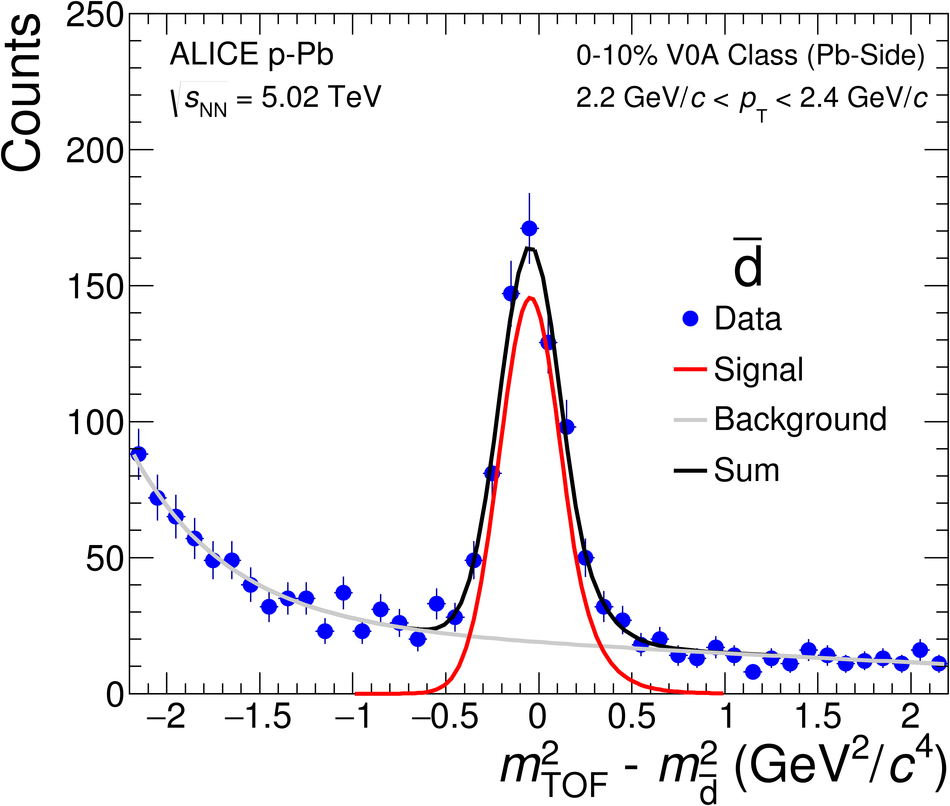

Figure 3
Transverse momentum distributions of deuterons (left) and anti-deuterons (right) for various multiplicity classes. The multiplicity class definition is based on the signal amplitude observed in the V0A detector located on the Pb-side. The vertical bars represent the statistical errors, the empty boxes show the systematic uncertainty. The lines represent individual fits using a $m_{\rm T}$-exponential function. | 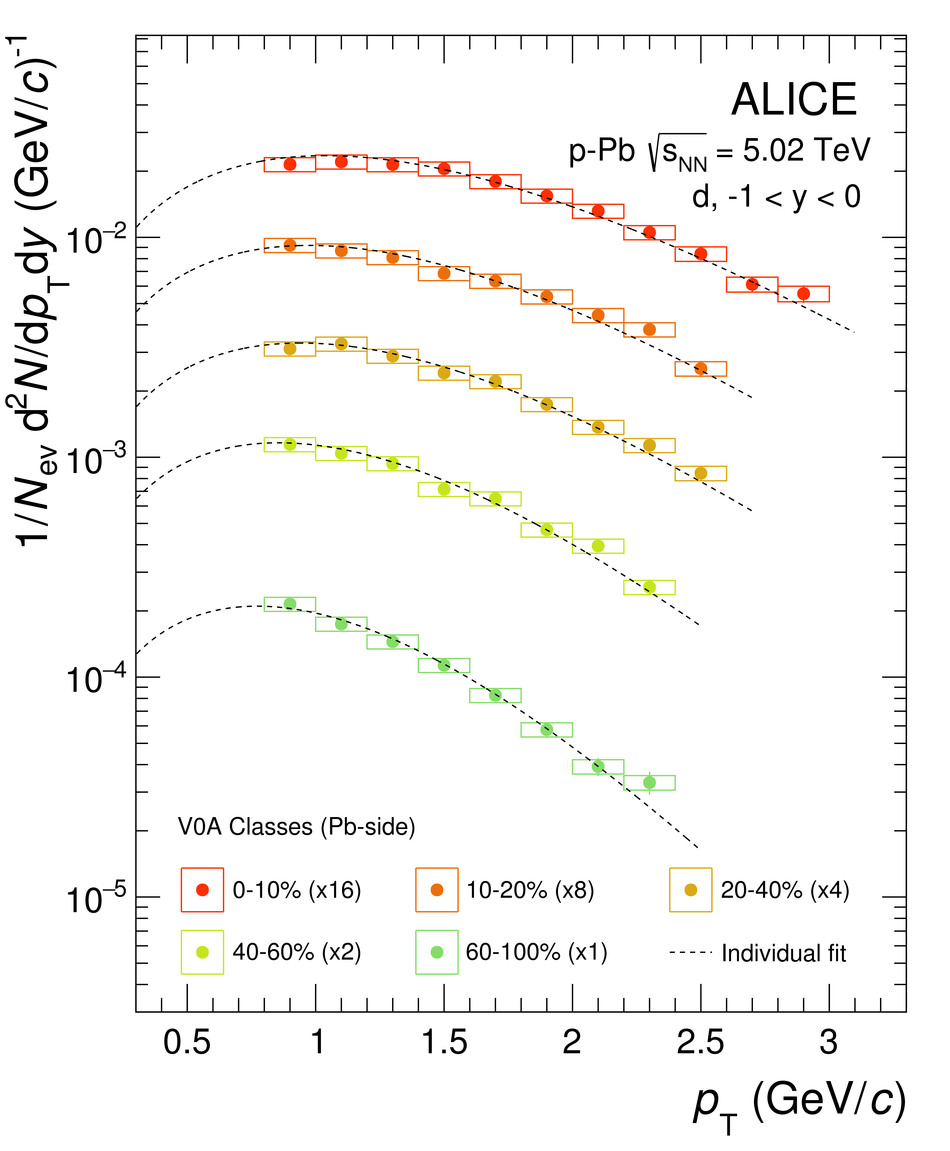 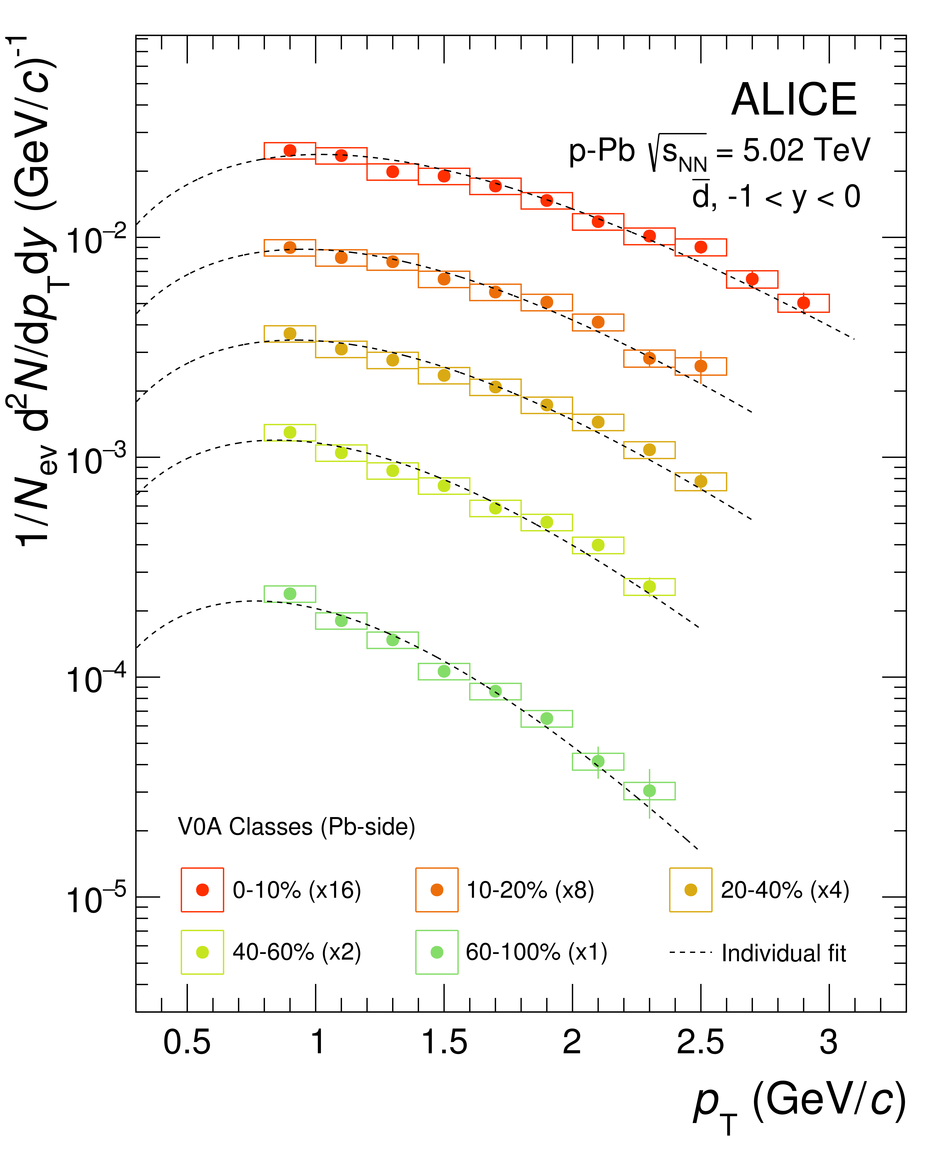 |
Figure 5
Transverse momentum distribution of \he{} and $^{3}\overline{\rm He}$ for all NSD collisions ($N_{\mathrm{NSD}}$). The vertical bars represent the statistical errors while the empty boxes show the total systematic uncertainty The line represents a $\chi^2$ fit with a $m_{\rm T}$-exponential function (see text for details). | 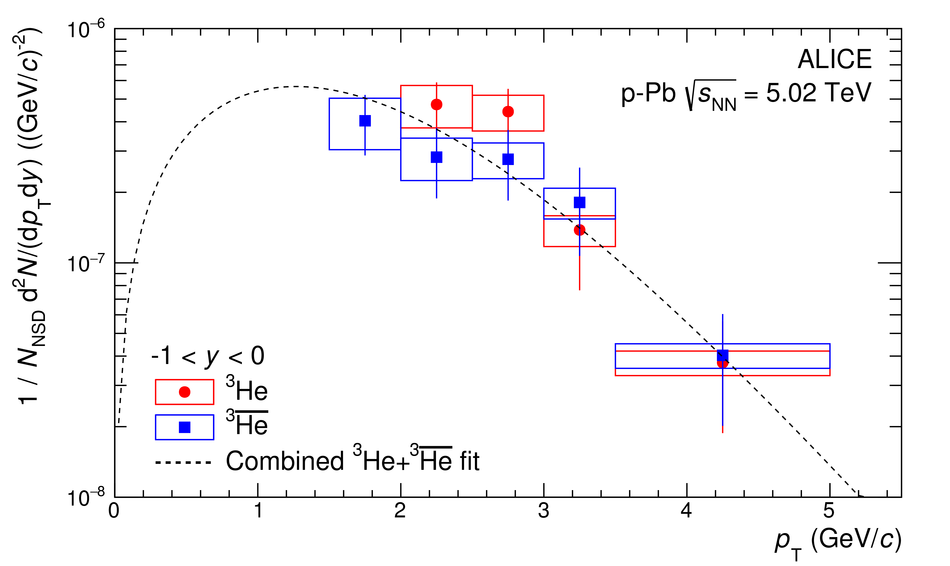 |
Figure 6
Production yield $\ensuremath{\mathrm{d}N/\mathrm{d}y}$ normalised by the spin degeneracy as a function of the mass number for inelastic pp collisions, minimum-bias p-Pb and central Pb-Pb collisions . The empty boxes represent the total systematic uncertainty while the statistical errors are shown by the vertical bars. The lines represent fits with an exponential function. | 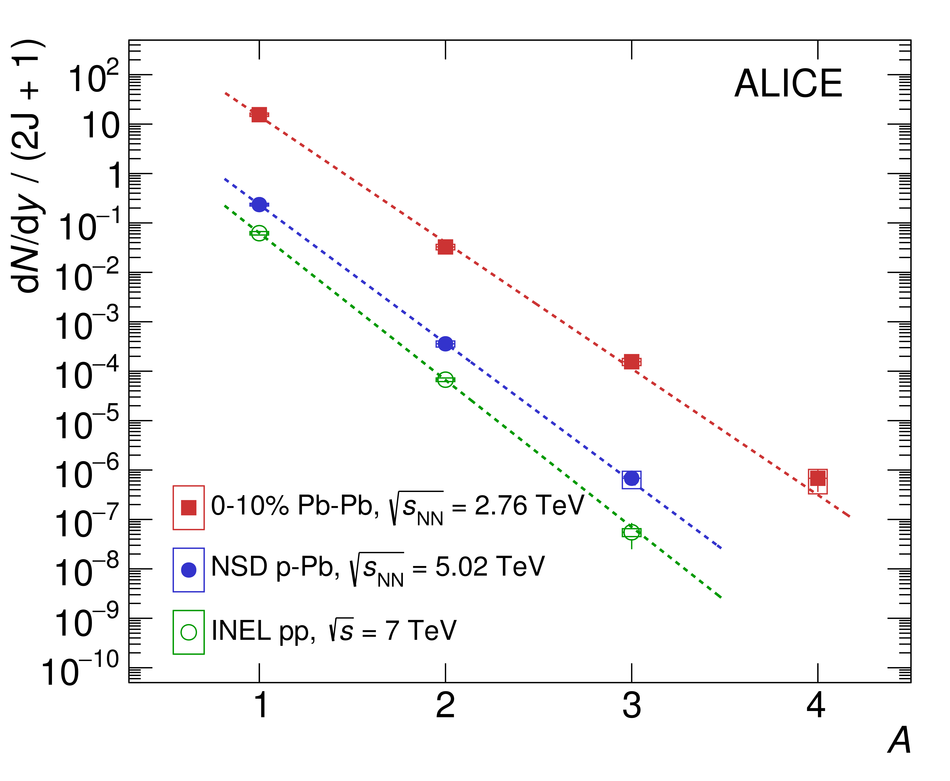 |
Figure 8
Mean \PT{} of various particle species as a function of the mean charged-particle density at mid-rapidity for different V0A multiplicity classes. The empty boxes show the total systematic uncertainty while the shaded boxes indicate the contribution which is uncorrelated across multiplicity intervals (left). Comparison of \avpT{} of protons and deuterons with the simple coalescence and the Blast-Wave model expectations. The shaded areas show the expected \avpT{} for deuterons from a simple coalescence model assuming a \PT-independent \Btwo{} as well as the calculated \avpT{} for protons and deuterons from the Blast-Wave model using the kinetic freeze-out parameters for pions, kaons, protons and $\Lambda$ from (right). |  |