This paper reports the first measurement of the transverse momentum ($p_{\mathrm{T}}$) spectra of primary charged pions, kaons, (anti)protons, and unidentified particles as a function of the charged-particle flattenicity in pp collisions at $\sqrt{s}=13$ TeV. Flattenicity is a novel event shape observable that is measured in the pseudorapidity intervals covered by the V0 detector, $2.8<~\eta<~5.1$ and $-3.7<~\eta<~-1.7$. According to QCD-inspired phenomenological models, it shows sensitivity to multiparton interactions and is less affected by biases toward larger $p_{\mathrm{T}}$ due to local multiplicity fluctuations in the V0 acceptance than multiplicity. The analysis is performed in minimum-bias (MB) as well as in high-multiplicity events up to $p_{\mathrm{T}}=20$ GeV/$c$. The event selection requires at least one charged particle produced in the pseudorapidity interval $|\eta|<~1$. The measured $p_{\mathrm{T}}$ distributions, average $p_{\mathrm{T}}$, kaon-to-pion and proton-to-pion particle ratios, presented in this paper, are compared to model calculations using PYTHIA 8 based on color strings and EPOS LHC. The modification of the $p_{\mathrm{T}}$-spectral shapes in low-flattenicity events that have large event activity with respect to those measured in MB events develops a pronounced peak at intermediate $p_{\mathrm{T}}$ ($2<~p_{\mathrm{T}}<~8$ GeV/$c$), and approaches the vicinity of unity at higher $p_{\mathrm{T}}$. The results are qualitatively described by PYTHIA, and they show different behavior than those measured as a function of charged-particle multiplicity based on the V0M estimator.
Phys. Rev. D 111, 012010 (2025)
HEP Data
e-Print: arXiv:2407.20037 | PDF | inSPIRE
CERN-EP-2024-205
Figure group
Figure 1
Ratios of parton yields for the events with the 0-1% highest activity according to various event activity measures to that without any event selection as a function of the parton transverse momentum (${\hat p}_{\rm T}$). The results are for pp collisions at $\sqrt{s} = 13$ TeV simulated with PYTHIA 8 Monash 2013 tune. | 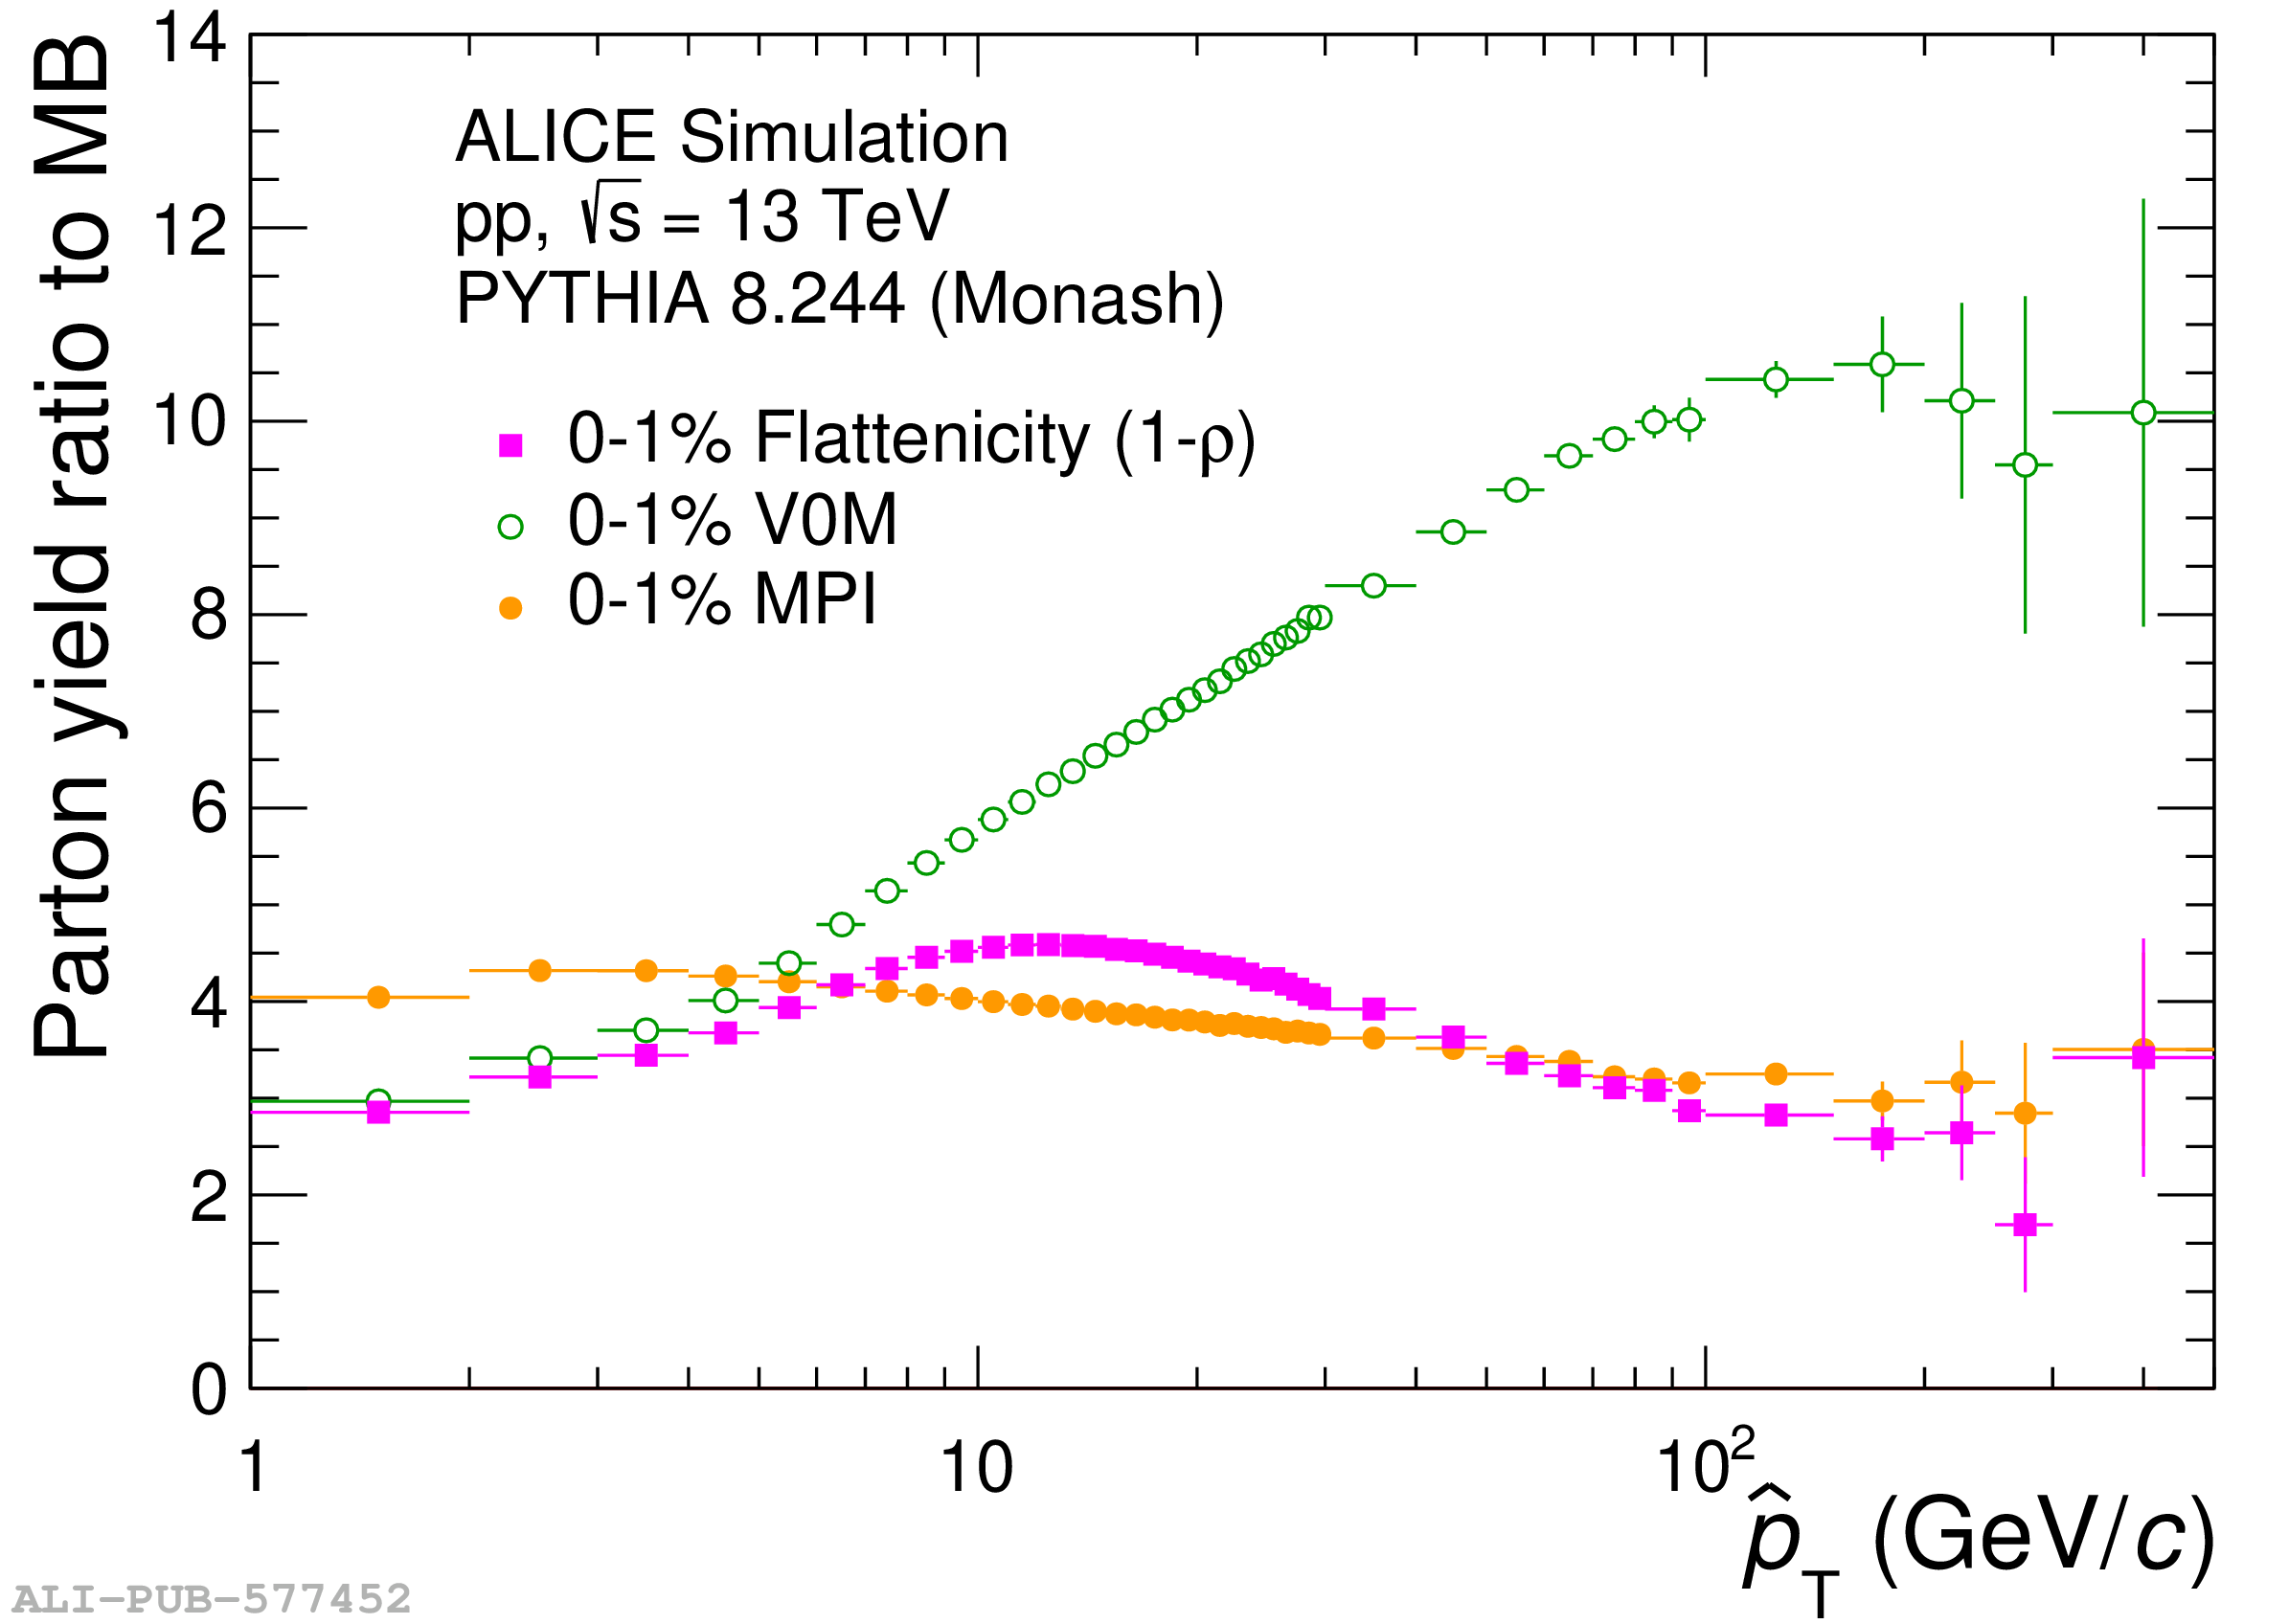 |
Figure 2
The $Q_{\rm pp}$ ratio of $\pi$, K, p, and h$^\pm$ for the 0-1% and 50-100% flattenicity $(1 - \rho)$ event classes (top row), and for HM events (0-1% V0M) in the same $(1 - \rho)$ event classes (bottom row) simulated using PYTHIA 8 with and without CR. There is a $|y|< 0.8$ ($|\eta|< 0.8$) cut in the rapidity (pseudorapidty) of identified (unidentified) particles. The shaded bands around the lines represent the statistical uncertainty. | 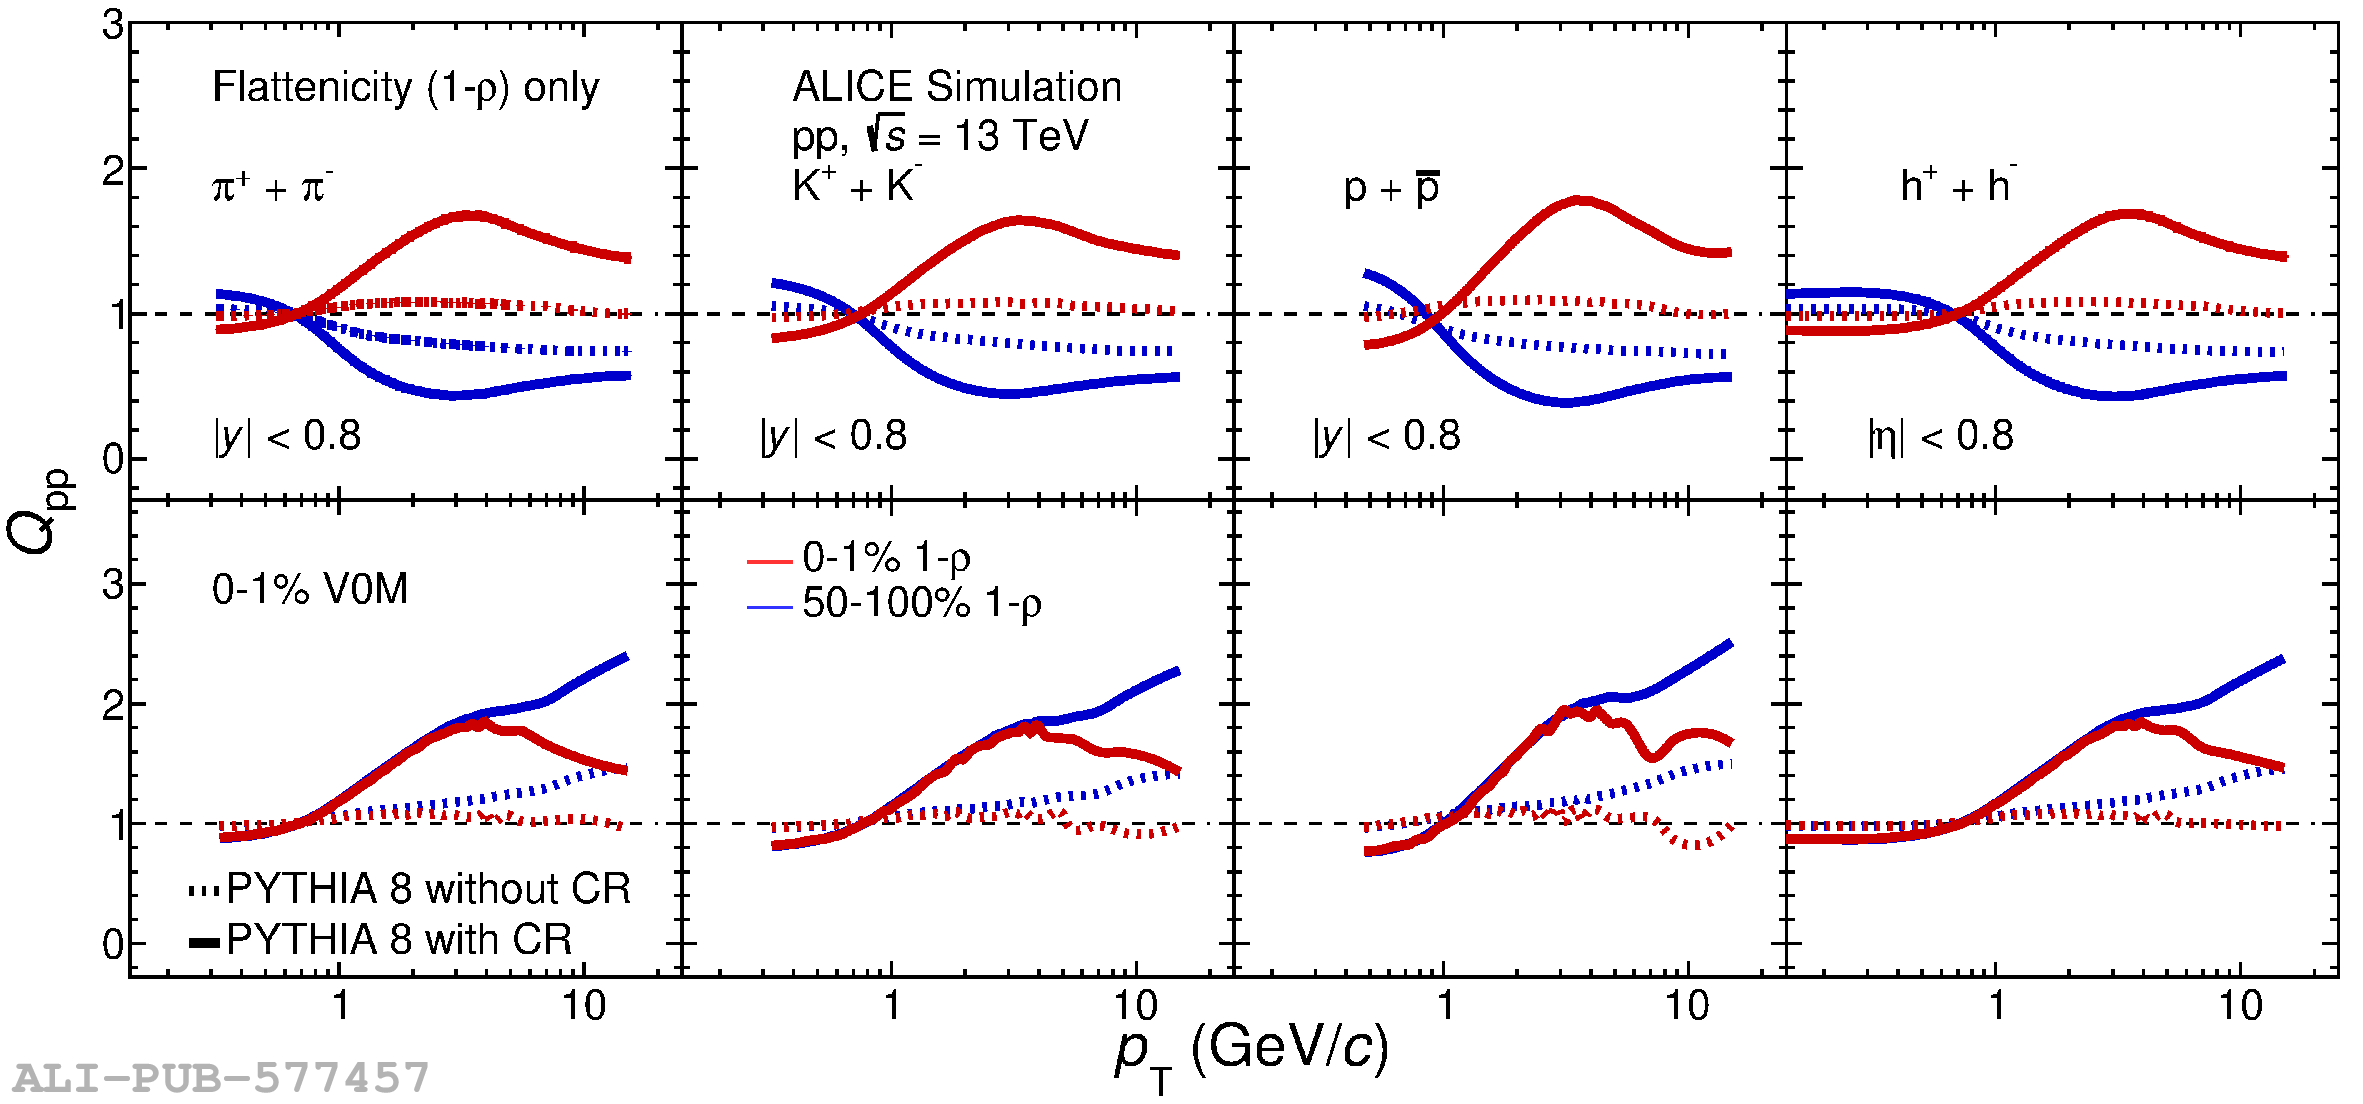 |
Figure 4
Transverse momentum ($p_{\rm T}$) spectra of $\pi^{\pm}$, $\mathrm{K}^{\pm}$, $(\overline{\mathrm{p}})\mathrm{p}$, and $\rm{h}^{\pm}$ for different flattenicity event classes (top panels), and for HM events (0--1\% V0M) in the same flattenicity event classes (bottom panels). The spectra are scaled by powers of ten for better visibility. The yield of identified and unidentified particles is reported as a function of rapidity and pseudorapidity, respectively. The bottom panels in each figure show the $Q_{\rm pp}$ for the corresponding event classes. The statistical, total, and uncorrelated systematic uncertainties are represented with bars, boxes, and shaded areas around the data points, respectively. The flattenicity-integrated $Q_{\rm pp}$ values are taken from Refs. . |   |
Figure 5
The $Q_{\rm pp}$ ratio of $\pi$, K, p, and h$^\pm$ for the 0-1% and 50-100% $(1 - \rho)$ classes (top row) and for the same $(1 - \rho)$ classes in HM (0-1% V0M class) events (bottom row). The data are compared with PYTHIA 8 and EPOS LHC model predictions. The statistical and systematic uncertainties are represented with bars and shaded areas. |  |
Figure 6
The $p_{\rm T}$-differential proton-to-pion (top row) and kaon-to-pion (bottom row) particle ratios for two extremes of flattenicity event classes, as indicated in the legends, are shown. Left and right columns include results for multiplicity-integrated and 0-1% V0M event classes. The statistical, total, and uncorrelated systematic uncertainties are represented with bars, boxes, and shaded areas around the data points, respectively. The shaded regions around the model line represent the statistical uncertainties. |  |
Figure 7
Top panels: Transverse momentum-integrated particle ratios as a function of the average charged-particle density, and predictions using the PYTHIA 8 and EPOS LHC models. The model calculations and fits (shown with the red dashed lines) correspond to the flattenicity-dependent measurements. The fit uses the $a-b/(c-x)$ parameterization, where $a,b$, and $c$ are free fit parameters. Bottom panels: Data-to-fit ratios for both the flattenicity- and multiplicity-dependent measurements. The multiplicity-dependent results are taken from Ref. . The statistical and systematic uncertainties are shown with lines and empty boxes. |   |
Figure 8
Top panels: Average transverse momentum as a function of the average charged-particle density, and predictions using the PYTHIA 8 and EPOS LHC models. The model calculations and fits (shown with the red dashed lines) correspond to the flattenicity-dependent measurements. The fit uses the $a-b\times(c-x)^{-1}$ parameterization, where $a,b$, and $c$ are free fit parameters. Bottom panels: Data-to-fit ratios for both the flattenicity- and multiplicity-dependent measurements. The multiplicity-dependent results are taken from Ref. . The statistical and systematic uncertainties are shown with lines and empty boxes. |  |