The production cross section of inclusive isolated photons has been measured by the ALICE experiment at the CERN LHC in pp collisions at centre-of-momentum energy of $\sqrt{s}=13$ TeV collected during the LHC Run 2 data-taking period. The measurement is performed by combining the measurements of the electromagnetic calorimeter EMCal and the central tracking detectors ITS and TPC, covering a pseudorapidity range of $|\eta^{\gamma}|<~0.67$ and a transverse momentum range of $7<~p_{\rm T}^{\gamma}<~200$ GeV/$c$. The result extends to lower $p_{\rm T}^{\gamma}$ and $x_{\rm T}^{\gamma} = 2p_{\rm T}^{\gamma}/\sqrt{s}$ ranges, the lowest $x_{\rm T}^{\gamma}$ of any isolated photon measurements to date, extending significantly those measured by the ATLAS and CMS experiments towards lower $p_{\rm T}^{\gamma}$ at the same collision energy with a small overlap between the measurements. The measurement is compared with next-to-leading order perturbative QCD calculations and the results from the ATLAS and CMS experiments as well as with measurements at other collision energies. The measurement and theory prediction are in agreement with each other within the experimental and theoretical uncertainties.
Eur. Phys. J. C 85 (2025) 98
HEP Data
e-Print: arXiv:2407.01165 | PDF | inSPIRE
CERN-EP-2024-171
Figure group
Figure 1
(a) Cluster shower shape distribution $\sigma_{\rm long}^{2}$ as a function of the cluster $p_{\rm T}$ in data. The dashed lines correspond to the upper and lower selection limit values for single photon candidate clusters used in the analysis. (b) Projected shower shape distribution in two $p_{\rm T}$ intervals in data (black circles) and simulation (red crosses, PYTHIA 8 $\rm jet-jet$ and $\gamma-{\rm jet}$ events). For the simulation, the $\sigma_{\rm long}^{2}$ distribution for clusters with different particle origins are also shown as shaded areas except for prompt photons from $\gamma-{\rm jet}$ PYTHIA 8 processes that are presented with a blue histogram line. | 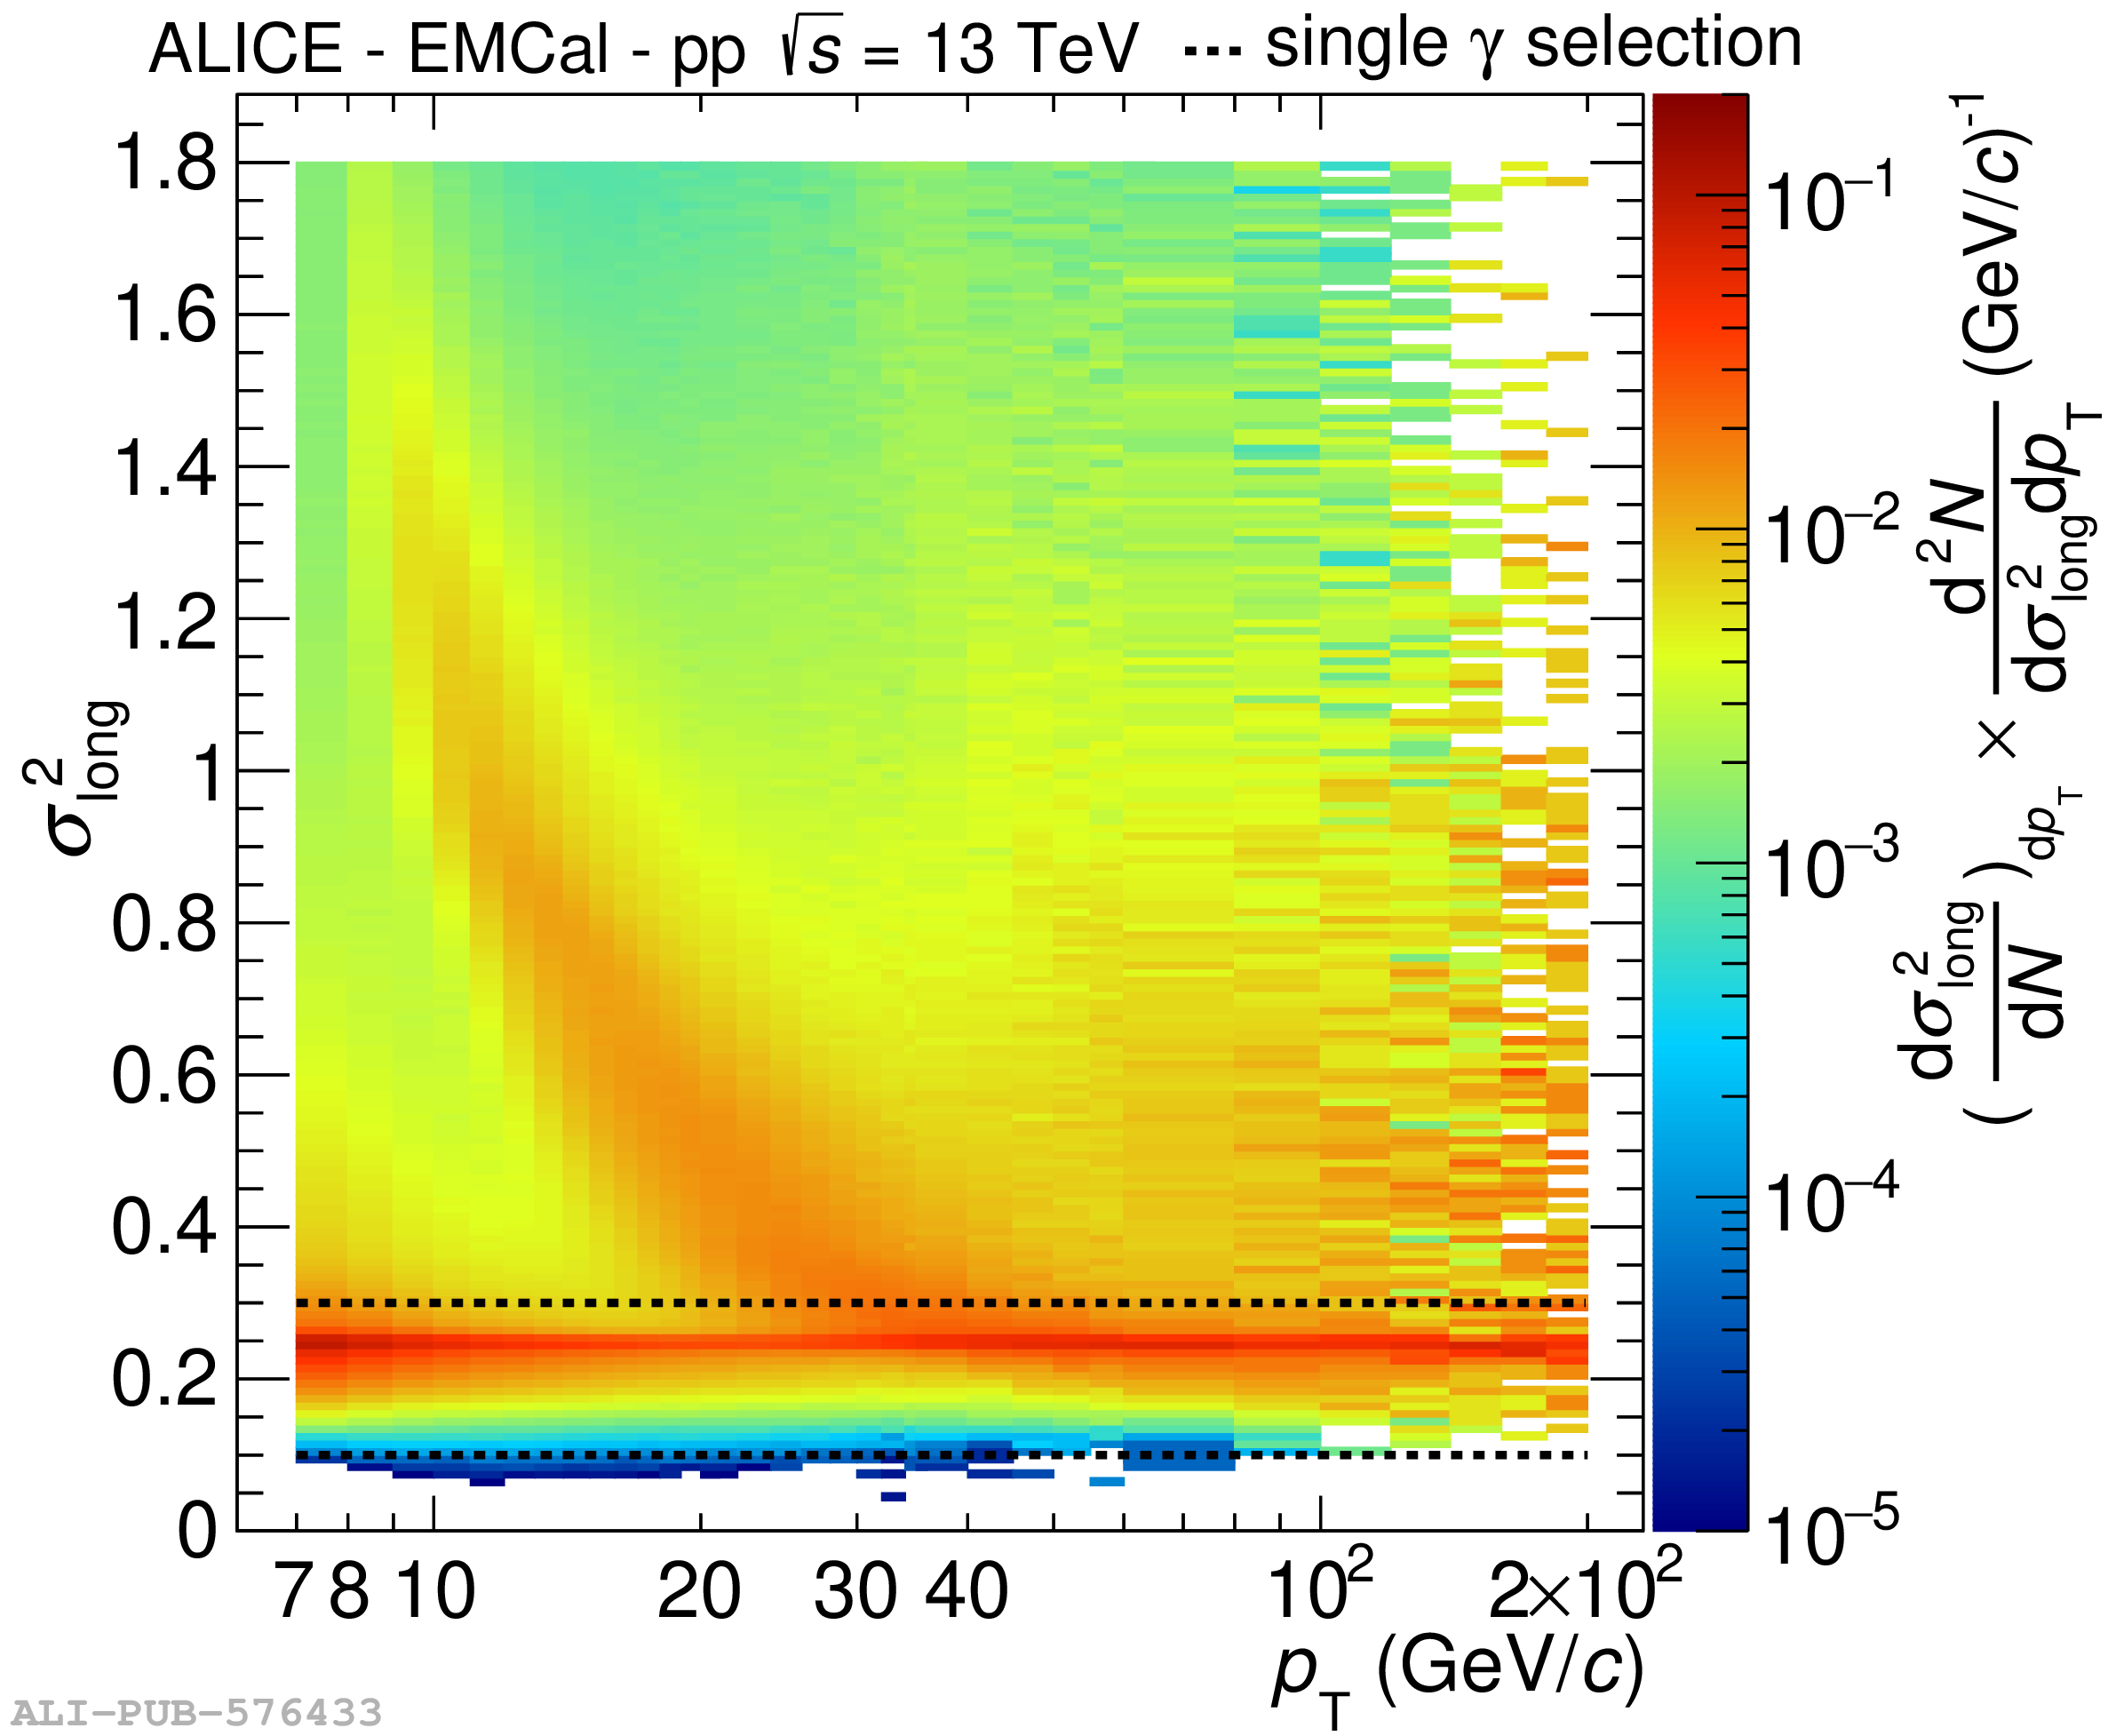 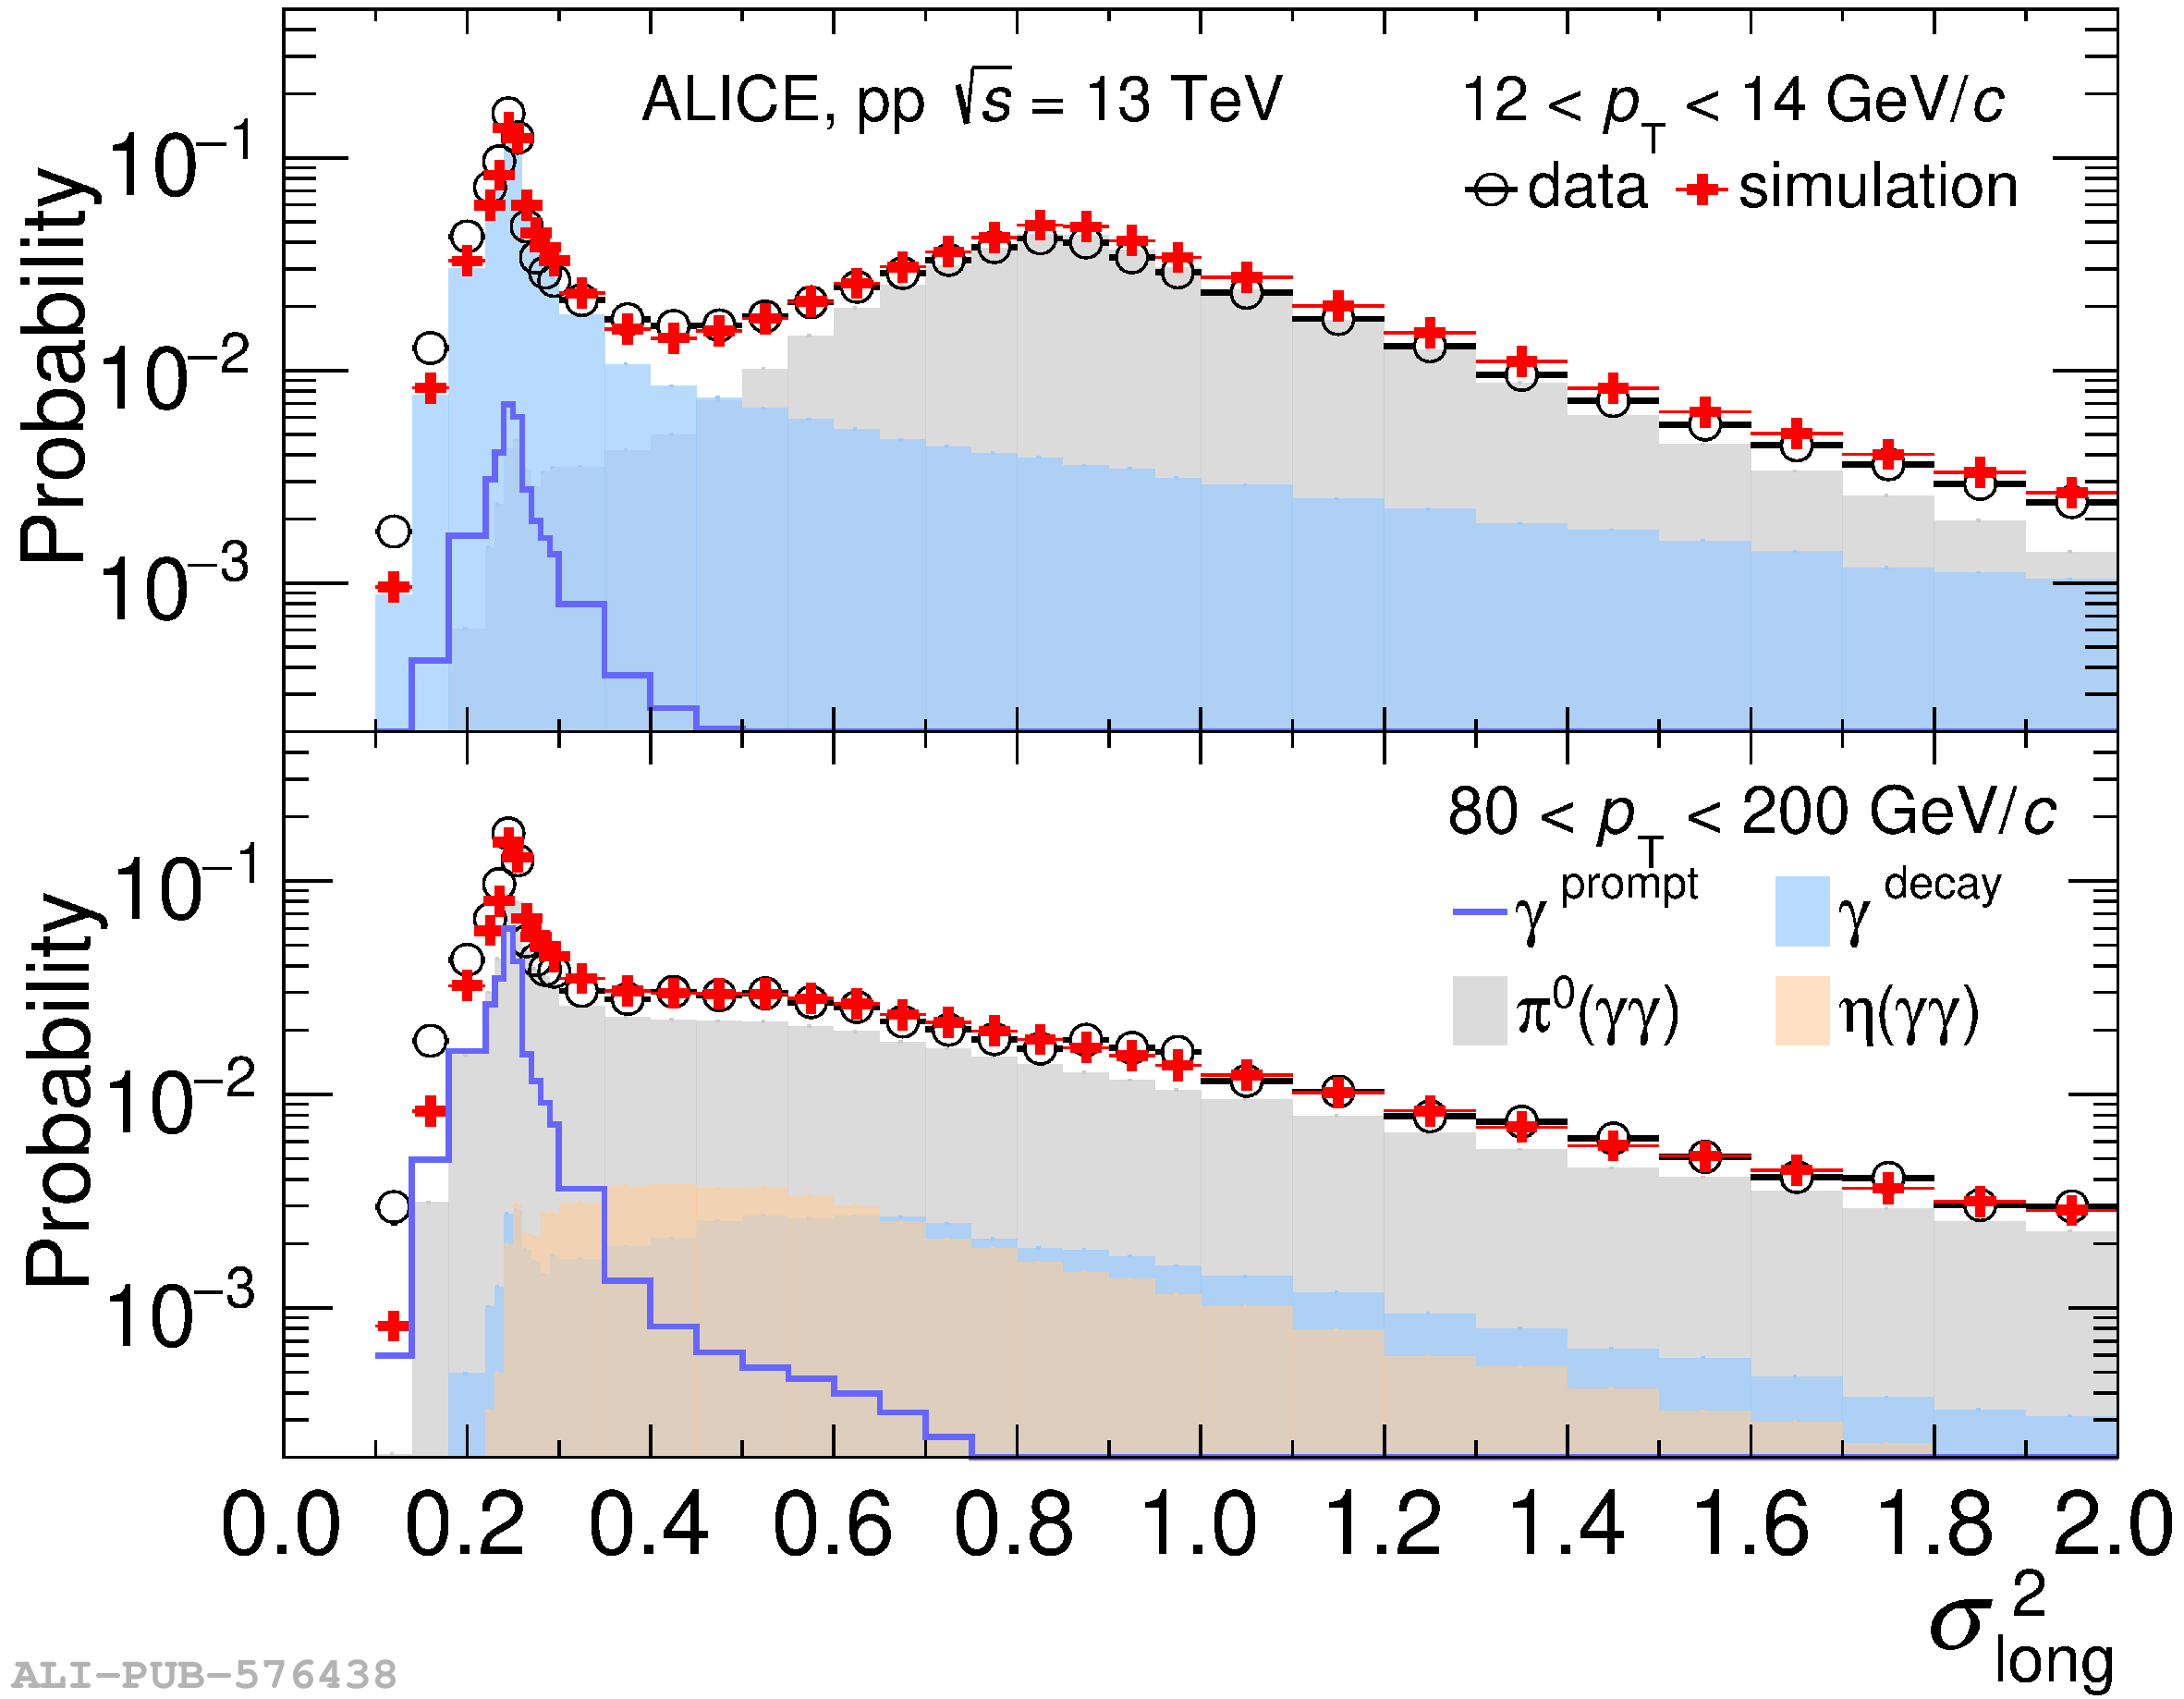 |
Figure 2
Purity of the isolated-photon sample as a function of $p_{\rm T}^{\gamma}$ calculated using Eq. (8). The statistical and systematic uncertainties have been evaluated as discussed in Sect. 4. The red and blue lines are the results of a fit to the measured purity using a two-sigmoid-function described by Eq. (11) for two different transverse momentum intervals. | 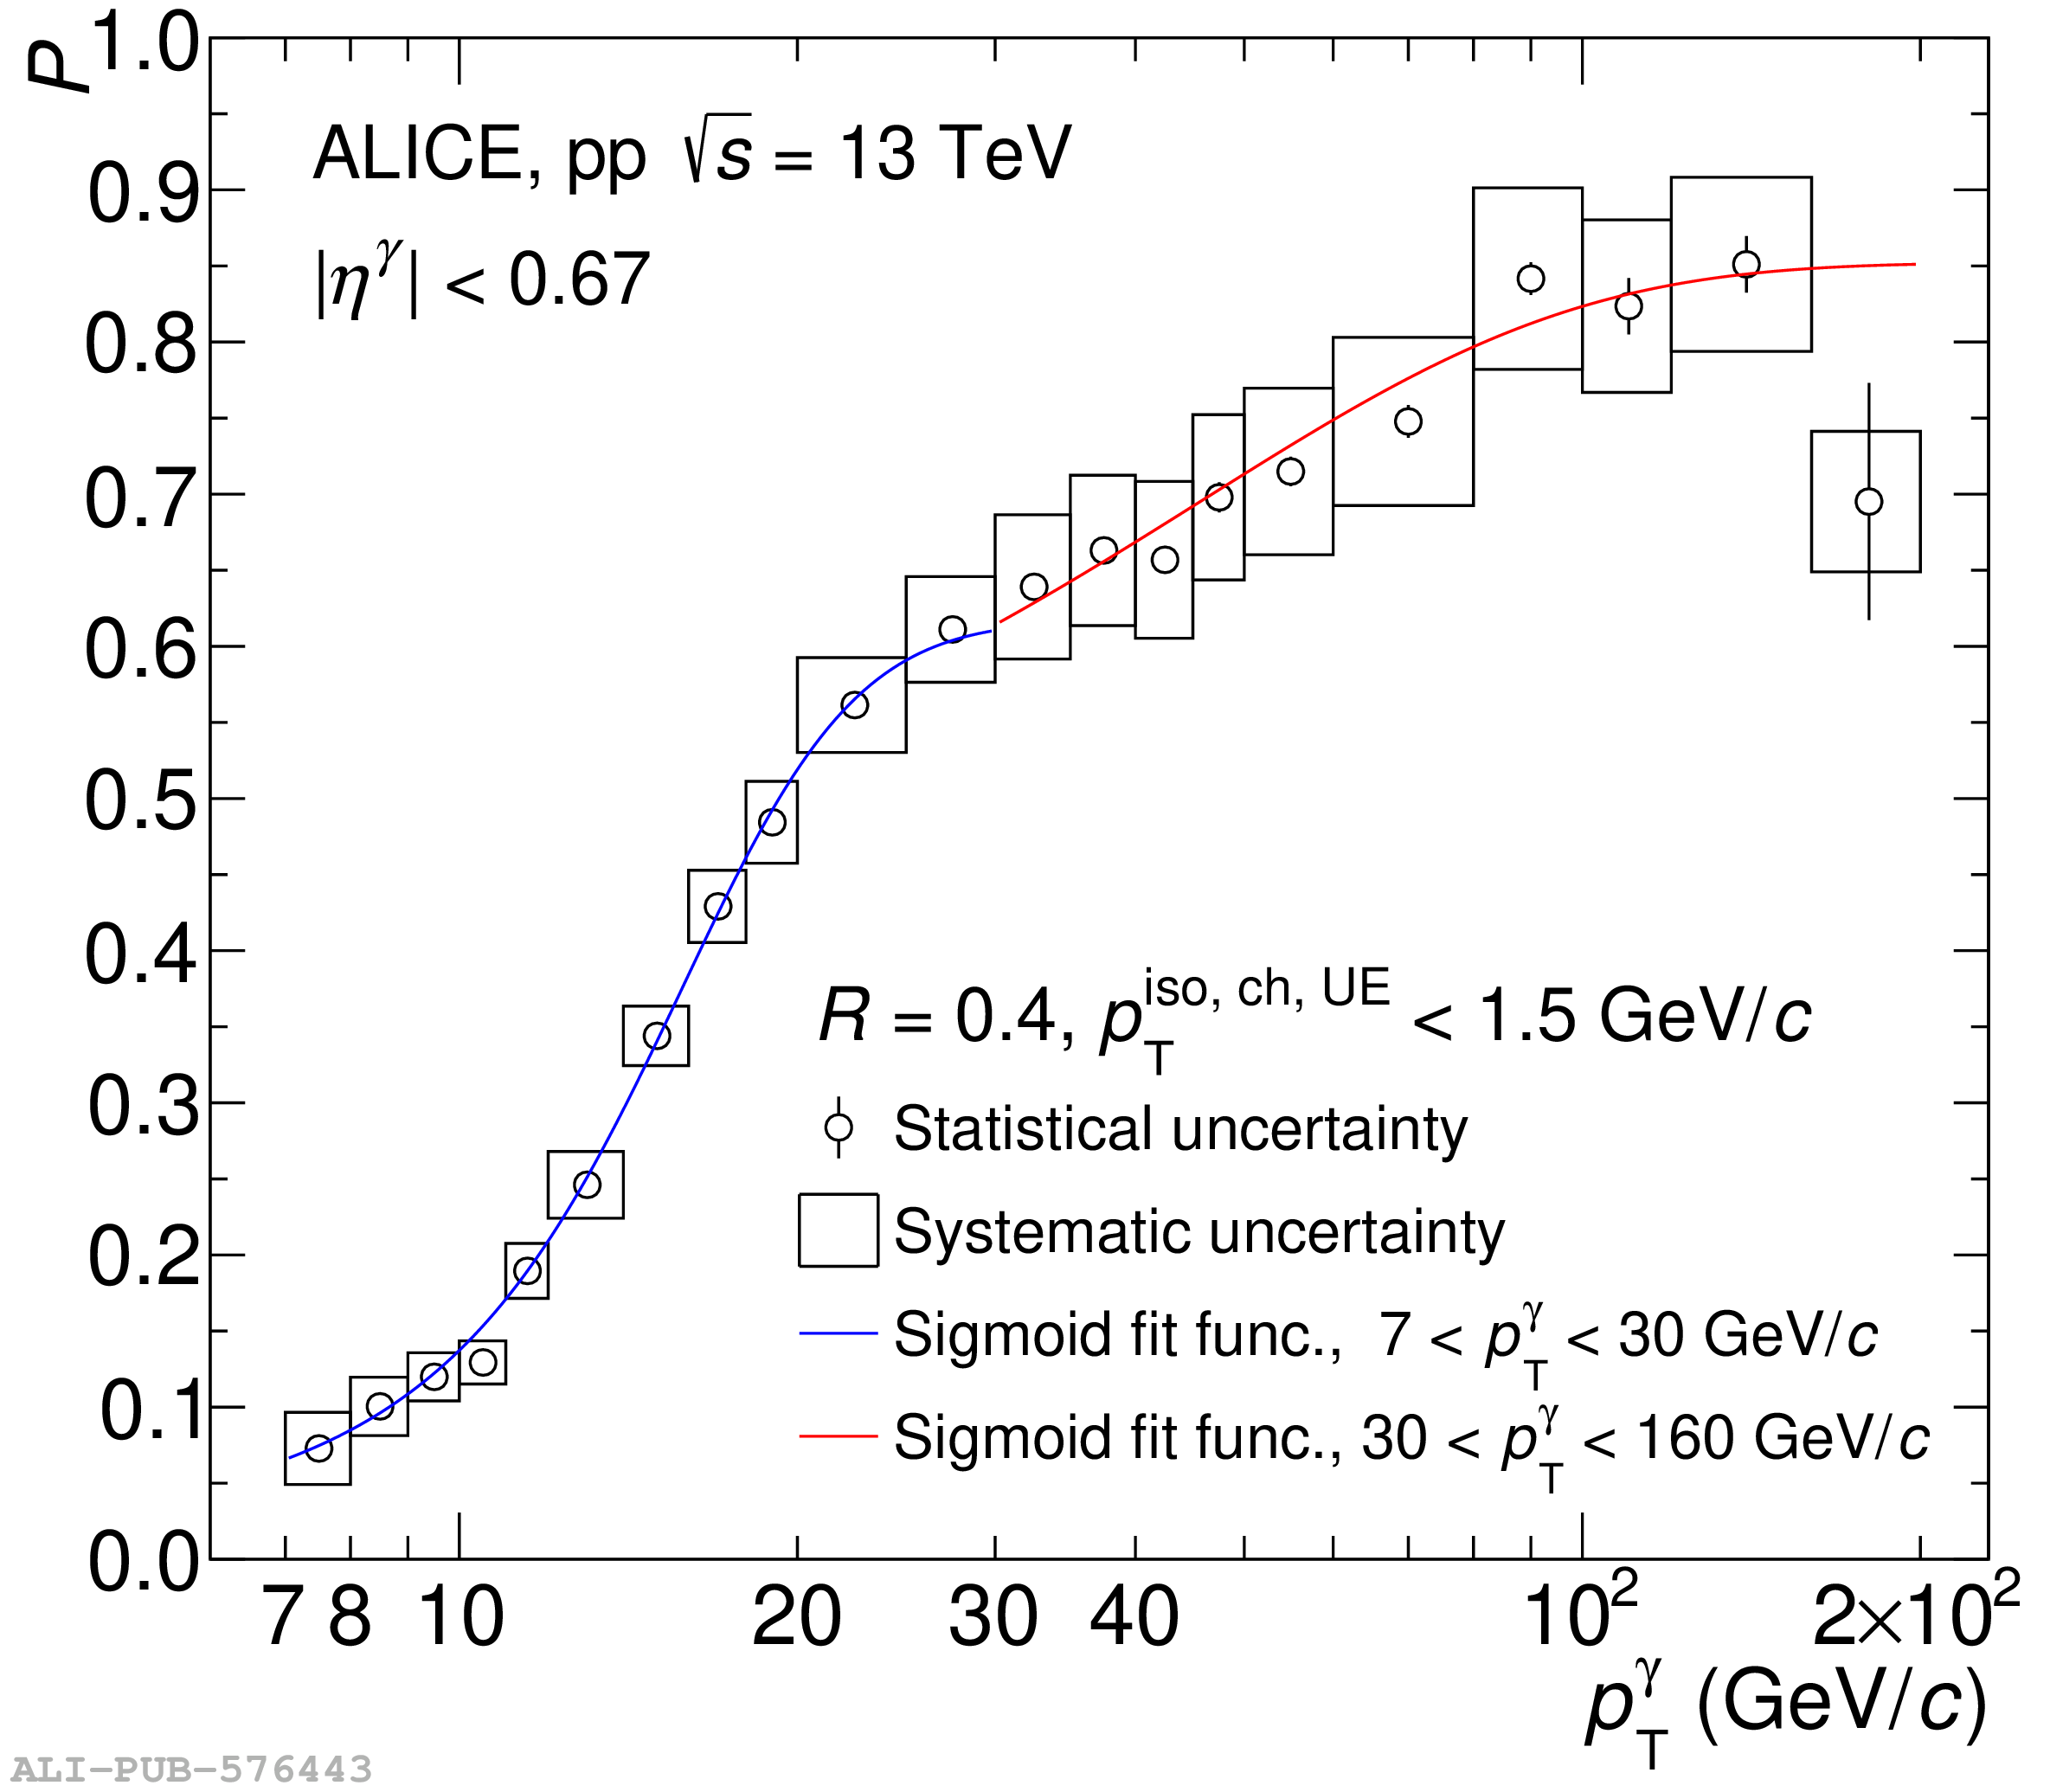 |
Figure 3
The different contributions (reconstruction, identification, isolation) and the total isolated-photon efficiency as a function of the reconstructed $p_{\rm T}^{\gamma}$ are shown in panel (a) and (b), respectively. The systematic uncertainty shown as boxes in panel (b) have been obtained from the "no MC tuning" uncertainty source discussed in Sect. 4.
| 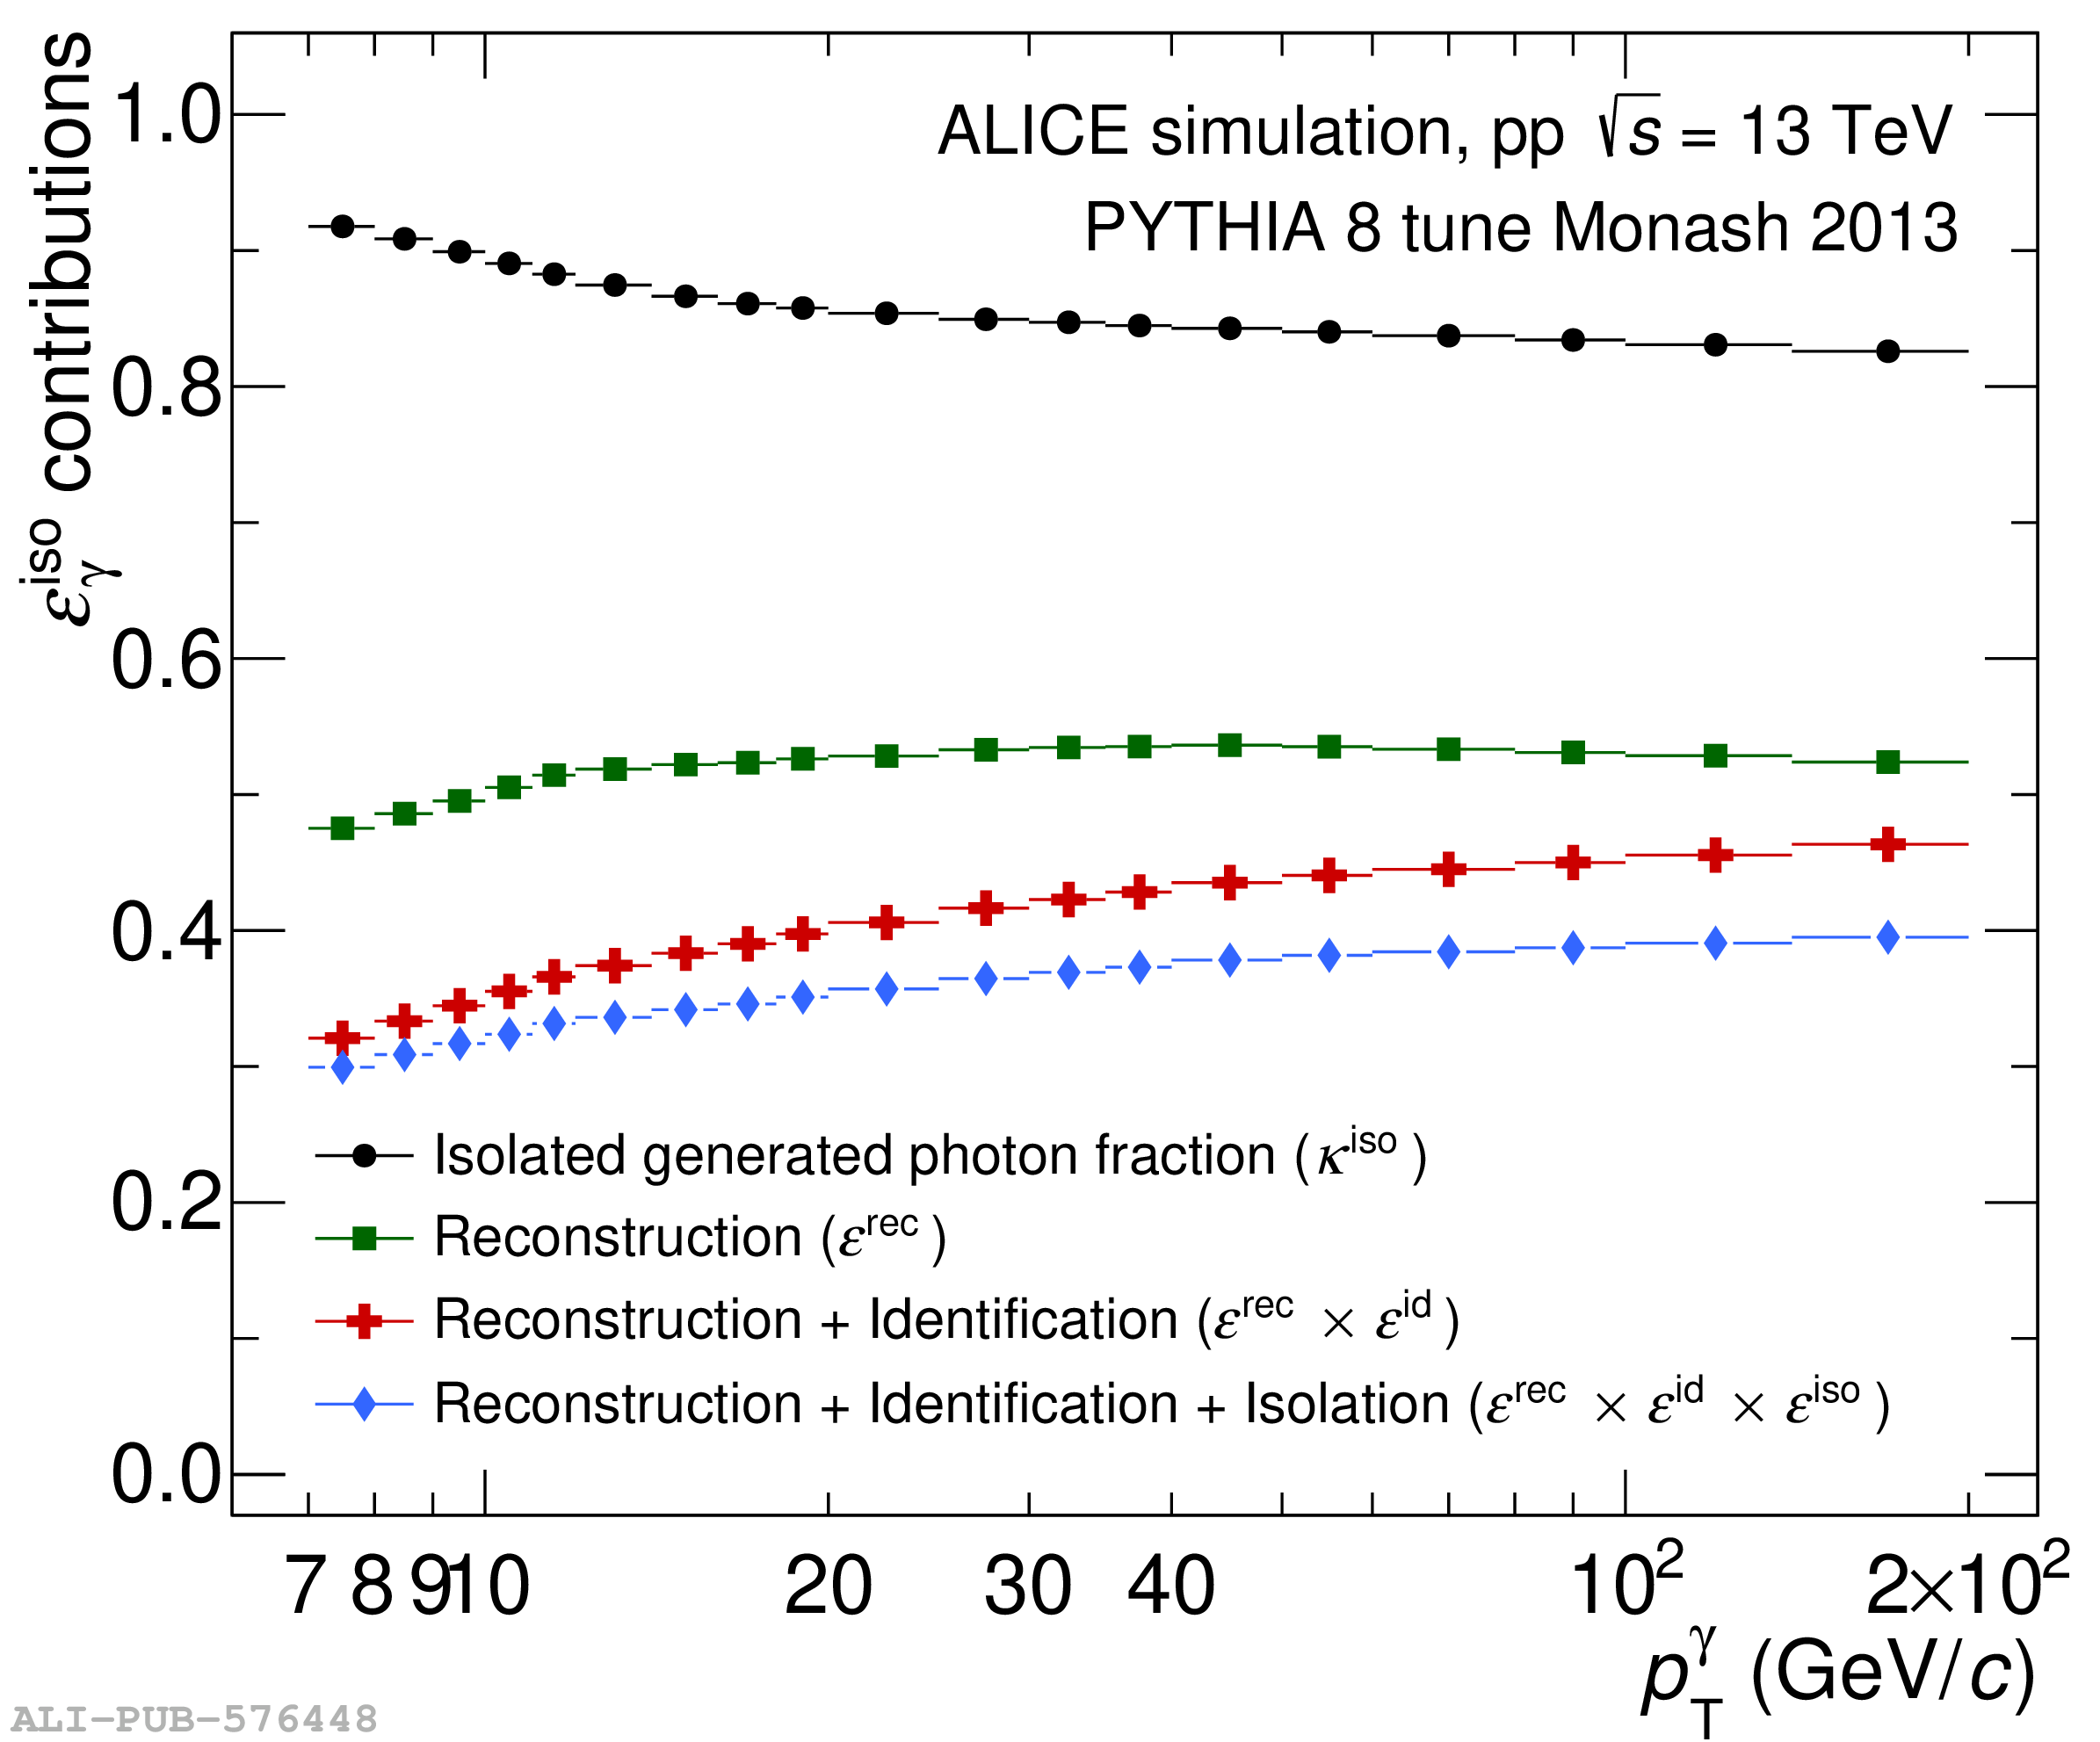 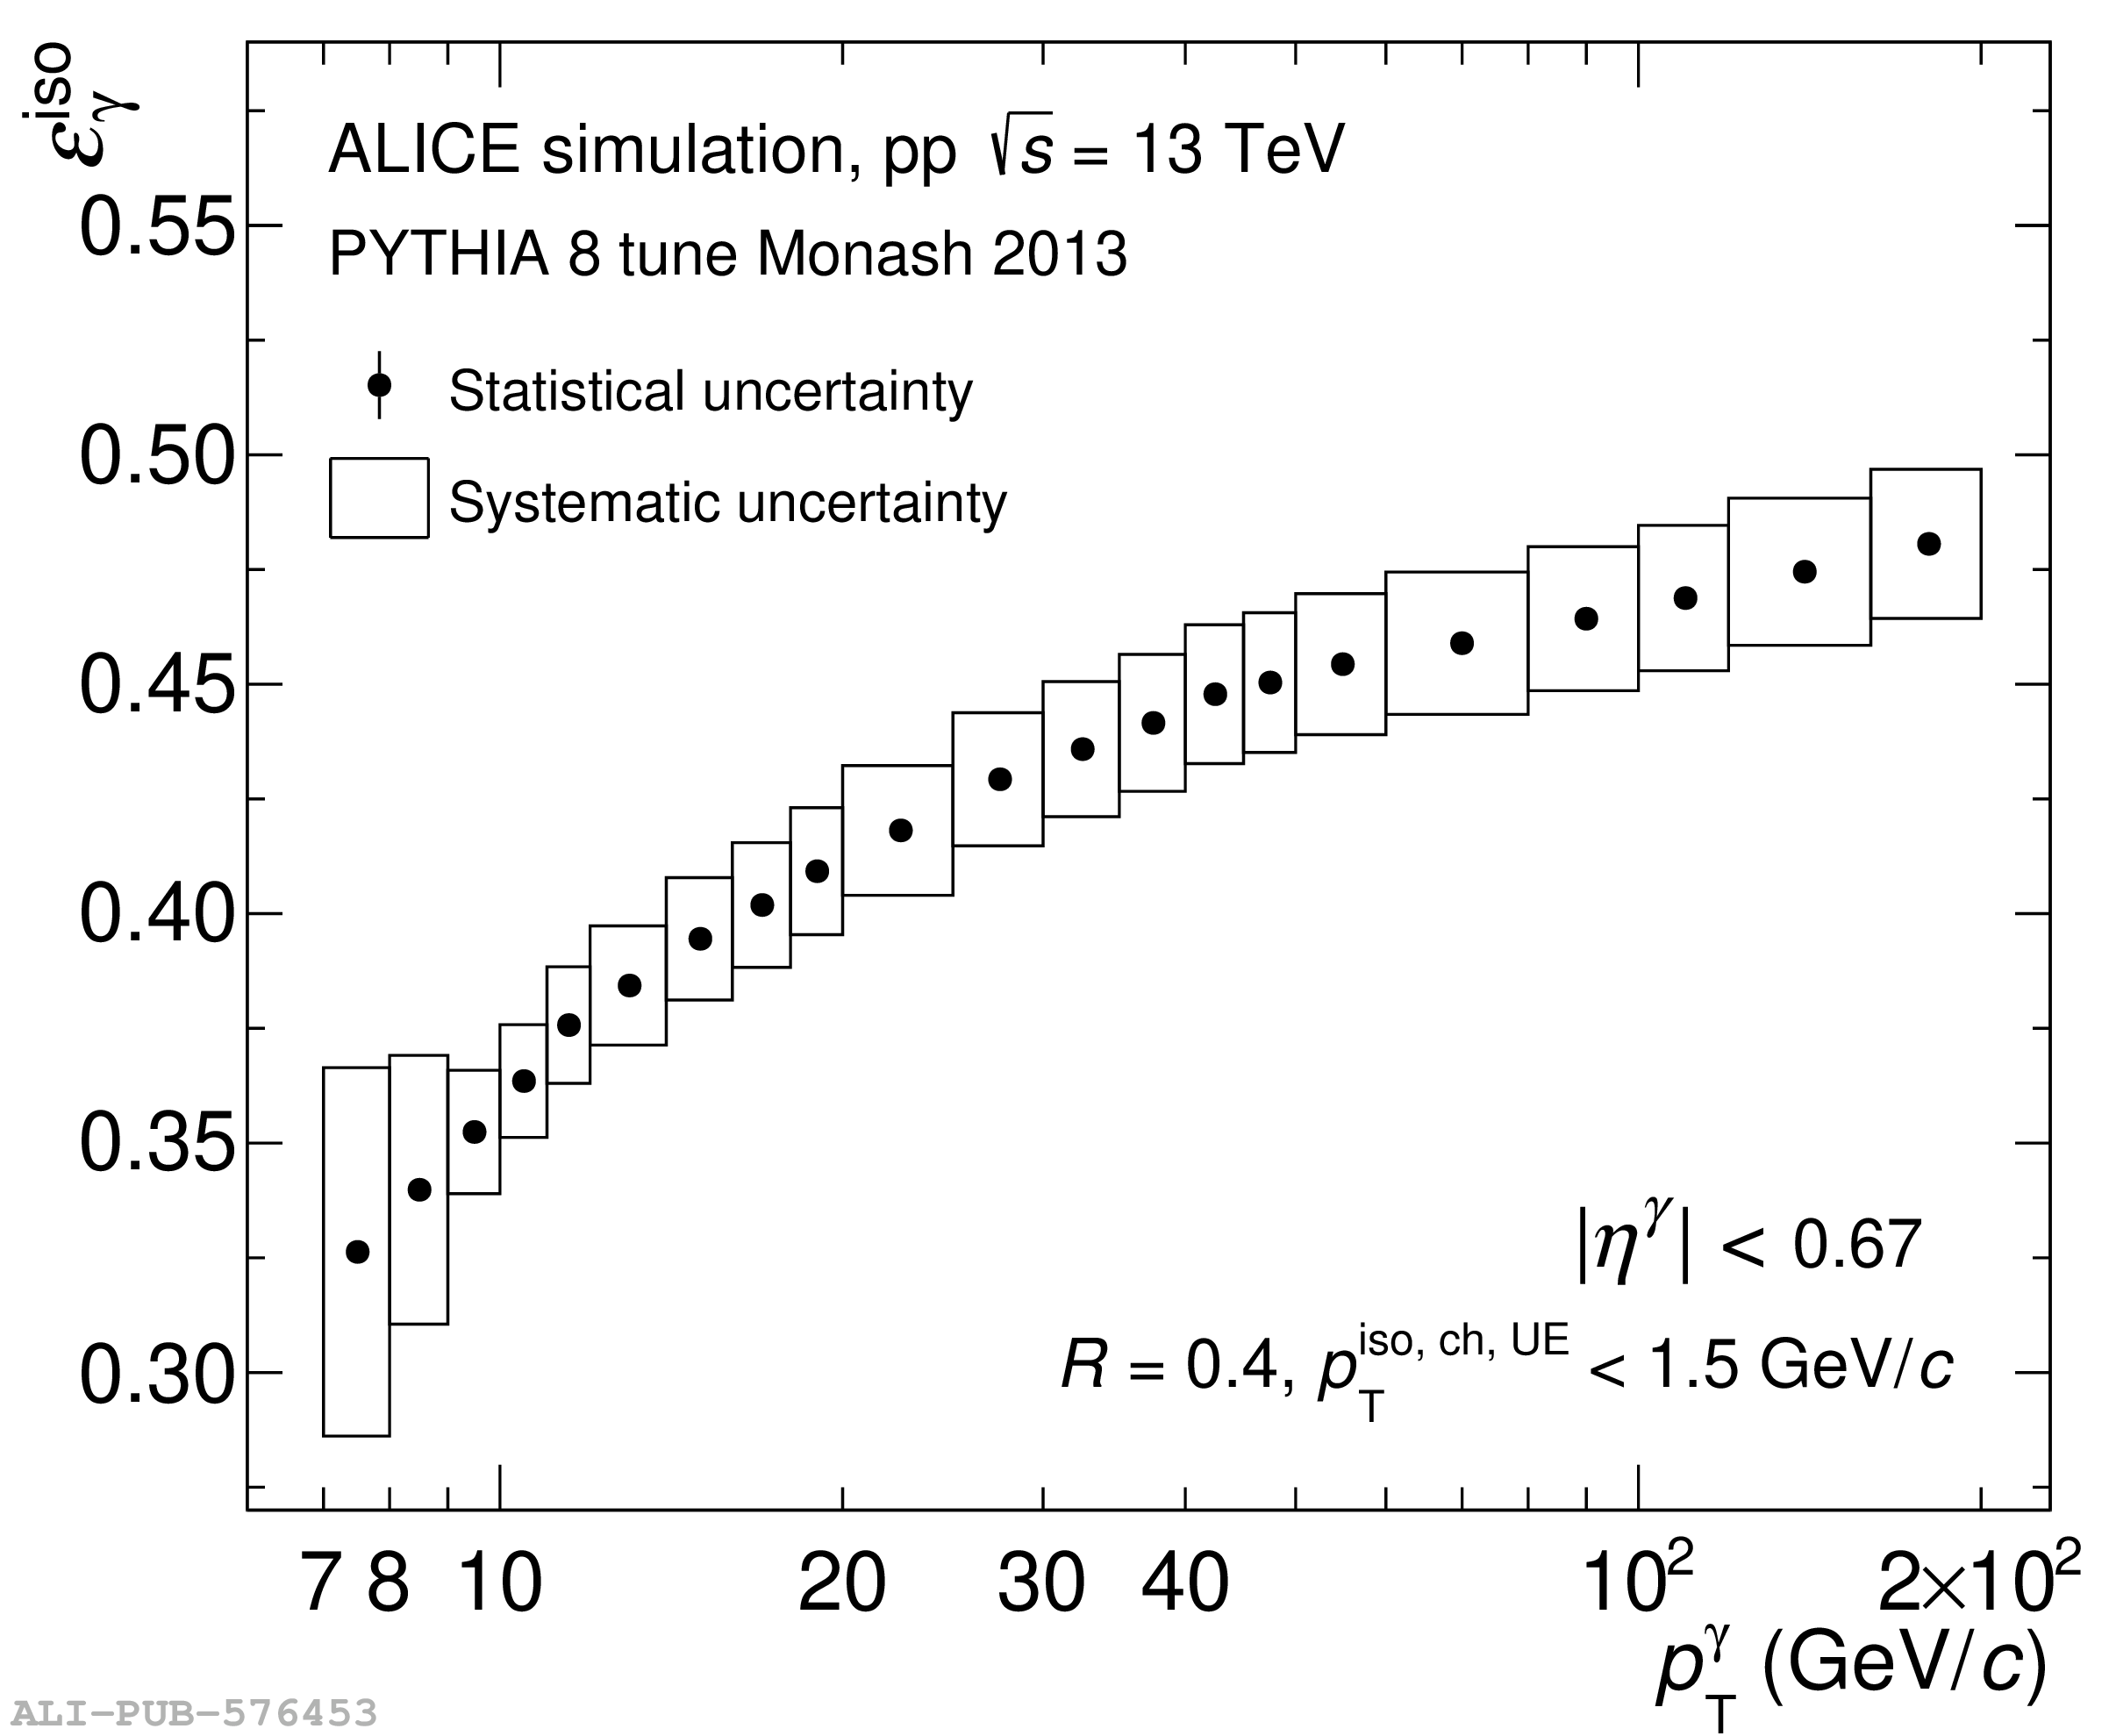 |
Figure 4
(a) Trigger efficiency for neutral clusters, narrow clusters, and isolated narrow clusters for the L1-$\gamma$-low and -high calorimeter triggers. (b) Trigger rejection factor calculated with and without applying the trigger efficiency for each of the calorimeter triggers. The results of a constant fit to the rejection factor plateau regions are shown in the legend, while the estimation of the uncertainties are described in Sect. 4. | 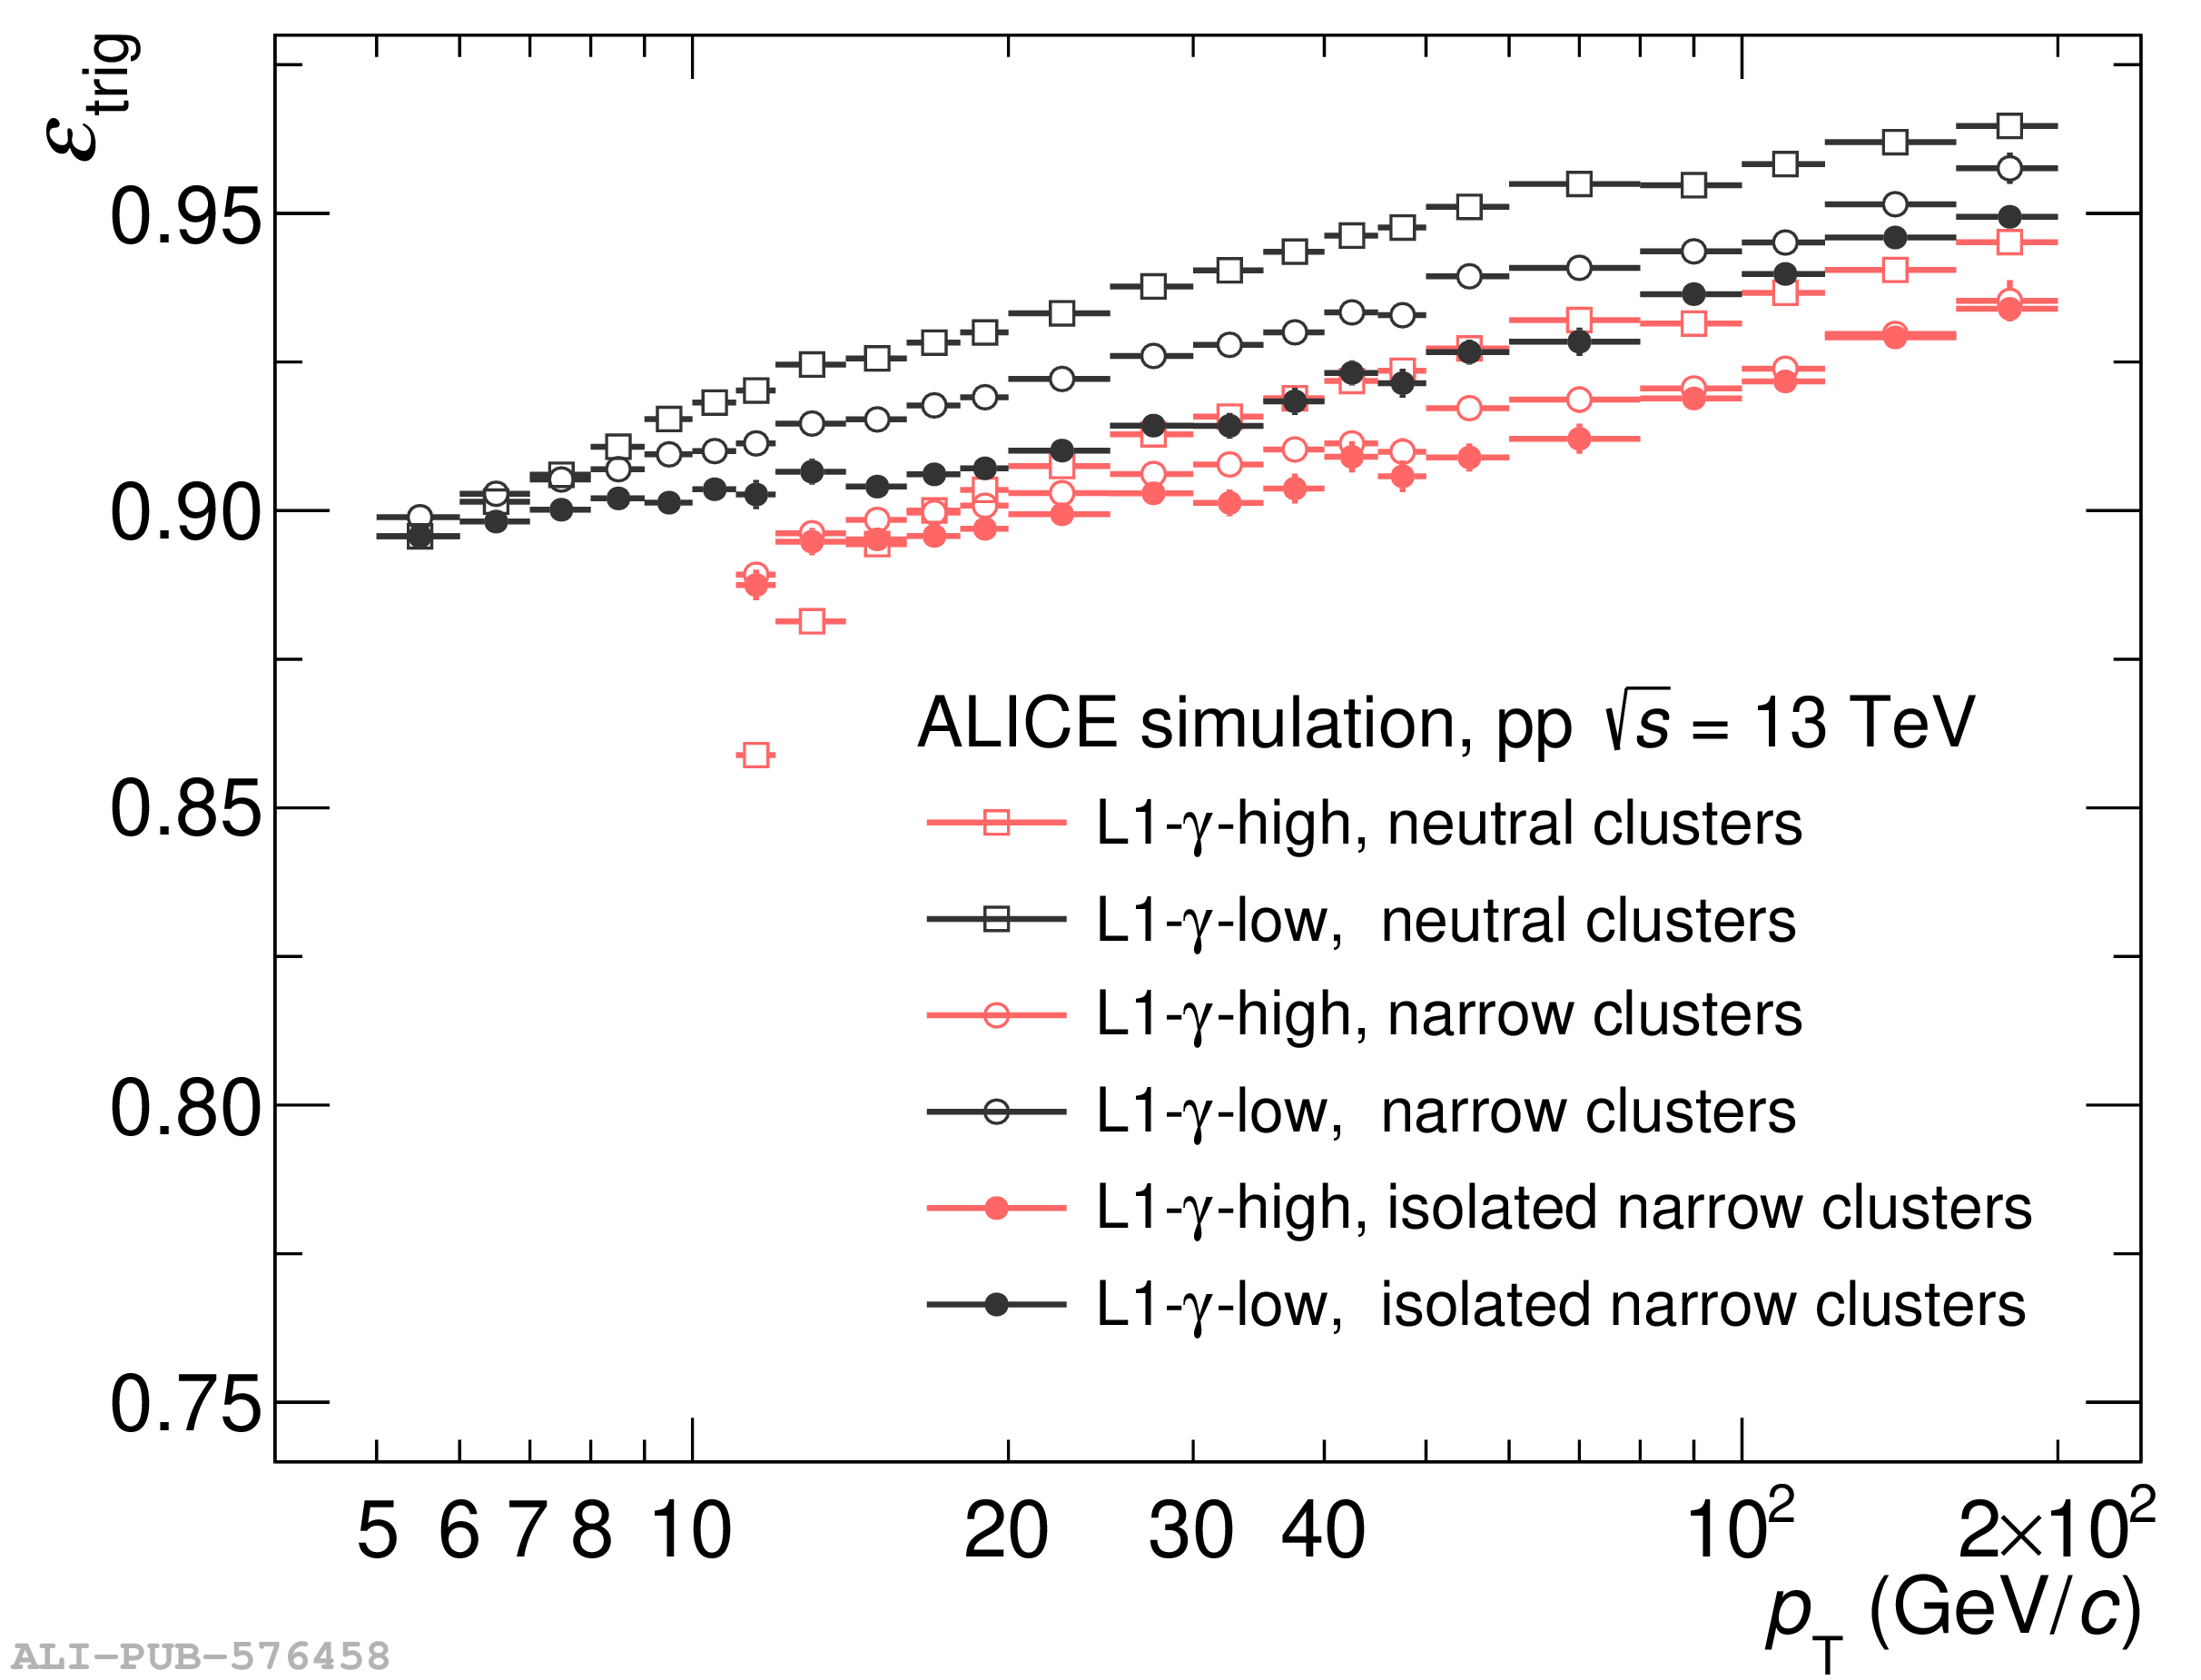  |
Figure 5
Relative systematic uncertainty sources of the isolated-photon purity (a) and cross section yield (b) and their quadratic sum as a function of $p_{\rm T}^{\gamma}$. The statistical uncertainty is also shown for reference as a shaded histogram. The total purity uncertainty in (a) is one of the sources added in quadrature to the total cross section uncertainty in (b). | 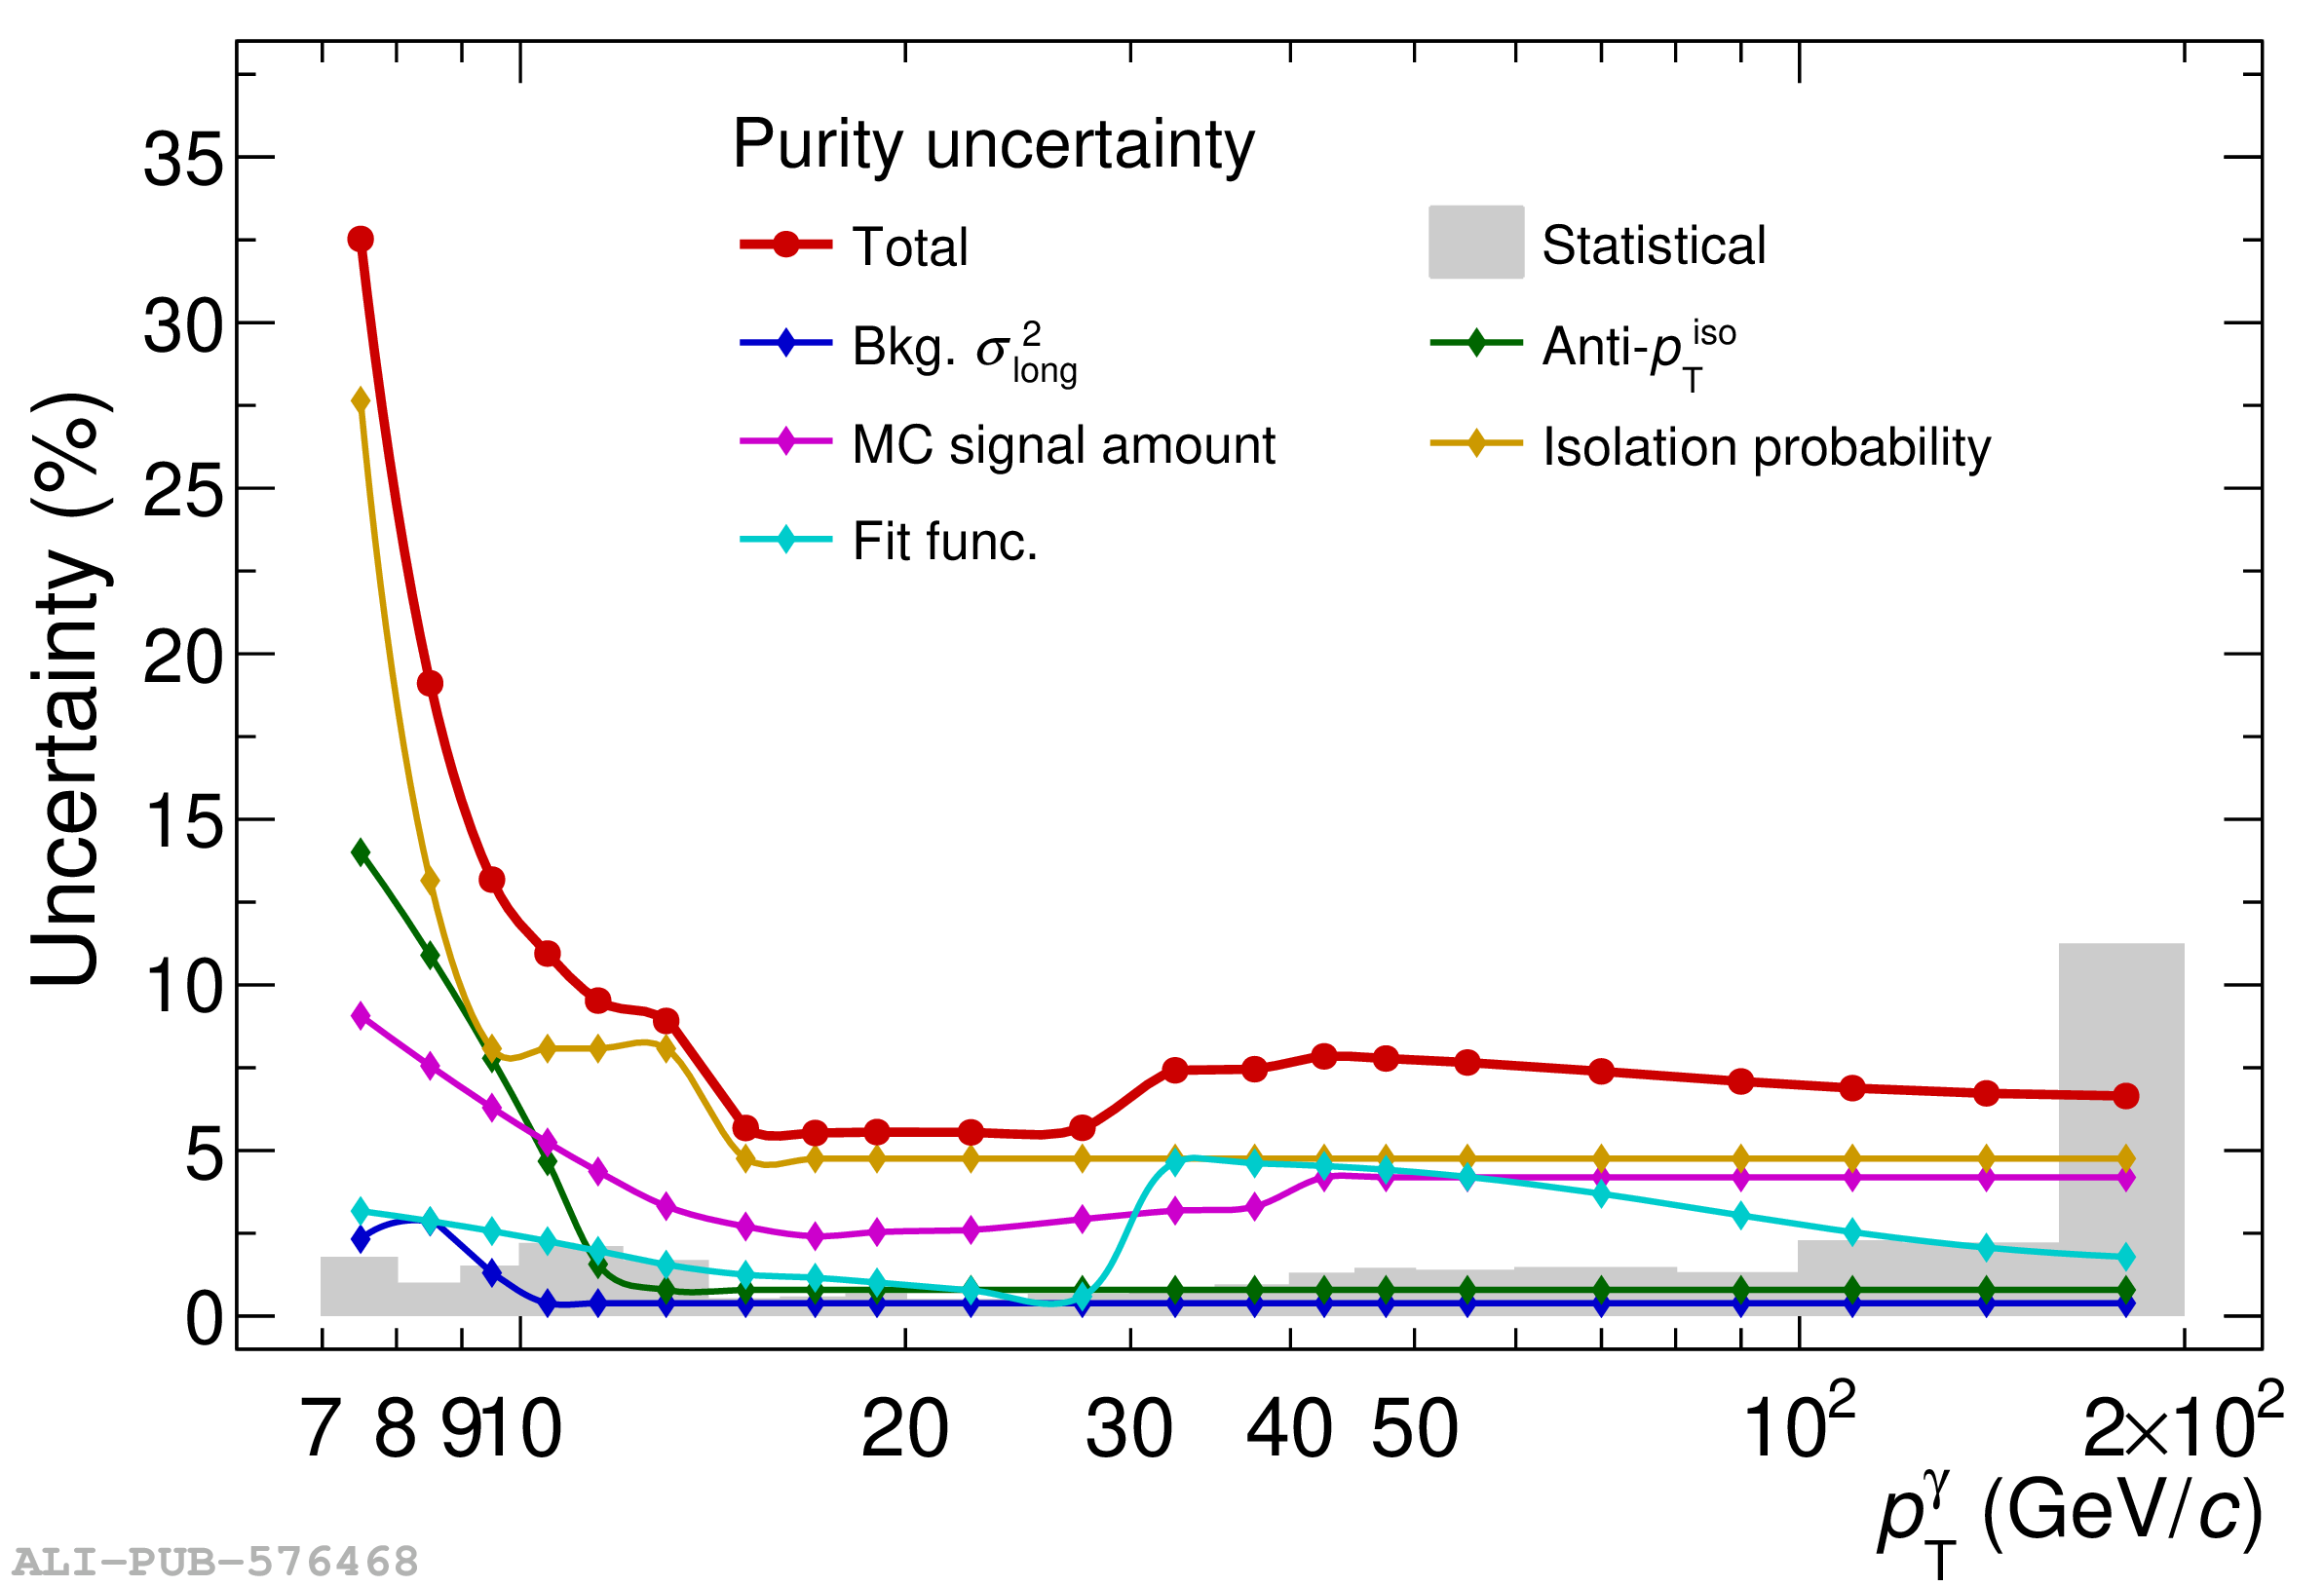 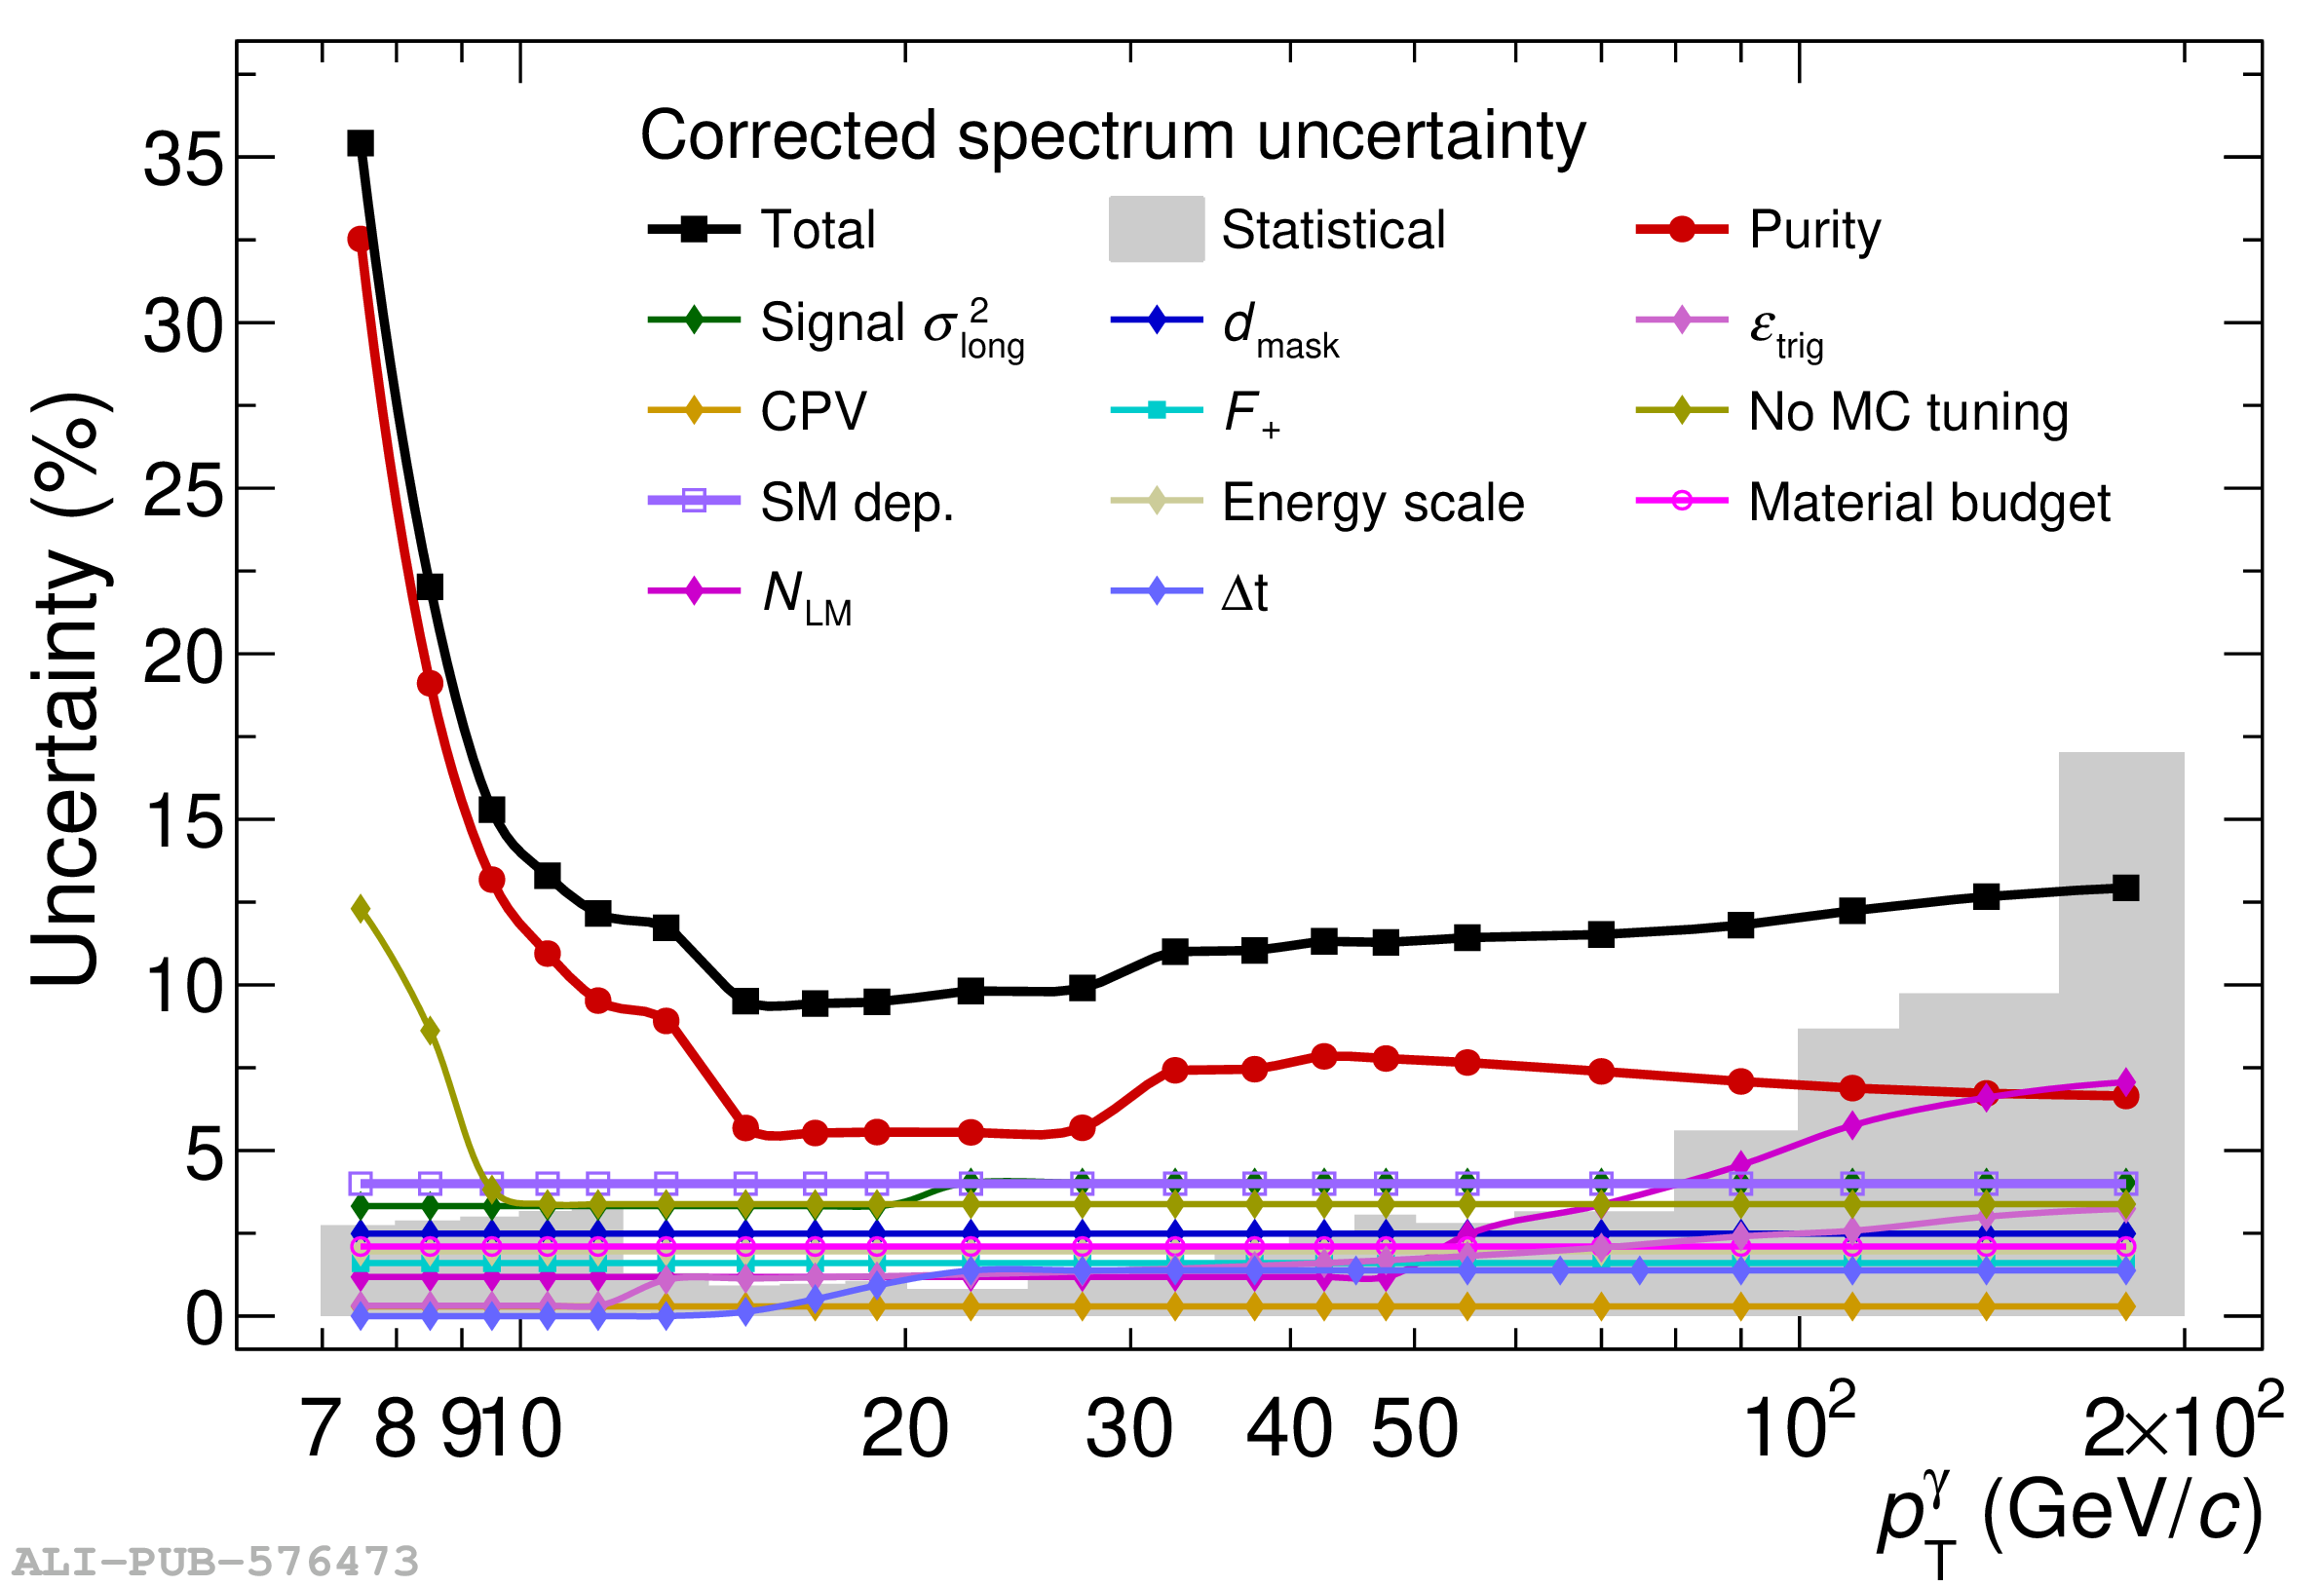 |
Figure 6
Top panel: Differential cross section of isolated photons measured in pp collisions at $\sqrt s =13$ TeV. Vertical black lines and grey-filled boxes represent data statistical and systematic uncertainties, respectively. The blue boxes correspond to pQCD calculations with JETPHOX, open boxes for scale uncertainty and filled boxes for PDF uncertainty, respectively. Bottom panel: Ratio between the JETPHOX calculation results and data displayed in the blue boxes, vertical boxes size shows the theory scale and PDF uncertainties. Experimental uncertainties are shown here on the black points centred at unity. The normalisation uncertainty of 1.5%, described in the text, is included only in the bottom panel and shown as a red box at 200 GeV/$c$. | 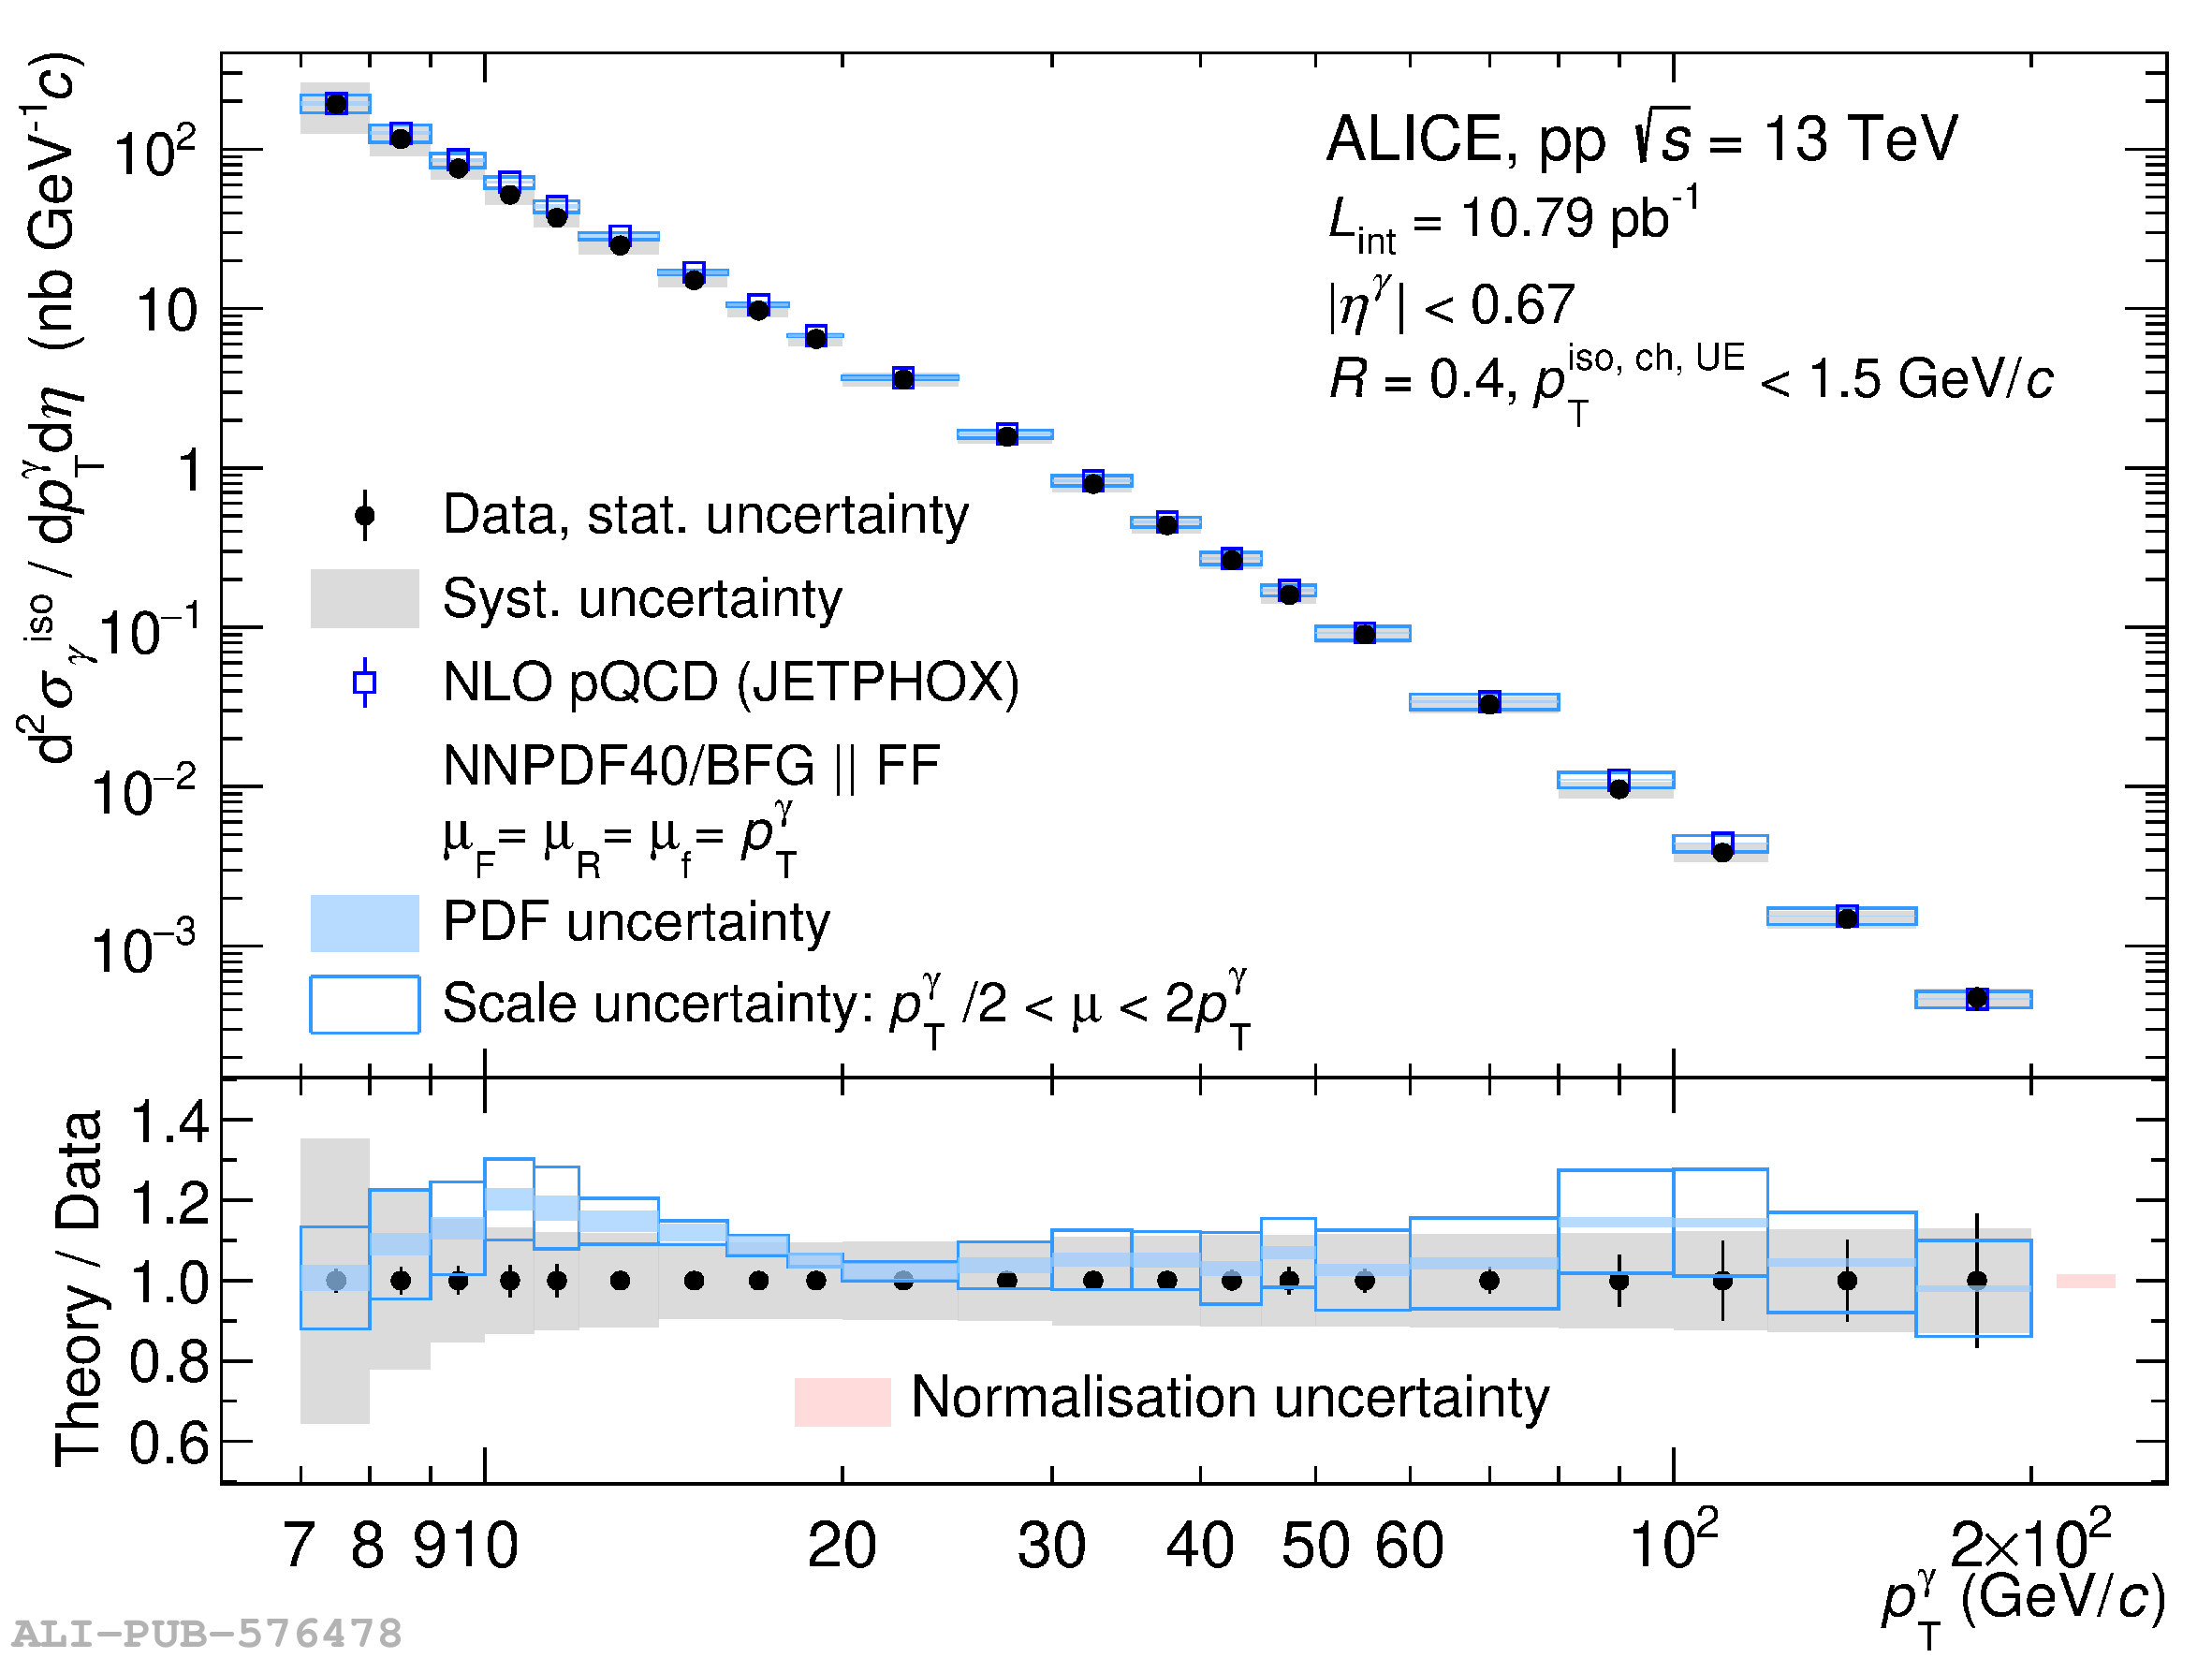 |
Figure 7
Ratio between theory predictions for the isolated-photon differential cross section and measurements for ATLAS [22], CMS [16], and ALICE. Theory predictions are obtained for ATLAS with NNLOJET [48] NNLO NNPDF3.1 PDFs [49], for CMS with JETPHOX NLO and NNPDF3.0 PDFs [50], and for ALICE with JETPHOX NLO and NNPDF4.0 PDFs [46]. Experimental uncertainties are shown here on the points centred at unity, for CMS and ATLAS statistical and systematic uncertainties are added in quadrature and shown as a vertical error bar. ALICE error bars are statistical uncertainties and boxes are systematic uncertainties. The coloured boxes centred at the ratio indicate the theoretical uncertainty on the PDF and scales. The luminosity normalisation uncertainty of each experiment is presented as an overall box around unity at the right of the figure centred at unity. | 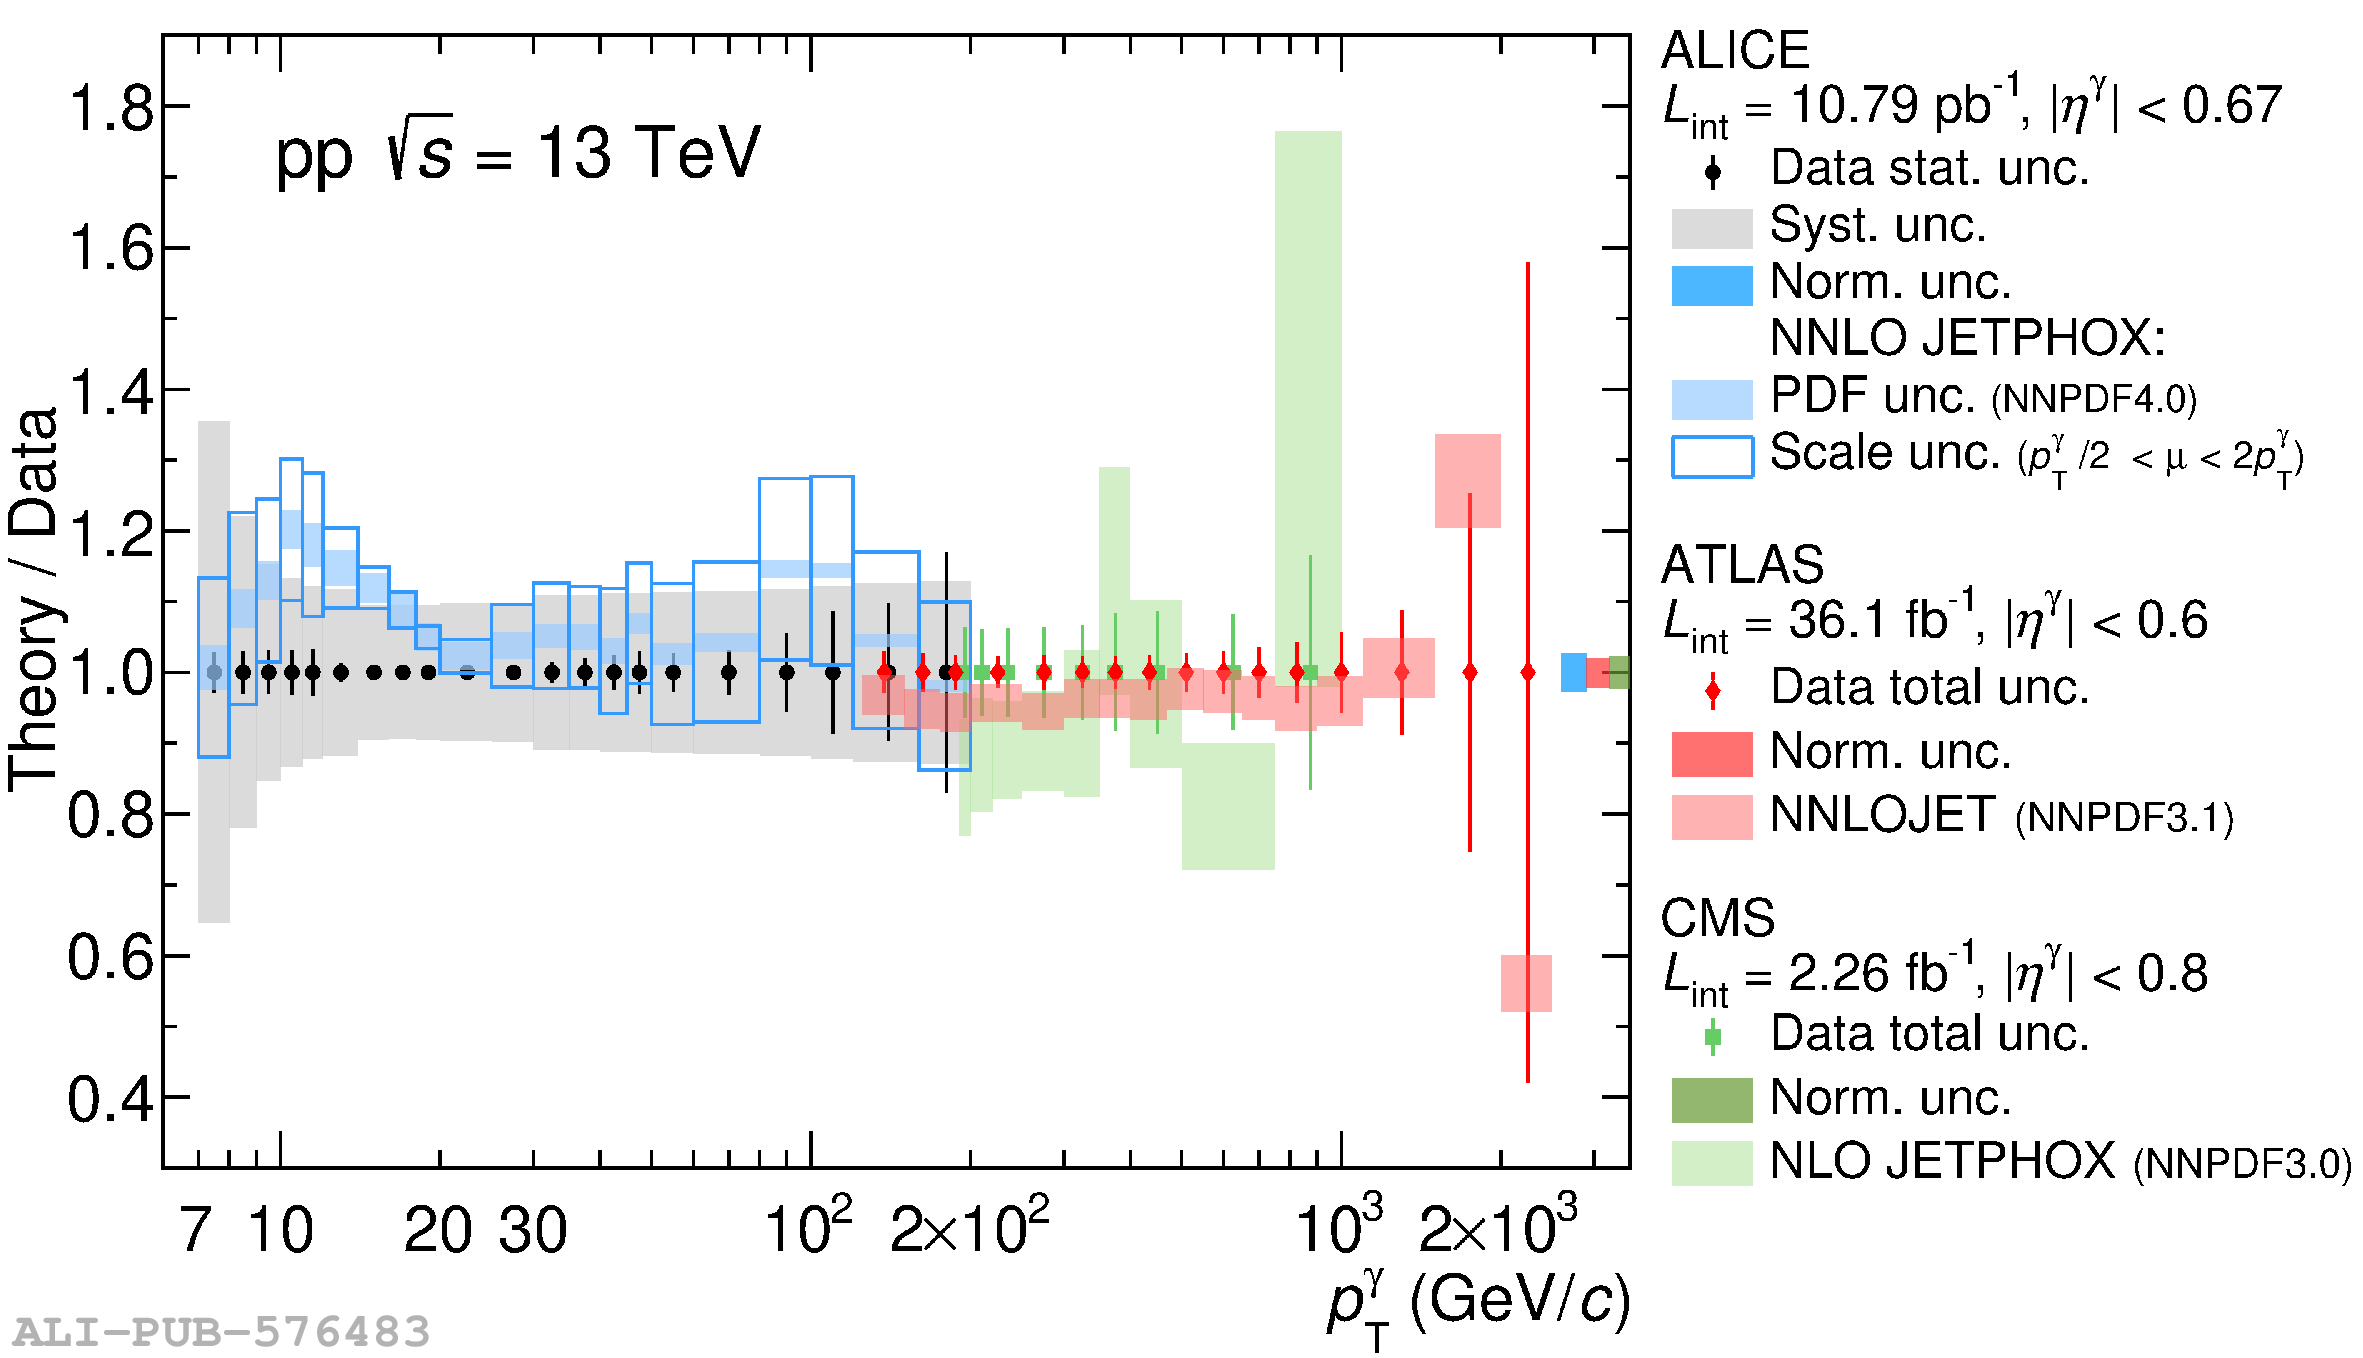 |
Figure 9
ALICE data compared to previous measurements of isolated-photon spectra in ${\rm pp}$ and ${\rm p}\overline{\rm p}$ collisions as a function of $x_{\rm T }$ where the invariant cross sections have been scaled by $(\sqrt{s})^n$ with $n=4.5$ (taken from Ref. [2]). For this comparison, only the results covering midrapidity are shown. | 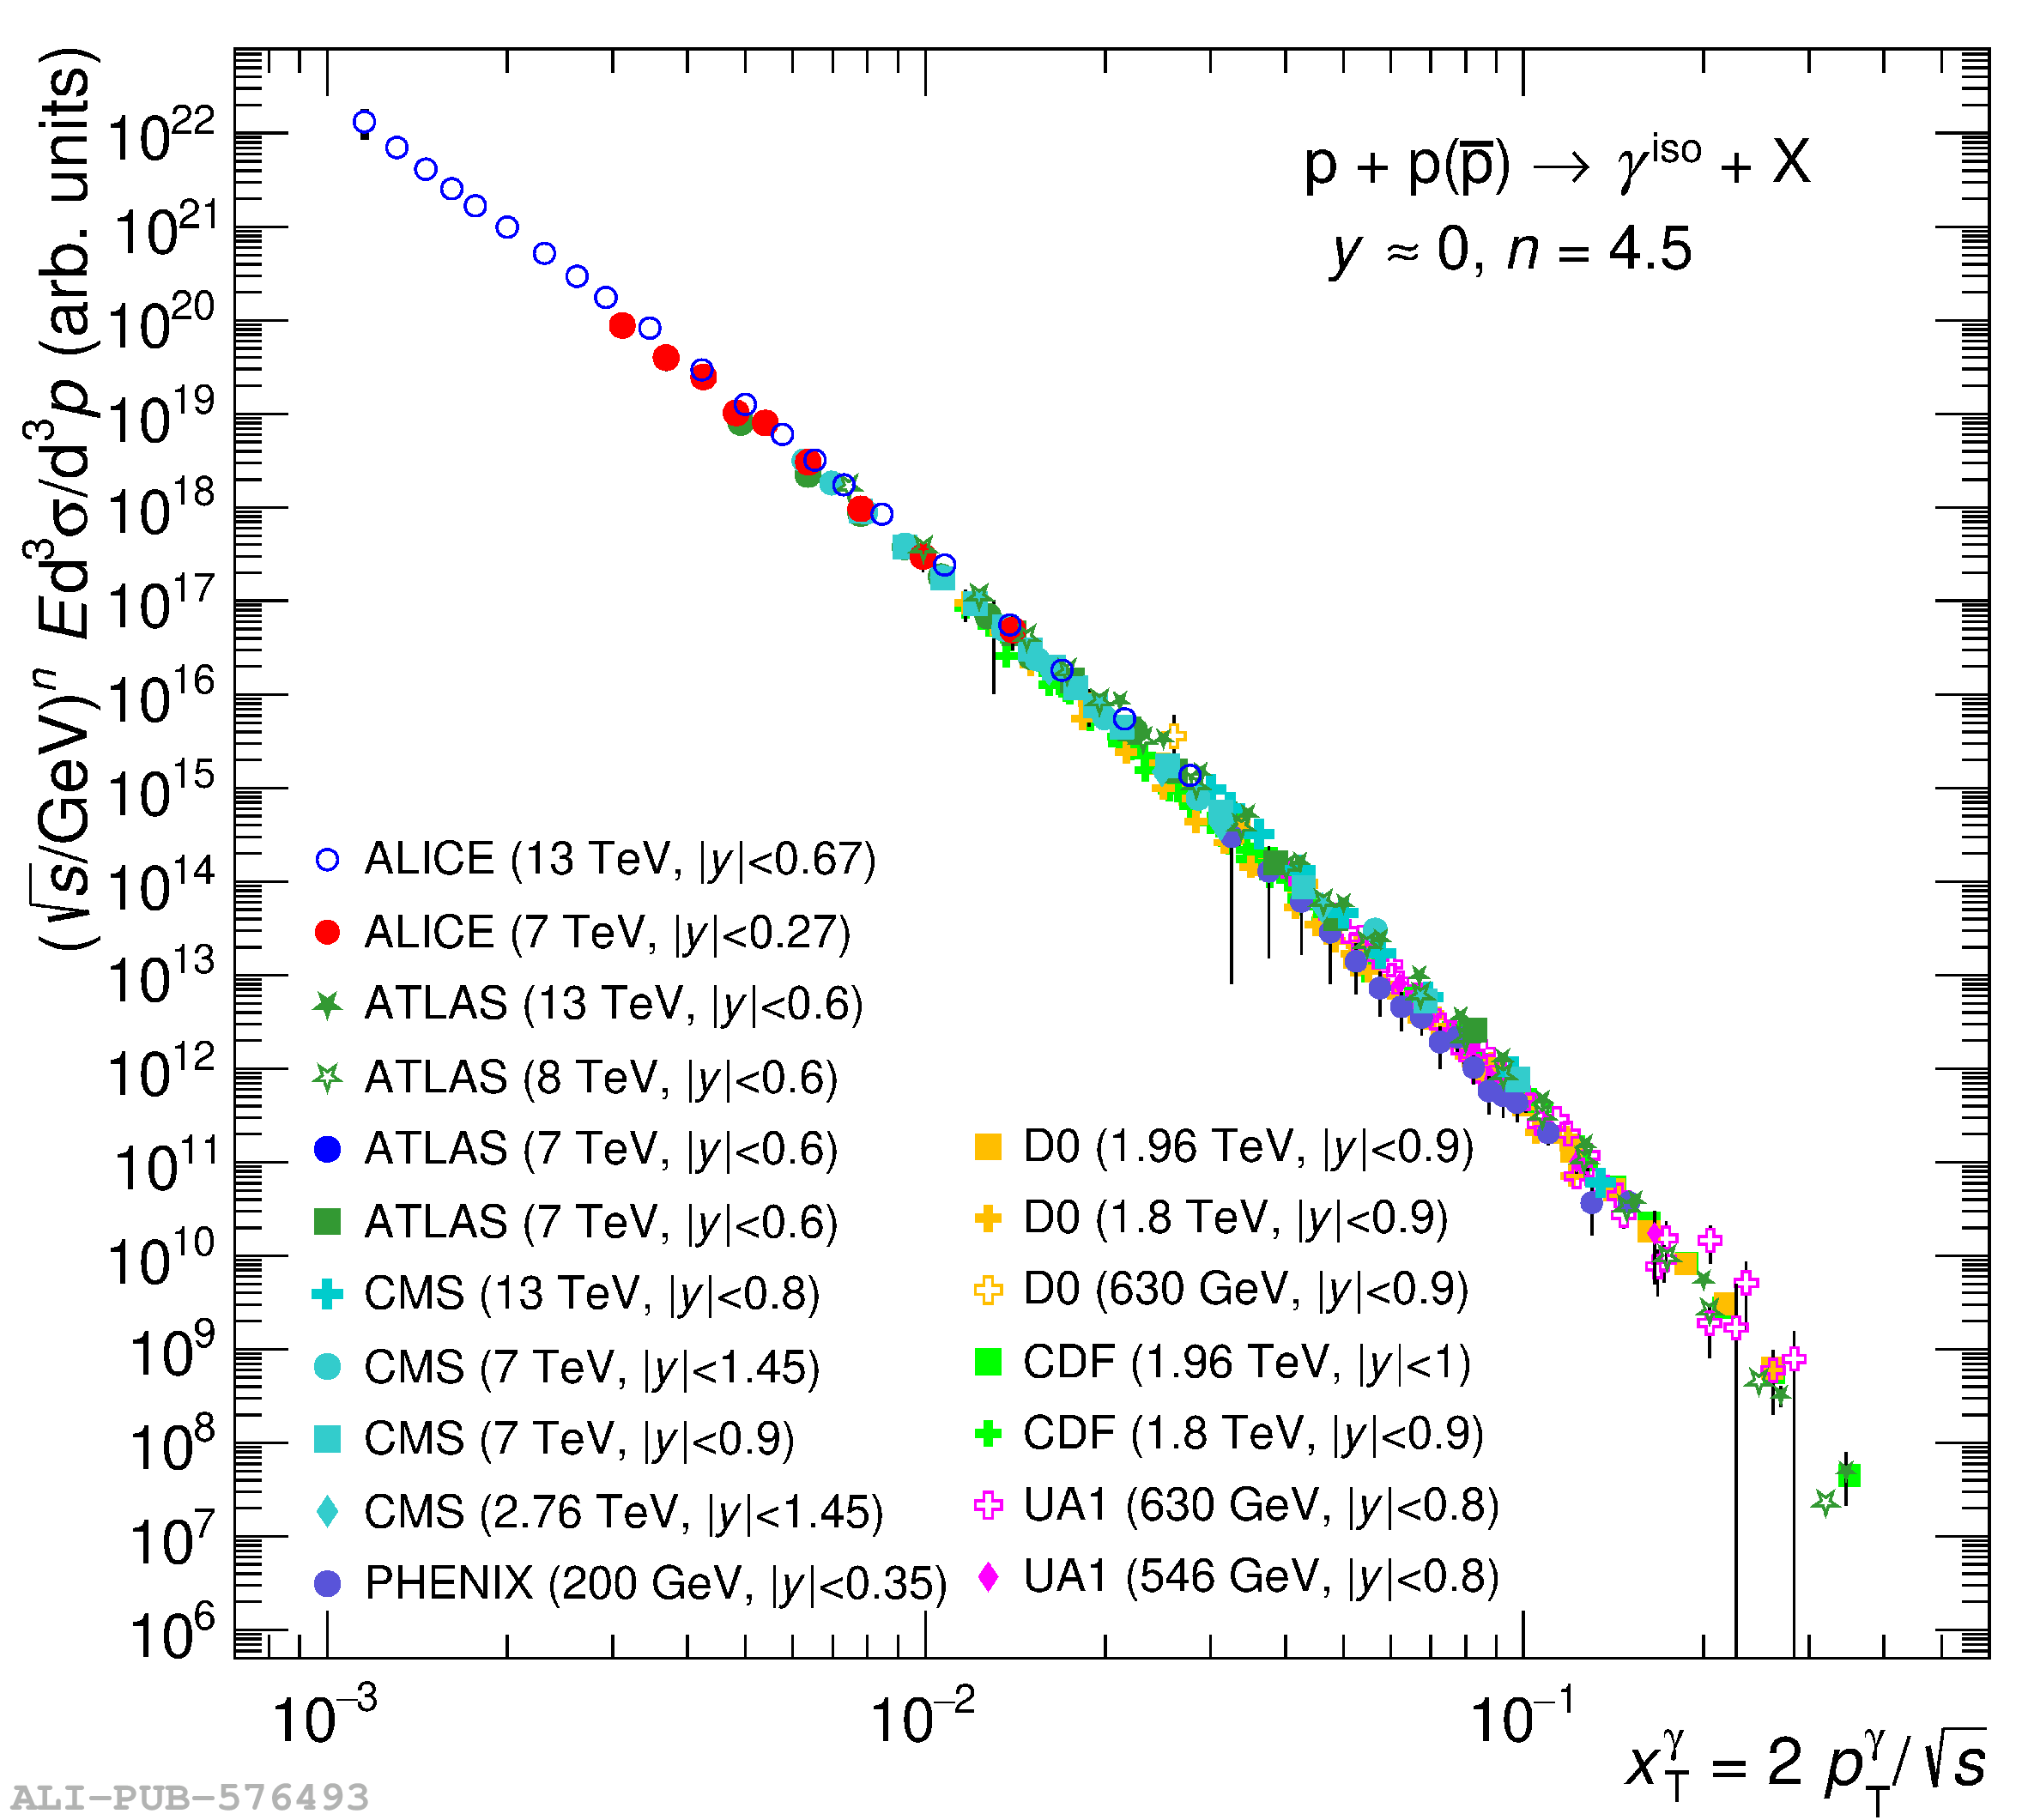 |