The first measurement of $_{\Lambda}^{3}\mathrm{H}$ and $^3_ {\overline{\Lambda}}\overline{\mathrm{H}}$ differential production with respect to transverse momentum and centrality in Pb$-$Pb collisions at $\sqrt{s_{\mathrm{NN}}}=5.02$~TeV is presented. The $_{\Lambda}^{3}\mathrm{H}$ has been reconstructed via its two-charged-body decay channel, i.e., $_{\Lambda}^{3}\mathrm{H} \rightarrow {}^{3}\mathrm{He} + \pi^{-}$. A Blast-Wave model fit of the $p_{\rm T}$-differential spectra of all nuclear species measured by the ALICE collaboration suggests that the $_{\Lambda}^{3}\mathrm{H}$ kinetic freeze-out surface is consistent with that of other nuclei. The ratio between the integrated yields of $_{\Lambda}^{3}\mathrm{H}$ and $^3\mathrm{He}$ is compared to predictions from the statistical hadronisation model and the coalescence model, with the latter being favoured by the presented measurements.
Phys. Lett. B 860 (2025) 139066
HEP Data
e-Print: arXiv:2405.19839 | PDF | inSPIRE
CERN-EP-2024-148
Figure group
Figure 1
Invariant-mass distribution of selected ${}_Λ^{3}\mathrm{H}$ candidates in the centrality class 0-10% and $p_{\rm T}$ interval 3 $ < p_{\rm T} < $ 3.5 GeV/c fitted with a function which is the sum of a double-sided Crystal Ball signal and an exponential background. Vertical lines represent the statistical uncertainties. | 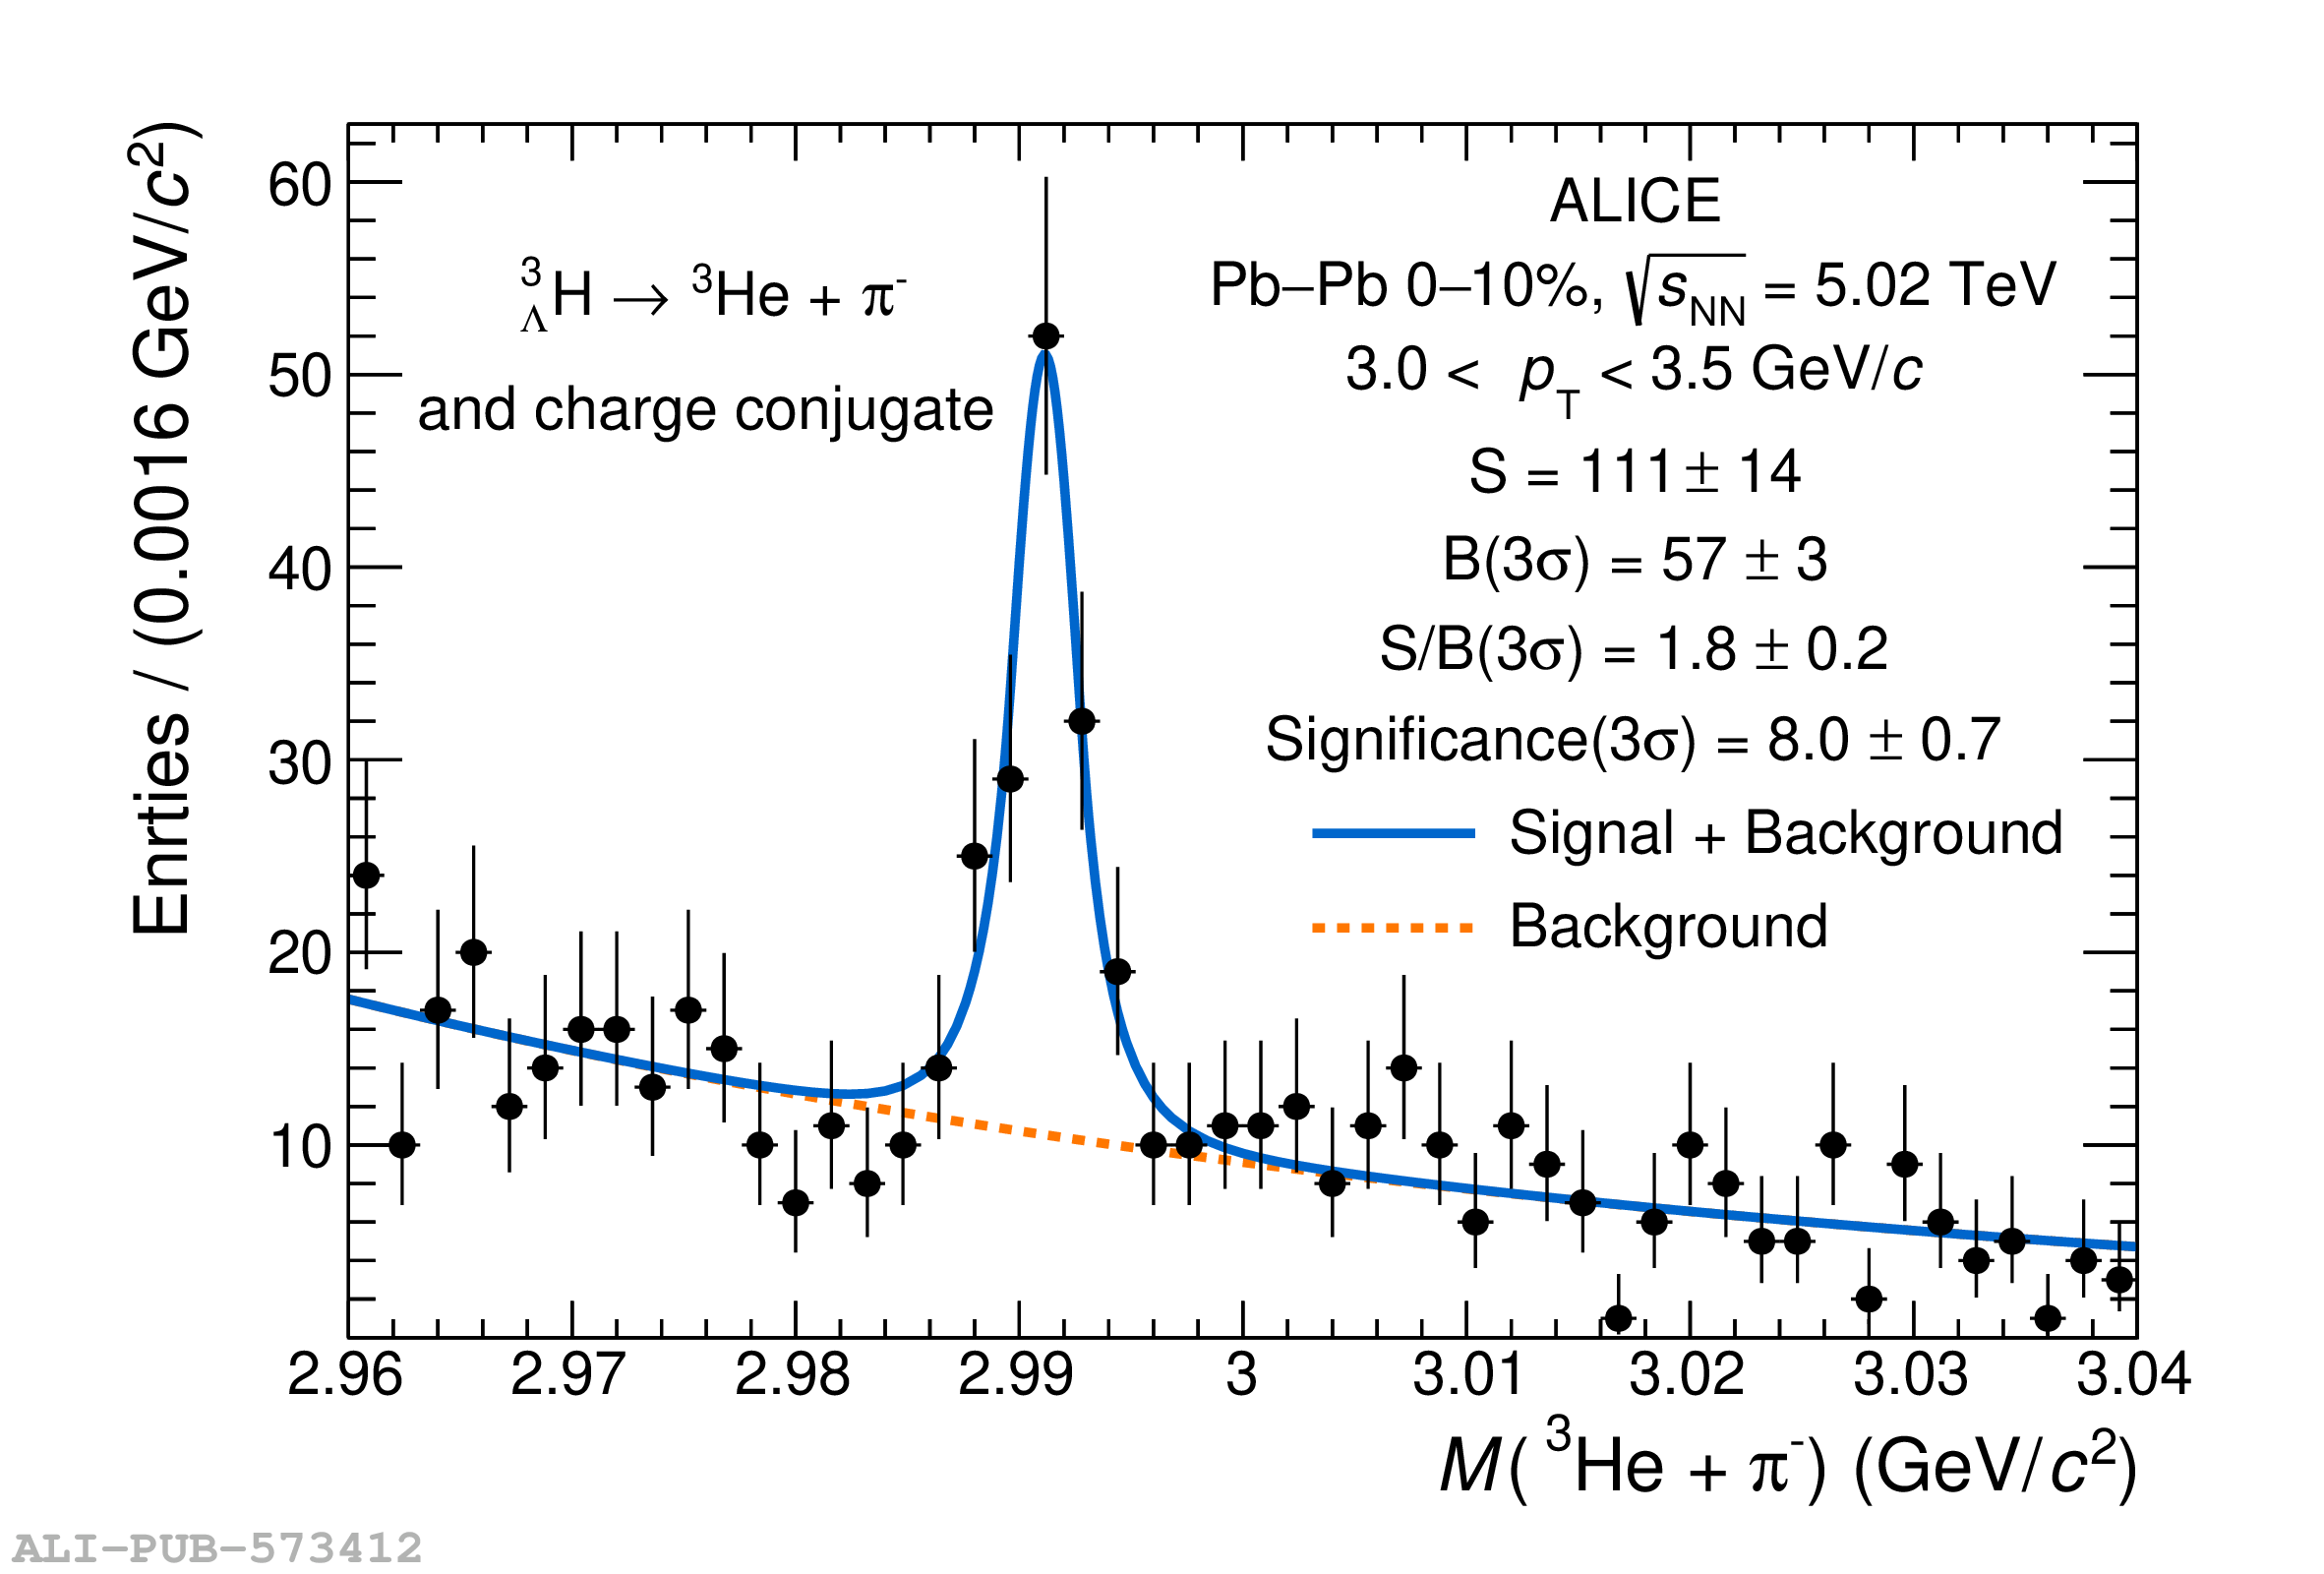 |
Figure 2
Deuteron (d), antitriton ($\mathrm{\overline{t}}$) , ${}^3\mathrm{He}$, and ${}_Λ^{3}\mathrm{H}$ spectra measured in PbPb collisions at $\sqrt{s_{\mathrm{NN}}}$ = 5.02 TeV. Each panel shows a centrality interval and different nuclei are reported with different colours. For ${}_Λ^{3}\mathrm{H}$, the average spectra between particles and antiparticles is employed. The width of the boxes refers to the range of the $p_{\rm T}$ intervals, while their height represents the systematic uncertainties. The vertical lines are the statistical uncertainties. The combined Blast-Wave fit parameters for d, $\mathrm{\overline{t}}$ , ${}^3\mathrm{He}$, and ${}_Λ^{3}\mathrm{H}$ are listed in Table 1. |  |
Figure 3
Yield ratio of ${}_Λ^{3}\mathrm{H}$ to ${}^{3}\mathrm{He}$ together with theoretical predictions as a function of multiplicity. In the left panel, the results of this analysis are compared with the ALICE measurement at $\sqrt{s_{\mathrm{NN}}}$ = 2.76 TeV . Vertical lines are used for the statistical uncertainties and the height of the boxes for the systematic ones. The width of the boxes refers to the uncertainties of multiplicity. For each centrality interval the $\langle \mathrm{d}N_\mathrm{ch}/\mathrm{d}\eta\rangle$ is taken from Ref. [73] and the ${}^{3}\mathrm{He}$ yield from Ref. [51]. The dense orange dashed line represents the expectation of SHM, while the other three sets of lines stand for coalescence model with different $B_\Lambda$ hypotheses. The coalescence prediction with world average $B_\Lambda$ is displayed with a 1$\sigma$ uncertainty as the filled area, both lines and shadowed areas are linear interpolations of the available model calculations . In the right panel, the results of recent STAR measurement are shown for comparison . | 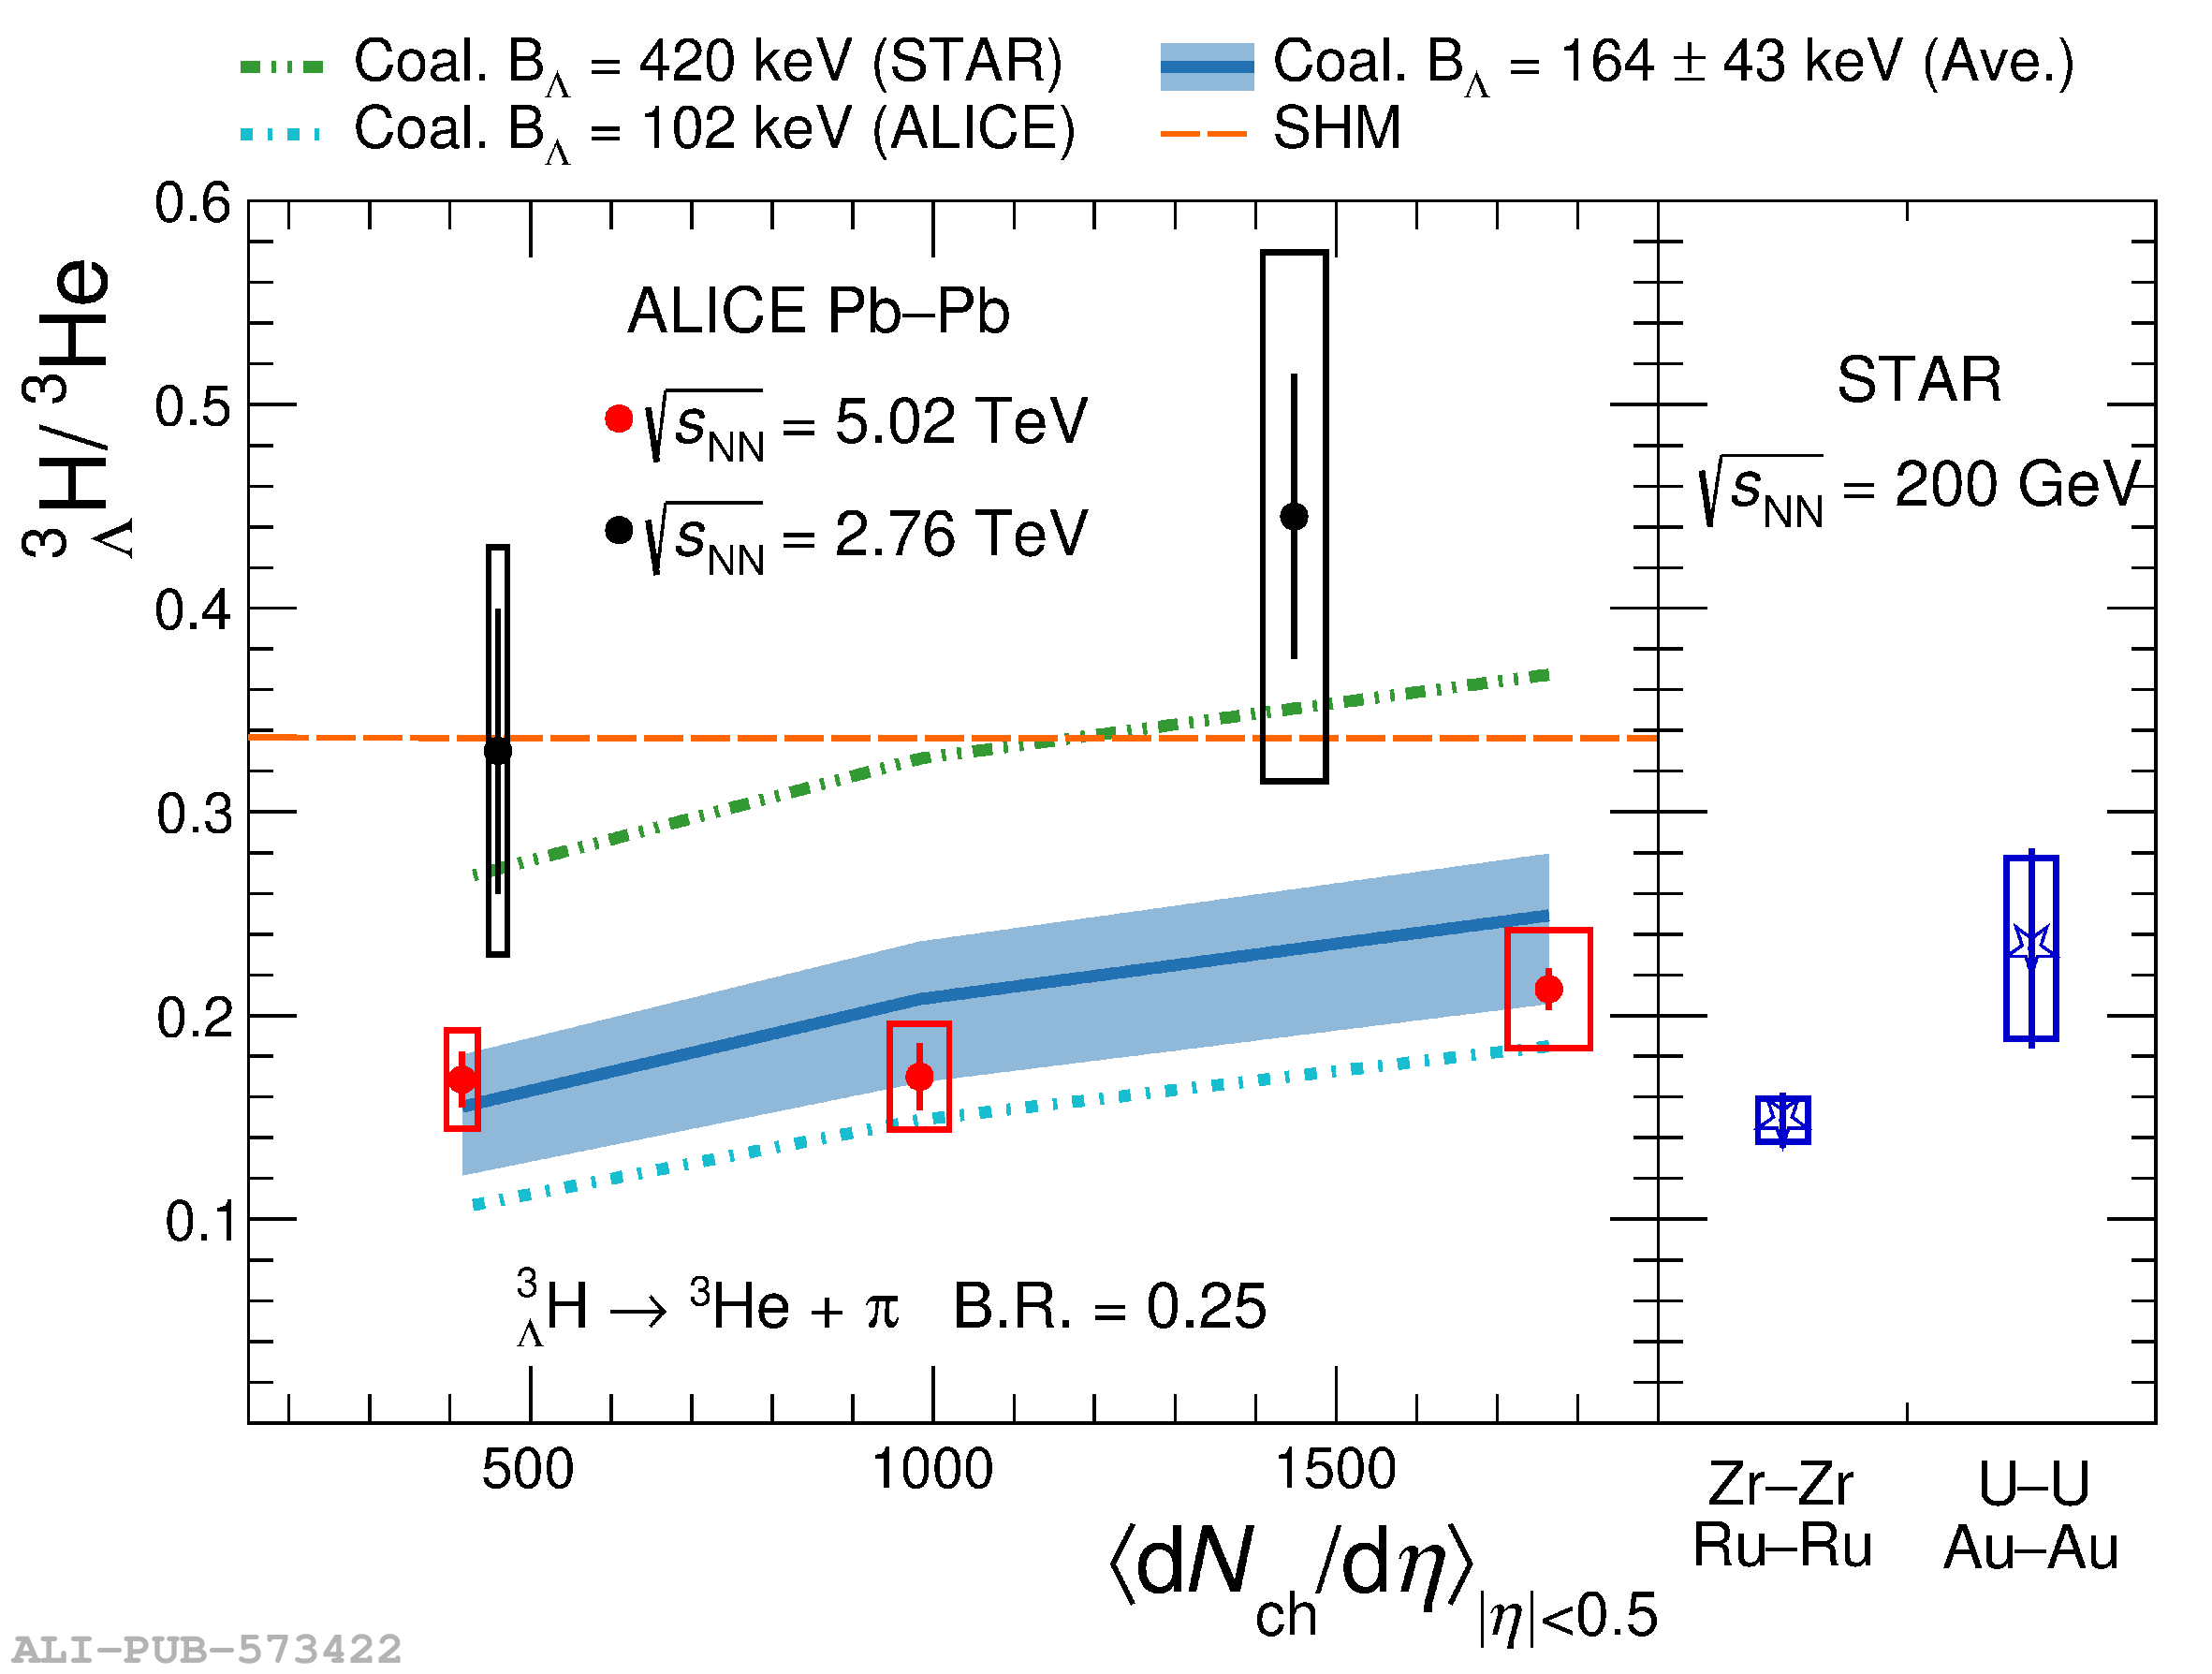 |
Figure 4
The ${}_Λ^{3}\mathrm{H} / {}^{3}\mathrm{He}$ yield ratio together with theoretical predictions in different centrality intervals as a function of $p_{\rm T}$. The vertical lines and the height of the boxes represent the statistical and systematic uncertainties, respectively. The width of the boxes displays the range of the $p_{\rm T}$ intervals. The pink solid lines are calculated as the ratios of the Blast-Wave fit functions for ${}^{3}\mathrm{He}$ and ${}_Λ^{3}\mathrm{H}$. The other three curves stand for the predictions of the coalescence model with different $B_\Lambda$ hypotheses. The coalescence prediction with world average $B_\Lambda$ is displayed with a 1$\sigma$ uncertainty band . |  |