Comparison of event-by-event mean transverse momentum $\langle p_\mathrm{T}\rangle$ distribution from actual analysis and modified analysis in which $N_\mathrm{ch}$ in each event is fixed to $N_\mathrm{ch}^\mathrm{min}$ ($N_\mathrm{ch}^\mathrm{min}$ is the minimum number of charged particles in a given centrality class) and $N_\mathrm{ch}^\mathrm{min}$ number of particles are selected in each event randomly for the 0$-$5% (left), 30$-$40% (middle), and 50$-$60% (right) centrality classes. | 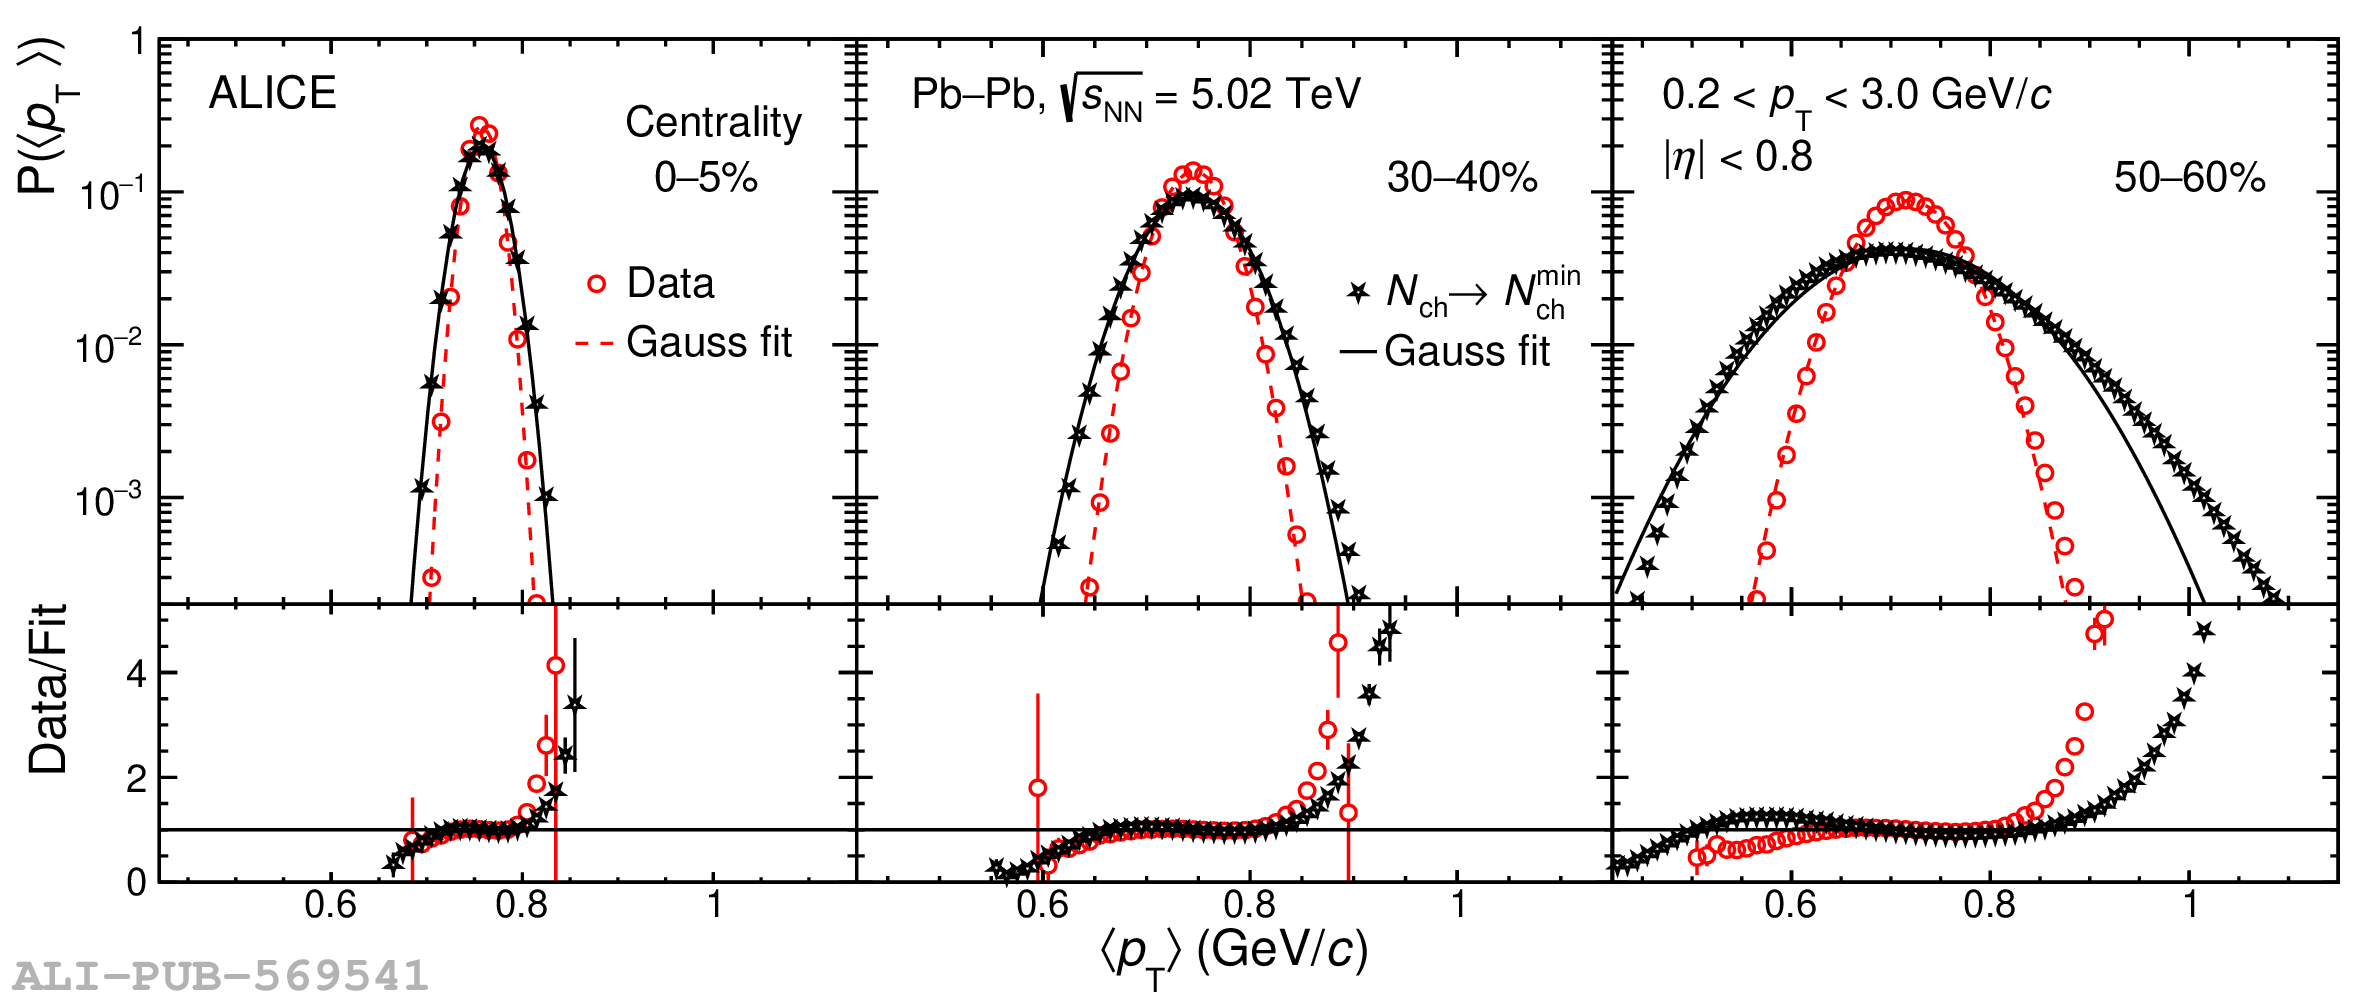 |