Projection of the correlation function of TPC$-$FMD1,2 (left), TPC$-$FMD3 (central), and FMD1,2$-$FMD3 (right) correlations in 0$-$5\% p$-$Pb collisions with the template fit using Eq. (3). The open circle blue marker represents the scaled peripheral distribution plus the Flow baseline, $G$. The red and green dashed lines represent the second- and third-order components plus the baseline, respectively. | 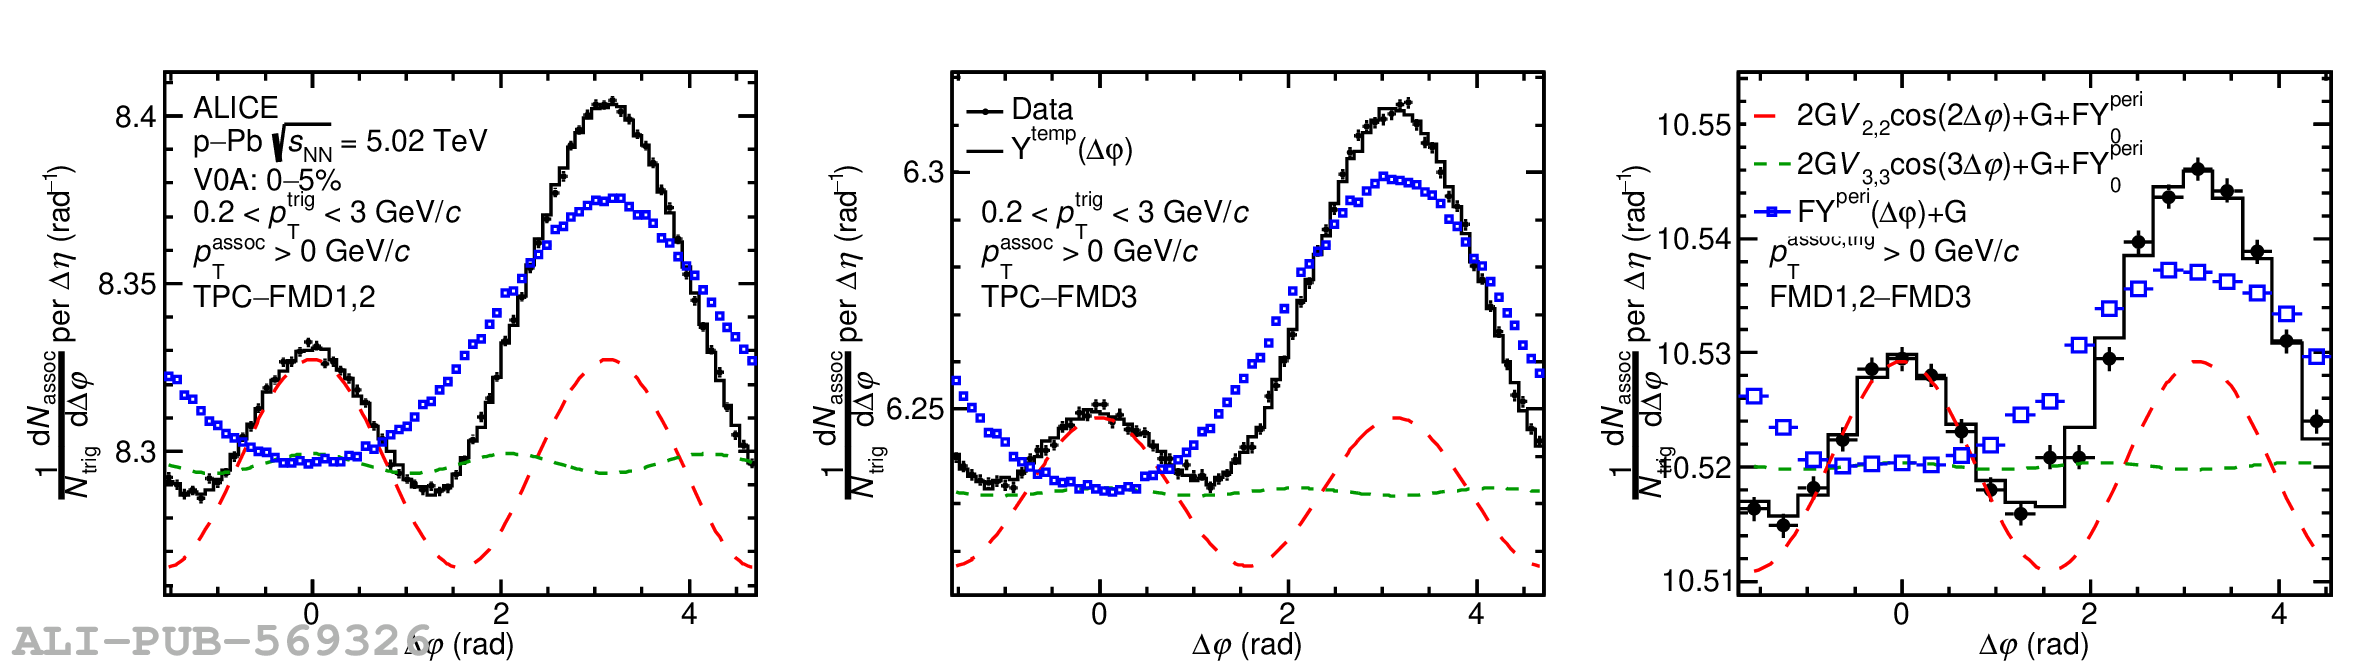 |