The magnitudes of $v_2$ (left panel) and $v_3$ (right panel) for two different collision systems, pp and p$-$Pb as a function of charged-particle multiplicity at midrapidity. For pp collisions, two different $p_\mathrm{T}$ intervals are shown, $1.0< \pt< 2.0$ GeV/$c$ and $1.0< \pt< 4.0$ GeV/$c$. The boxes around the data points represent the estimated systematic uncertainties and the error bars corresponds to statistical errors. | 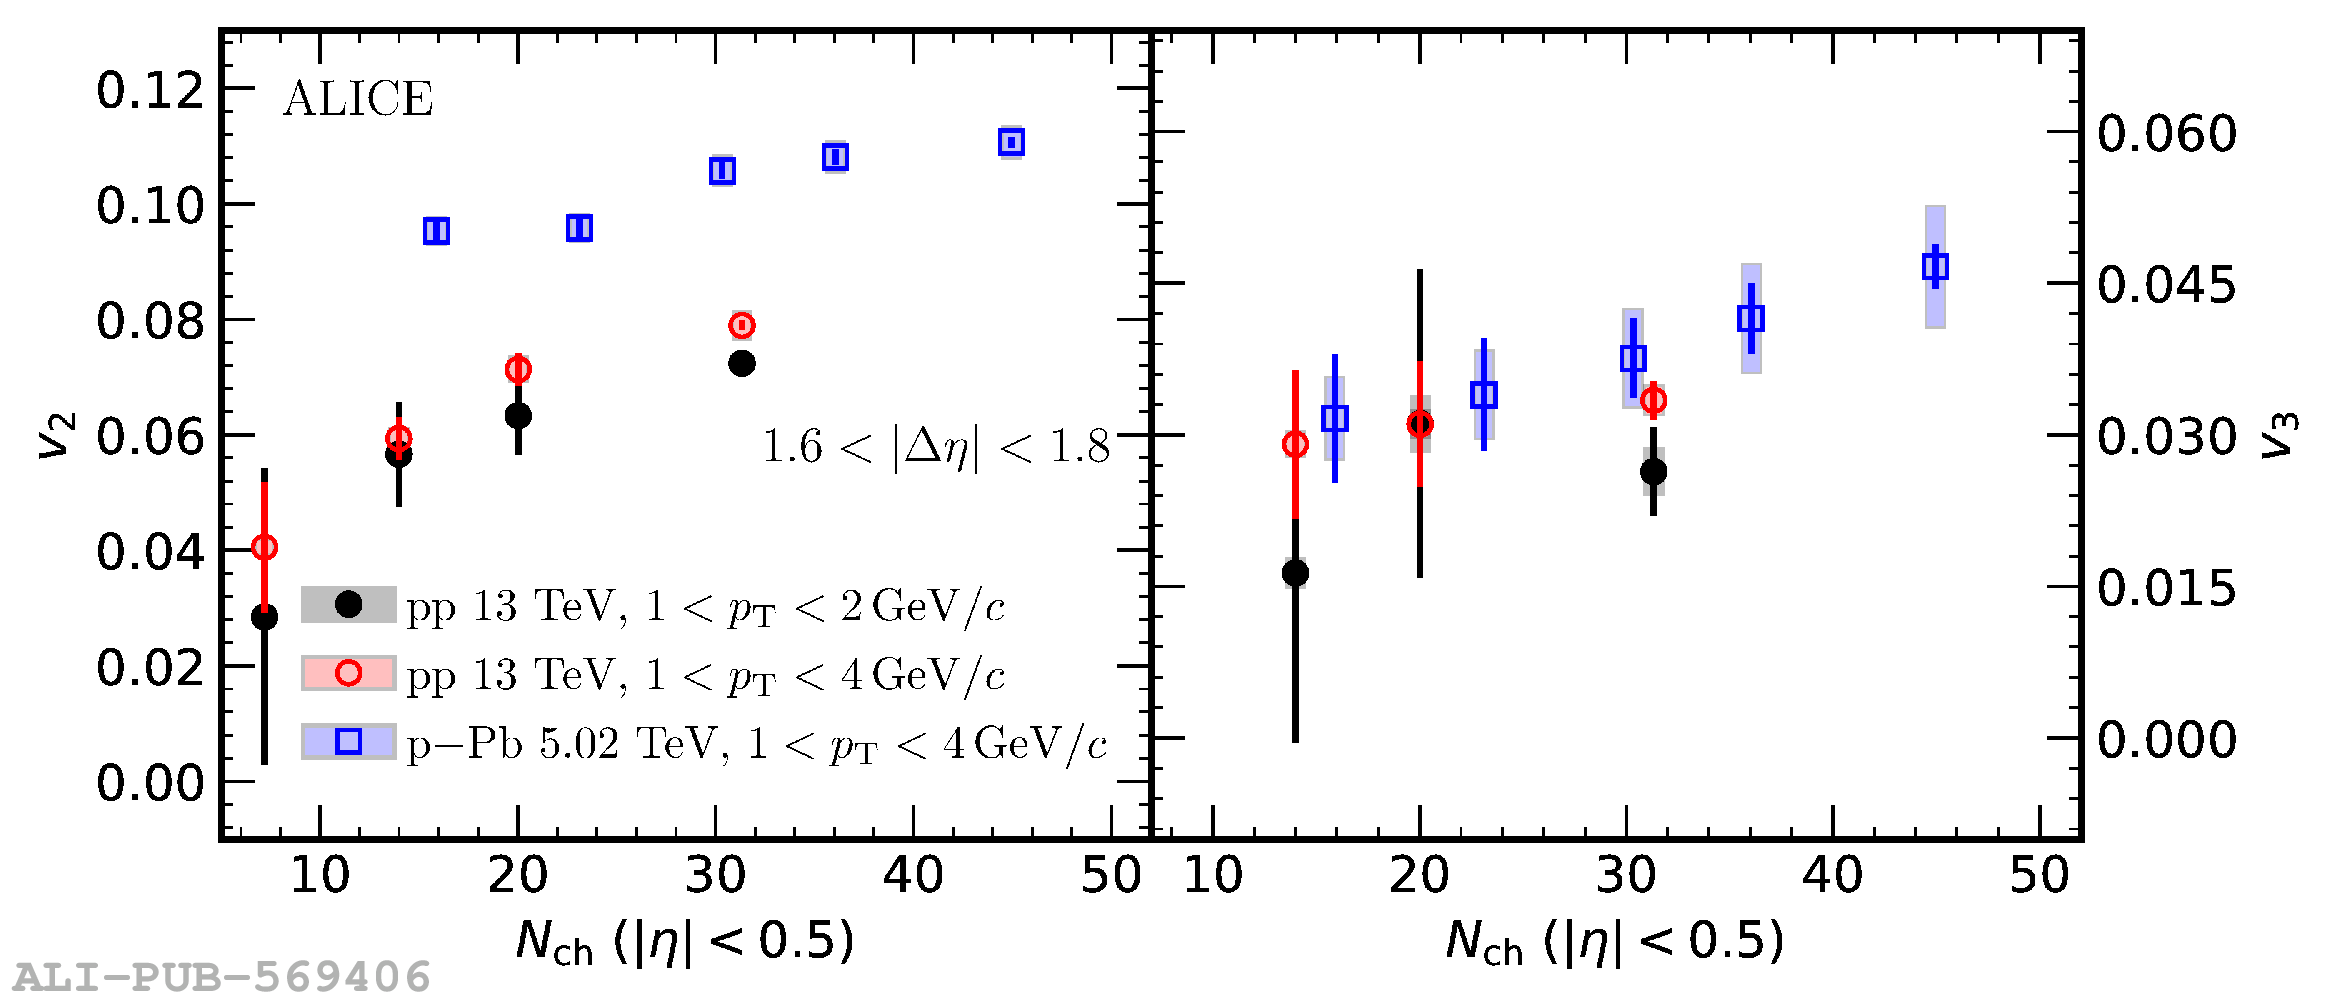 |