Corrected invariant mass spectrum for the coherent four pion photoproduction fitted with one resonance (top) and two resonance with interference (bottom) models, as described in the text. Black error bars represent the statistical error, the orange band shows the uncorrelated systematic uncertainty, and the boxes show them added in quadrature. "Prob" reflects the probability of having the given or a higher $\chi^2/\rm{ndf}$ of the fit. | 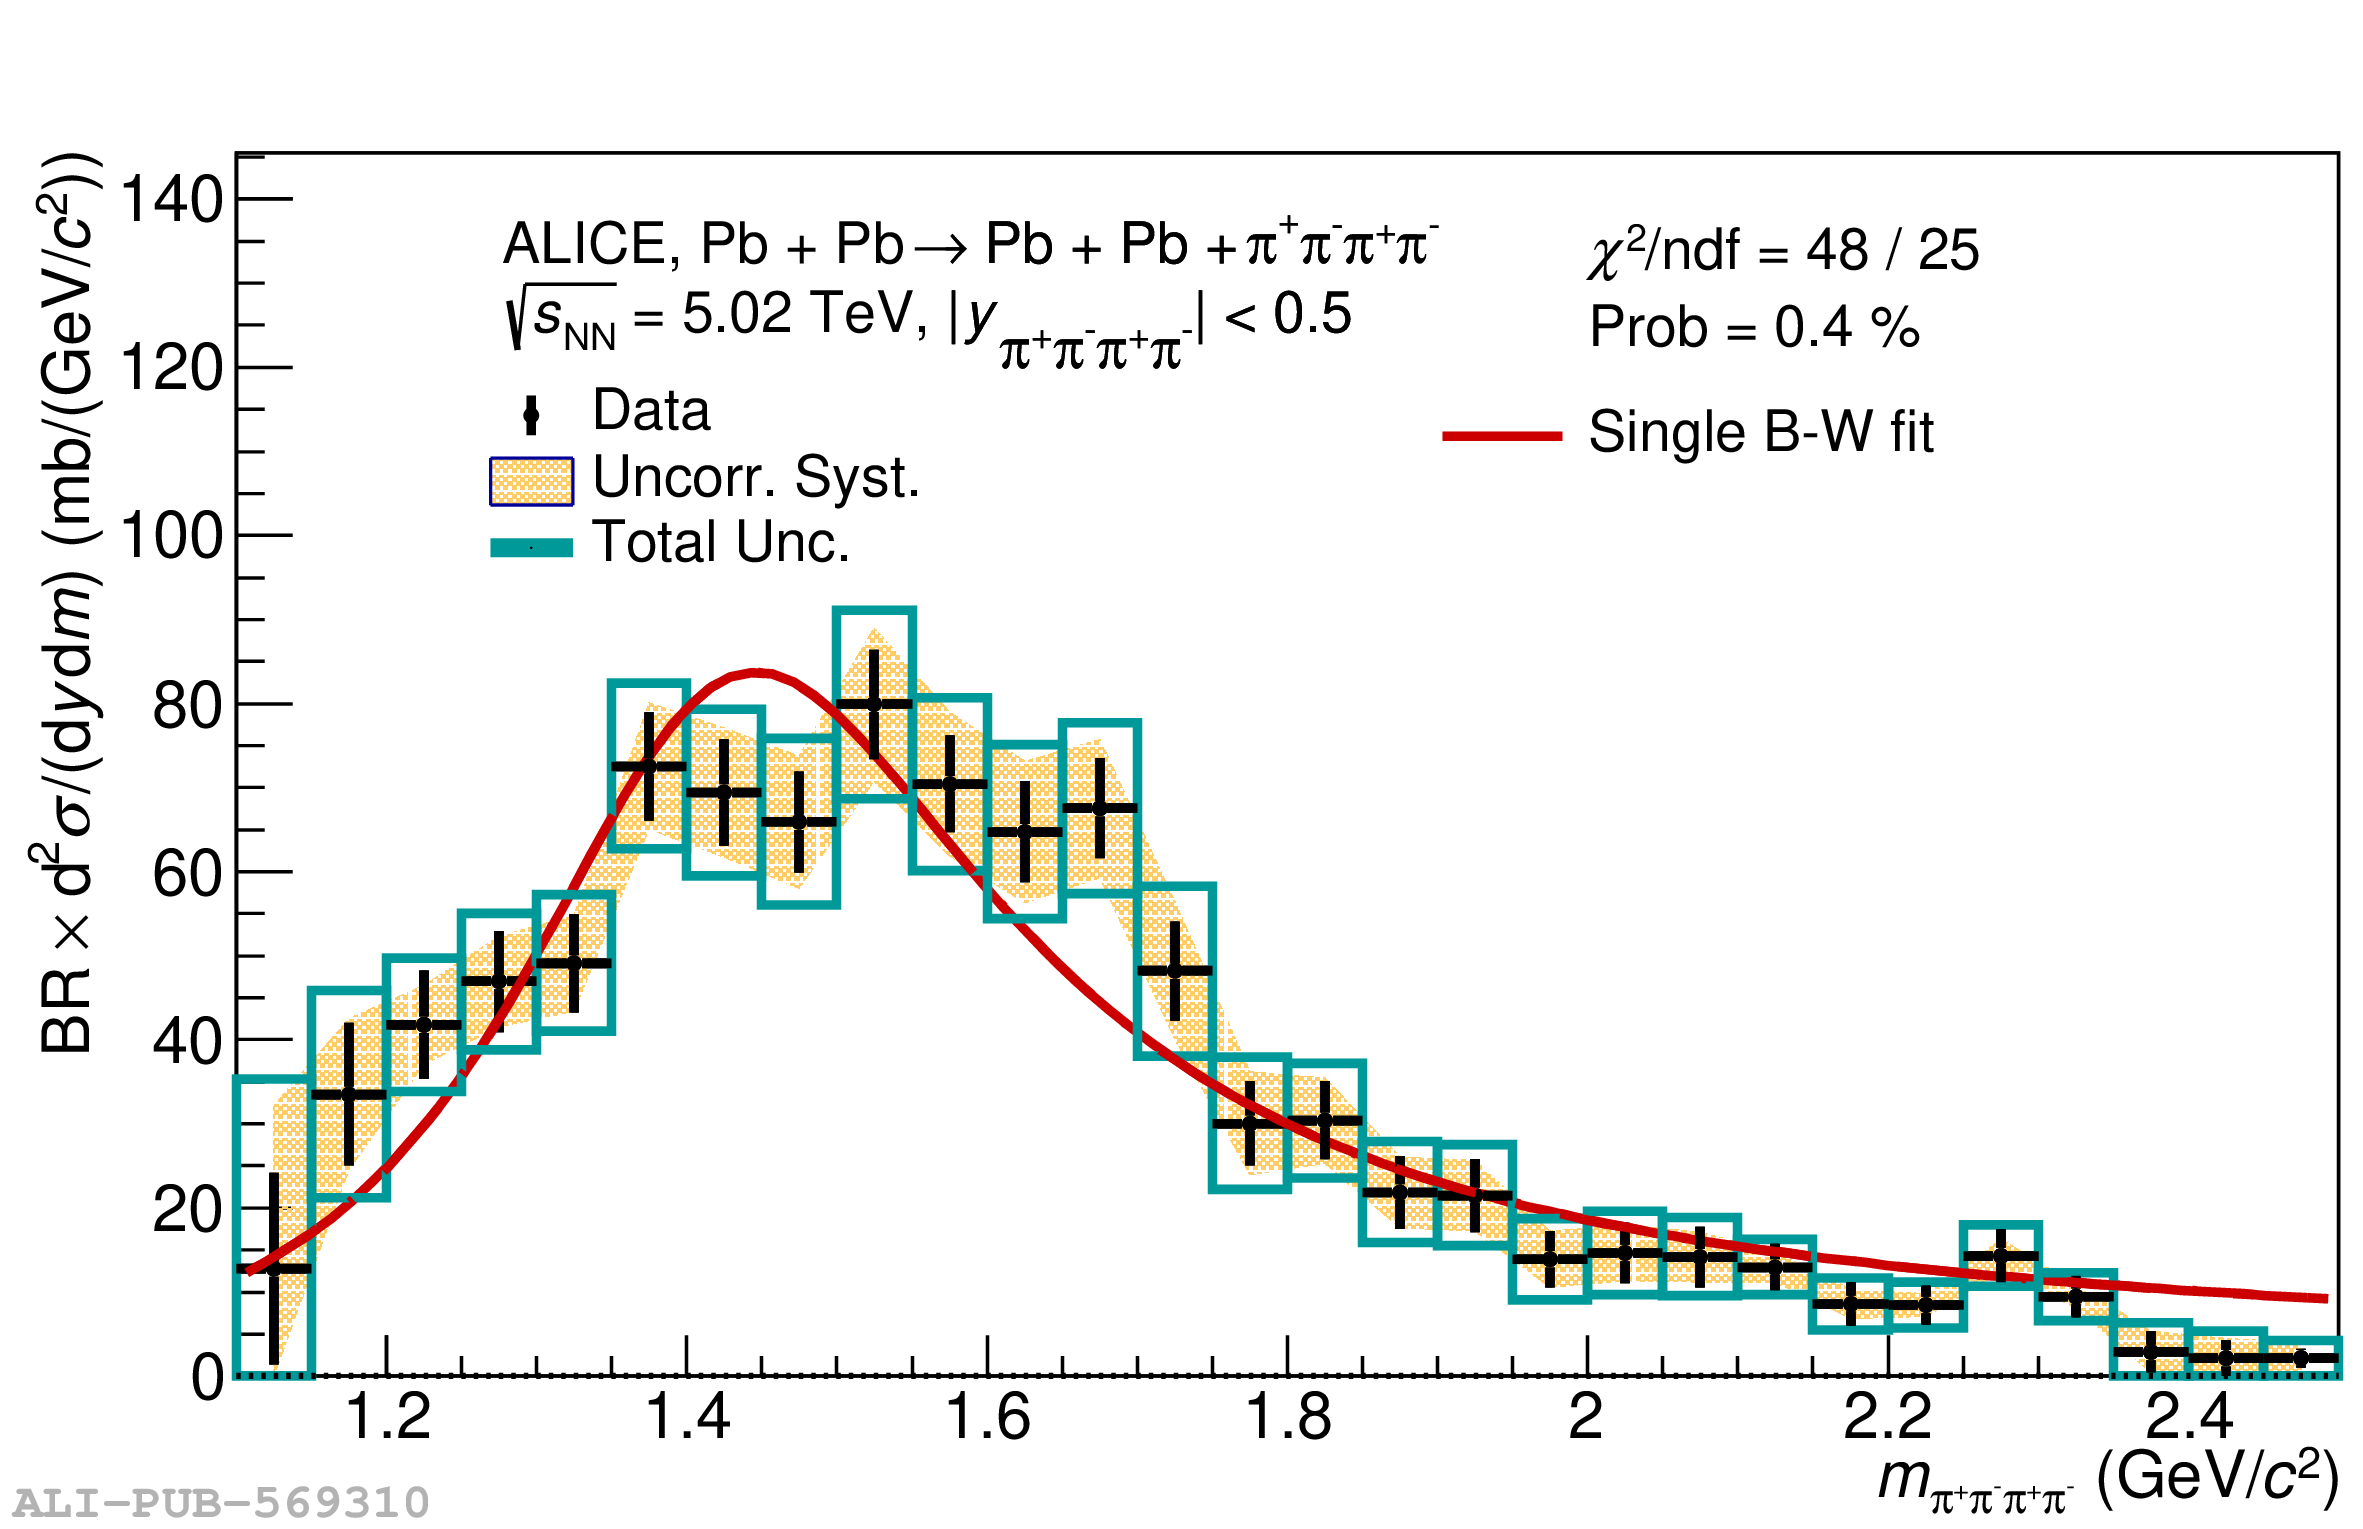 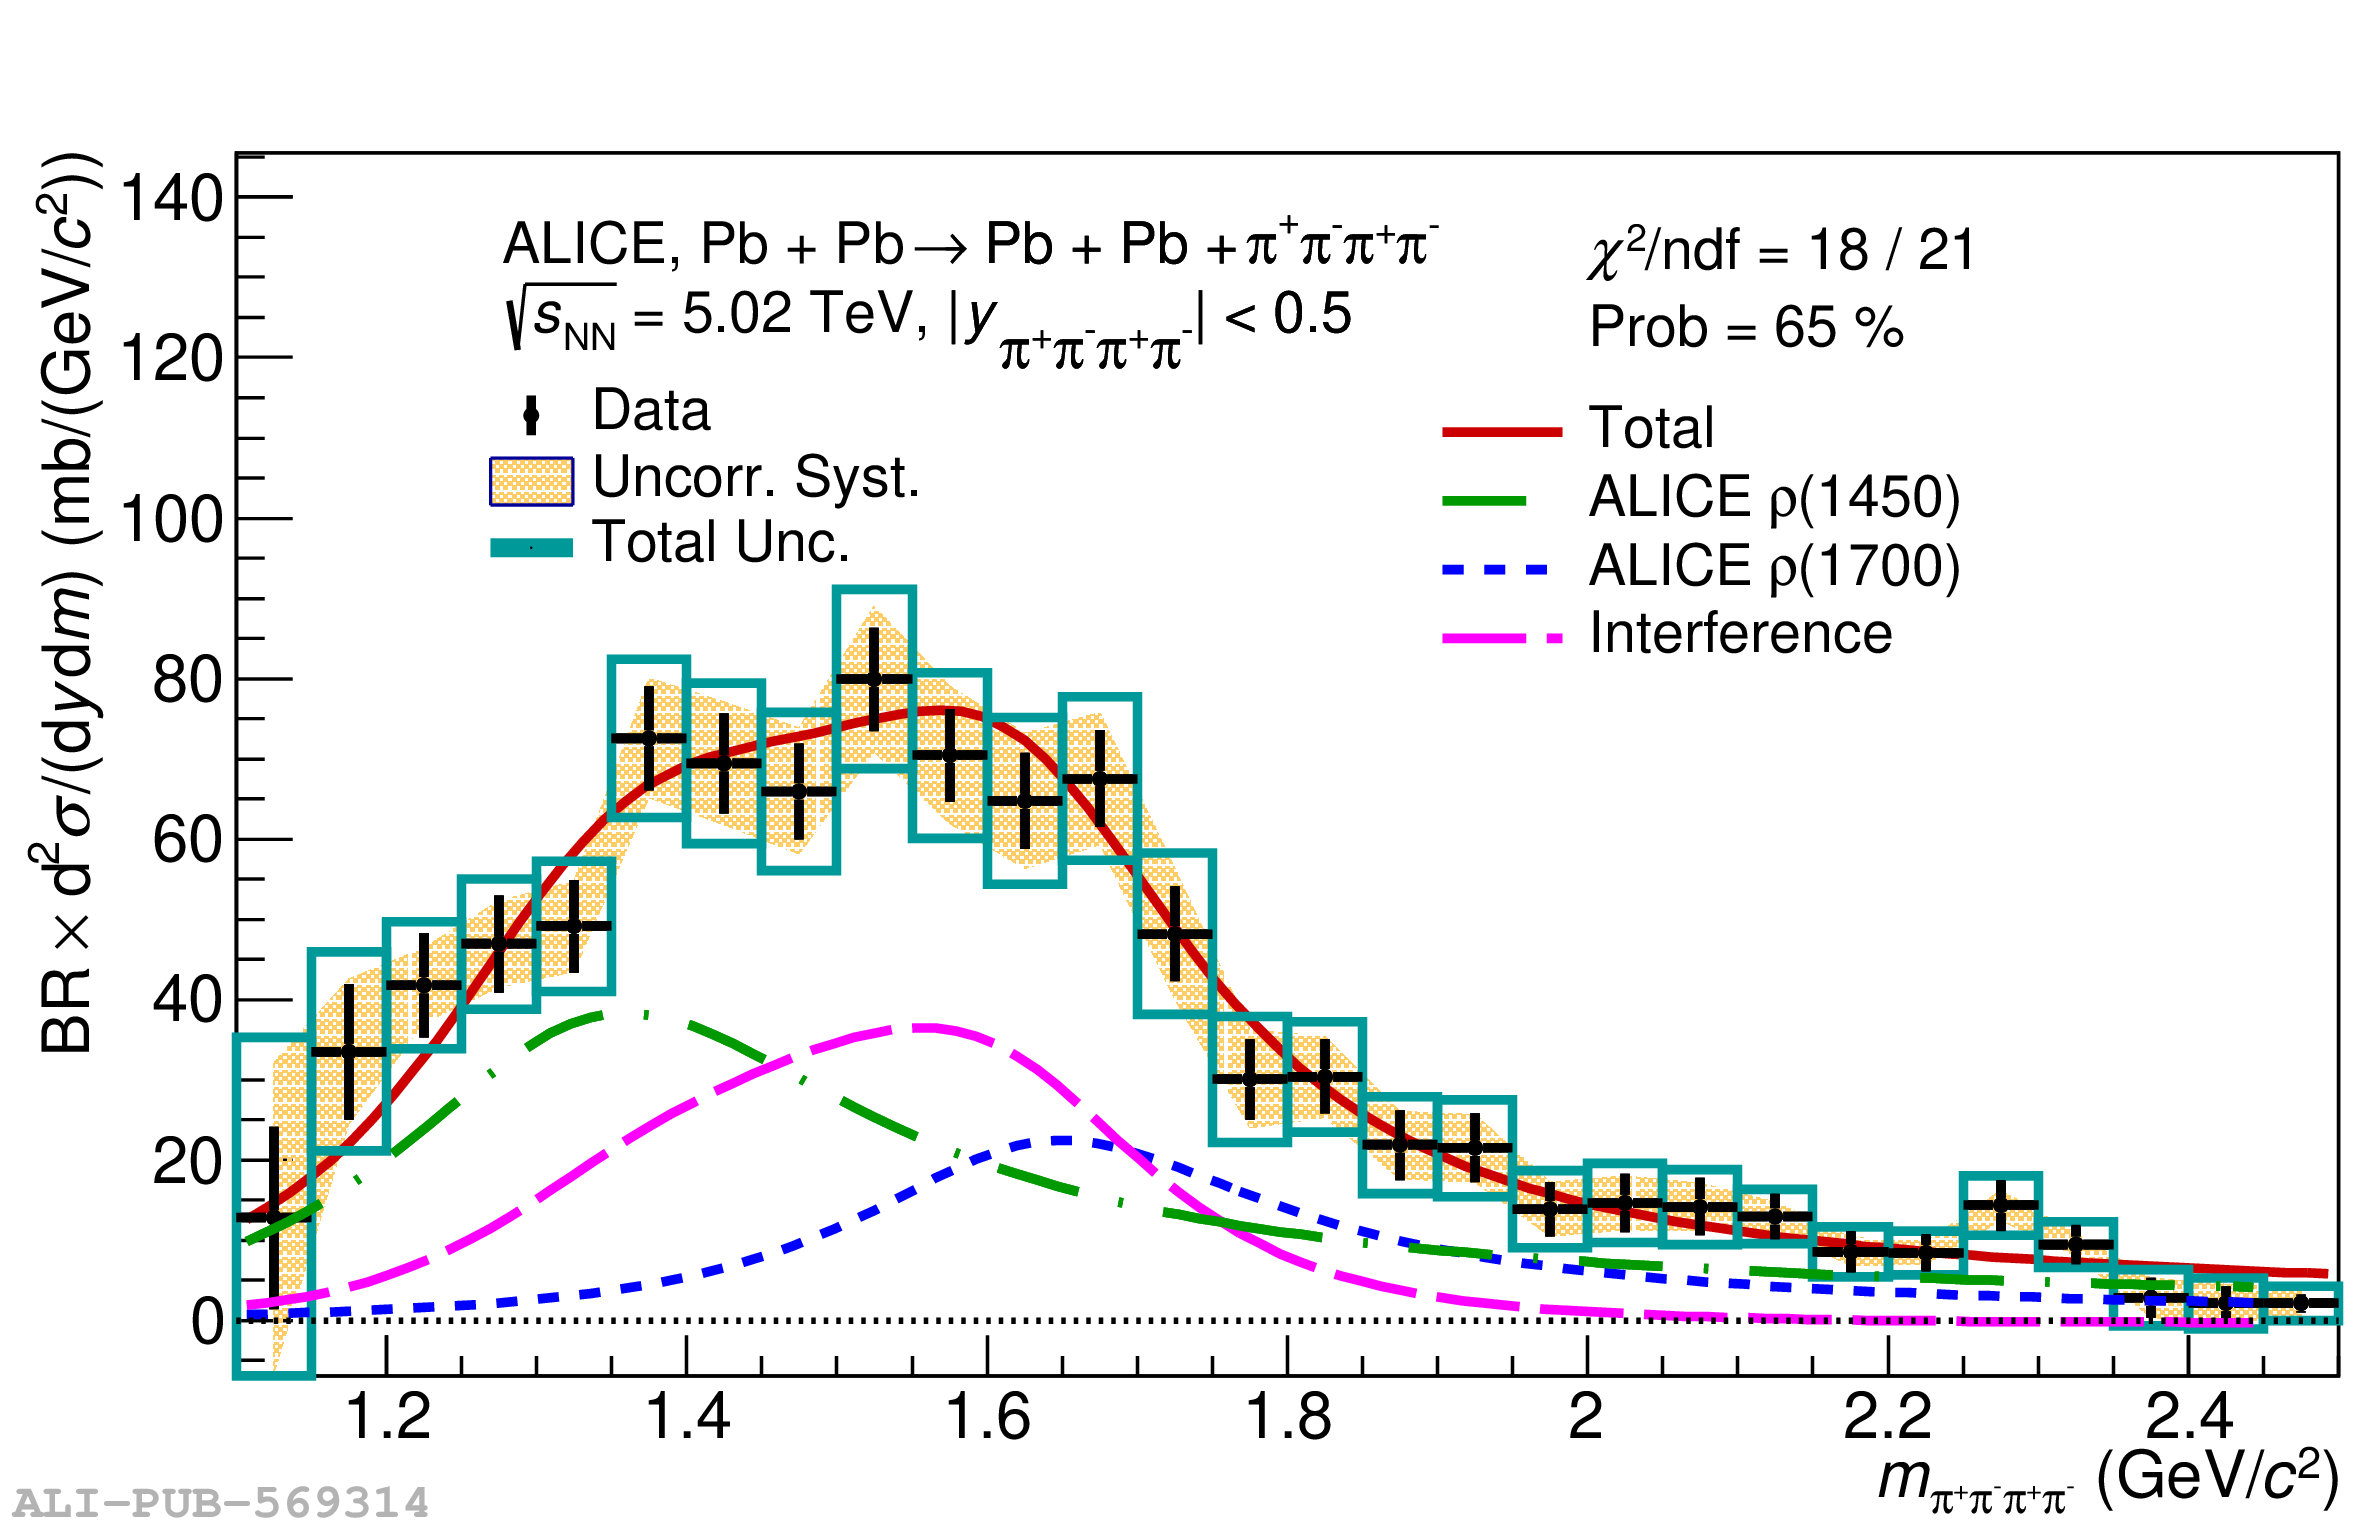 |