The inclusive J/$\psi$ production cross section, as a function of rapidity. The error bars correspond to the statistical uncertainties, the open boxes to the uncorrelated systematic uncertainties, the shaded boxes around the points represent the partially correlated systematic uncertainties. The bands correspond to the inclusive J/$\psi$ pp cross section, obtained with the interpolation procedure described in the text and scaled by the Pb-nucleus mass number $A_{\rm Pb}$. | 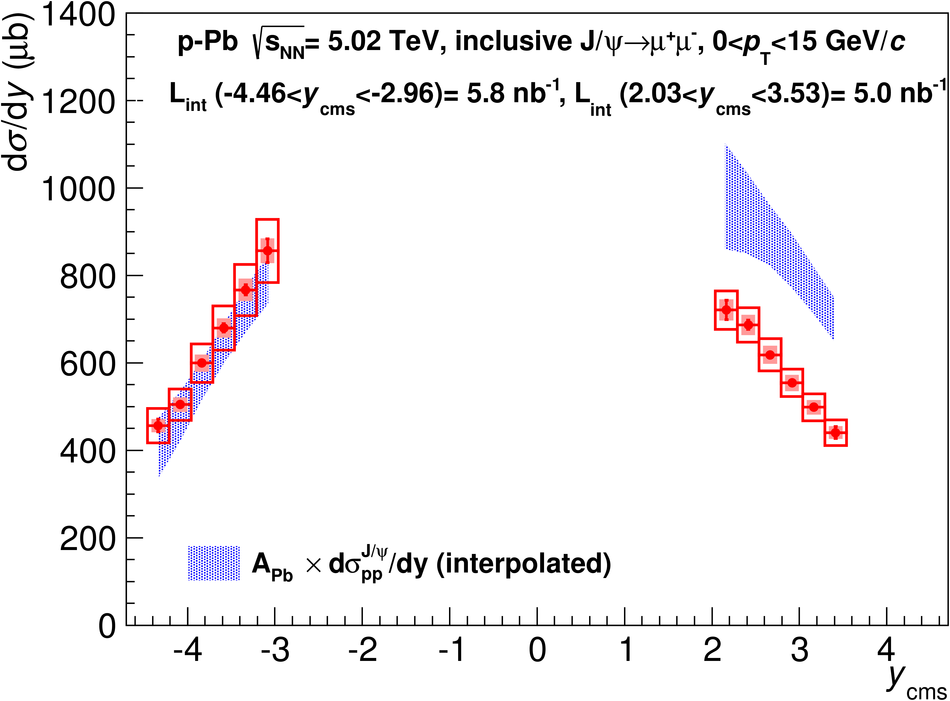 |