Invariant-mass distribution of \Dplus candidates and their charge conjugates in selected \pt and multiplicity intervals. The blue solid curves show the total fit function and the red dashed curves show the combinatorial-background contribution. The raw-yield ($S$) values are reported together with their statistical uncertainties resulting from the fit. Top row: \Dplus mesons in the $2 < \pt < 4 \GeV/c$ interval for the low multiplicity class. Bottom row: \Dplus mesons in the $1 < \pt < 24 \GeV/c$ interval for the high multiplicity class. The corresponding BDT probability minimum threshold for the candidate selection is reported. The left (right) column corresponds to the prompt (non-prompt) \Dplus meson candidates dominated sample. | 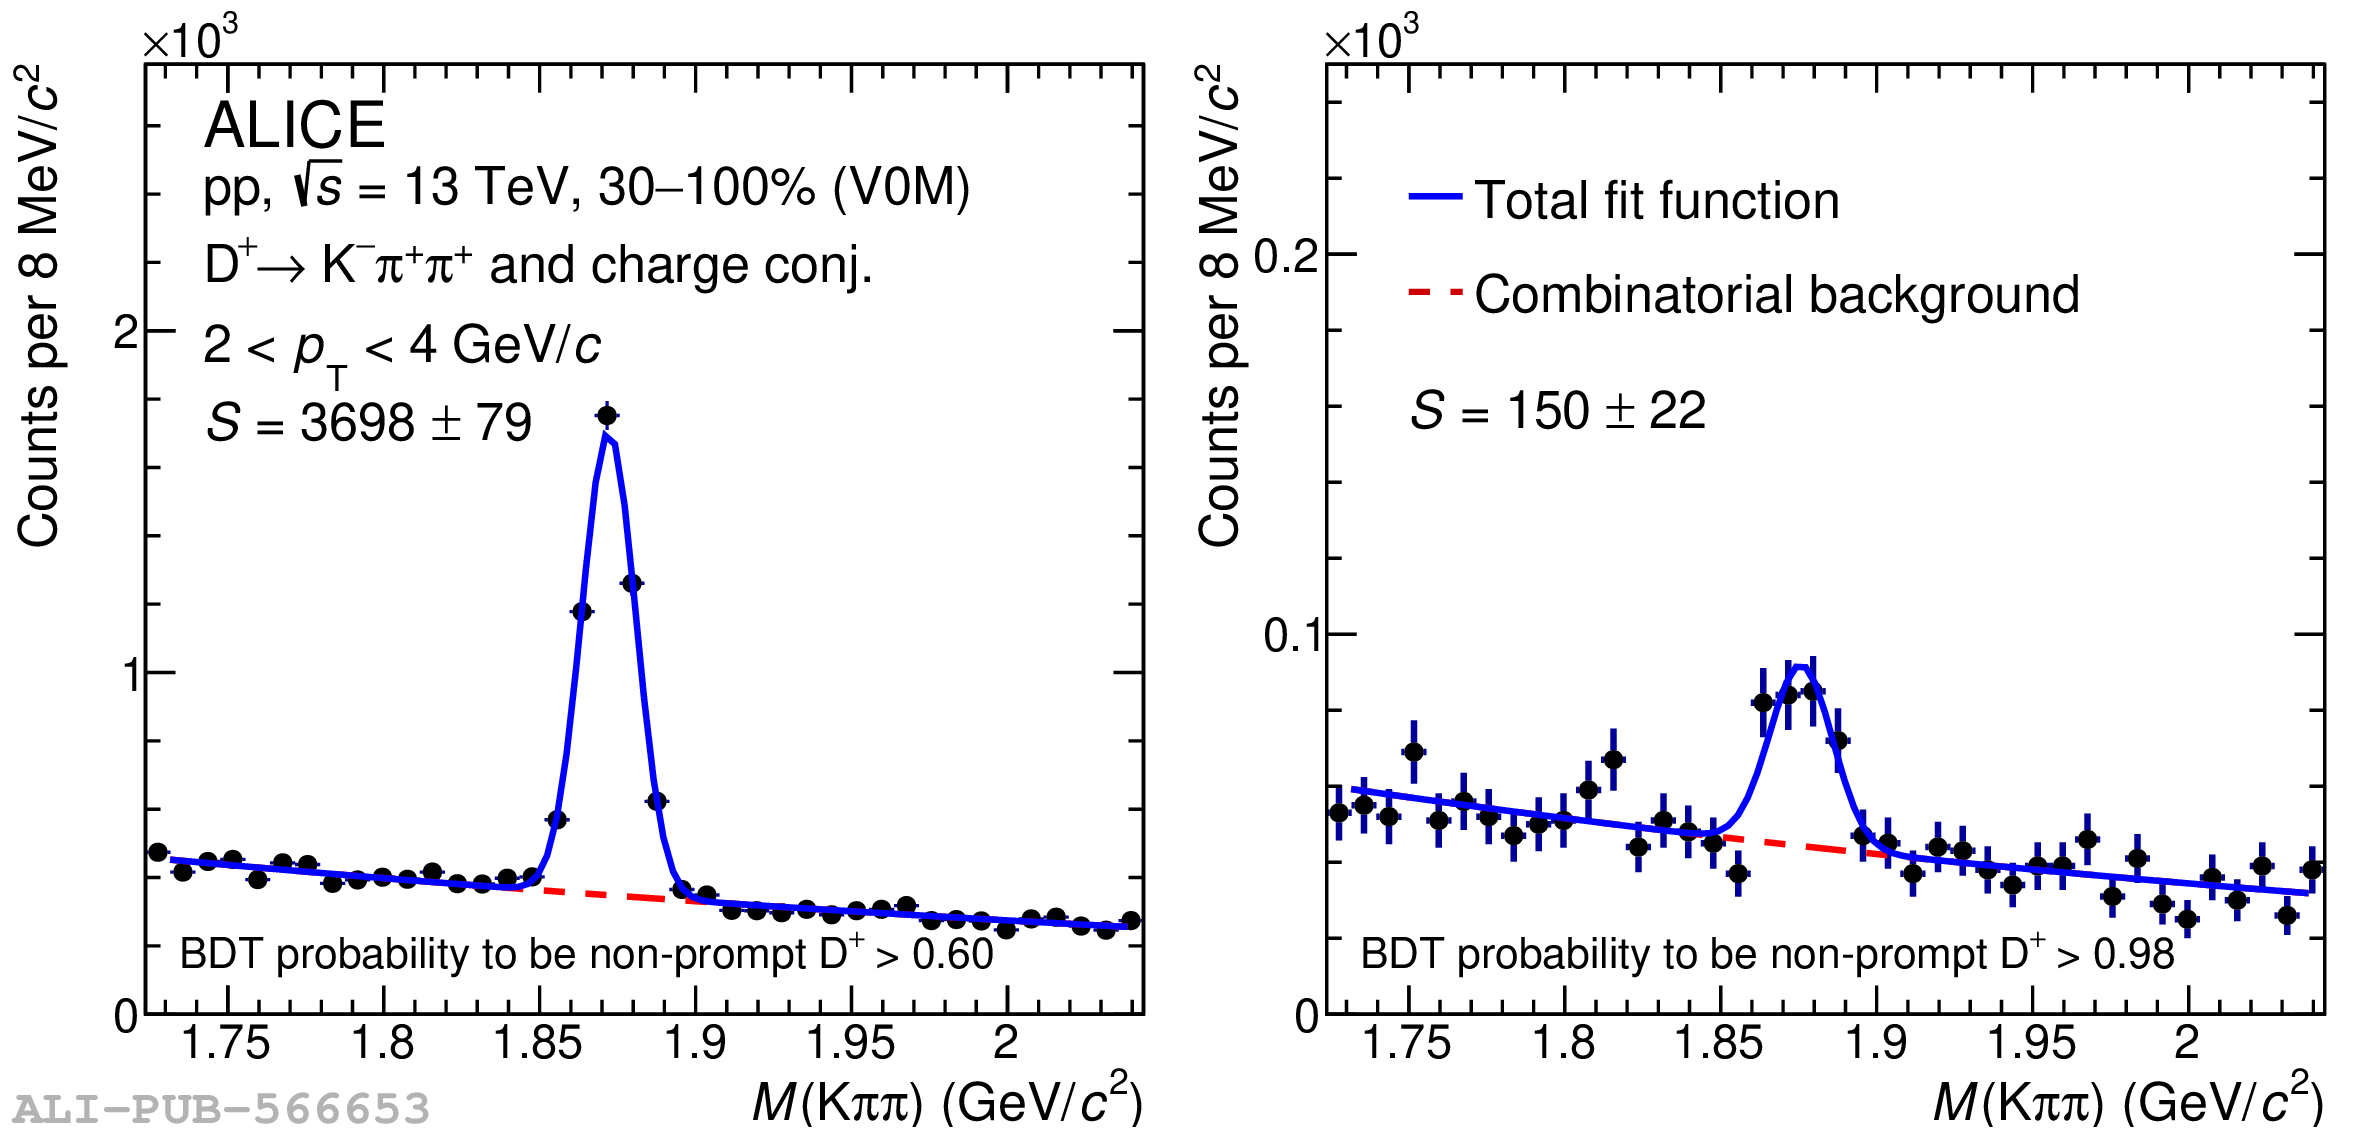  |