Confidence regions for the relative fraction of direct ${\rm K^+K^-}$ contribution with respect to the amplitude of $\phi (1020) \rightarrow {\rm K^+K^-}$ ($|B_{\rm{KK}}/A_{\phi}|$) and the relative phase angle between $\phi(1020)\rightarrow {\rm K^+K^-}$ and direct ${\rm K^+K^-}$ ($\varphi$). The best fit is shown as a red dot at $|B_{\rm{KK}}/A_{\phi}|=0.28$ $({\rm GeV}/c^2)^{-1/2}$ and $\varphi = $ 0.06 rad found with $\chi^{2}/\rm{ndf_{best\ fit}} = 0.3$, while a pink square at the $|B_{\pi\pi}/A_{\rho}|=0.54\ \pm\ 0.01$ (stat.) $\pm\ 0.02 $ (syst.) $({\rm GeV}/c^2)^{-1/2}$ and relative phase angle $\varphi = 1.46\ \pm\ 0.11$ (stat.) $\pm\ 0.07 $ (syst.) rad indicates the best-fit values for $\rho$ plus direct $\pi^+\pi^-$. The green solid line and blue dashed line represent the boundary of 68% and 95% confidence regions, respectively. | 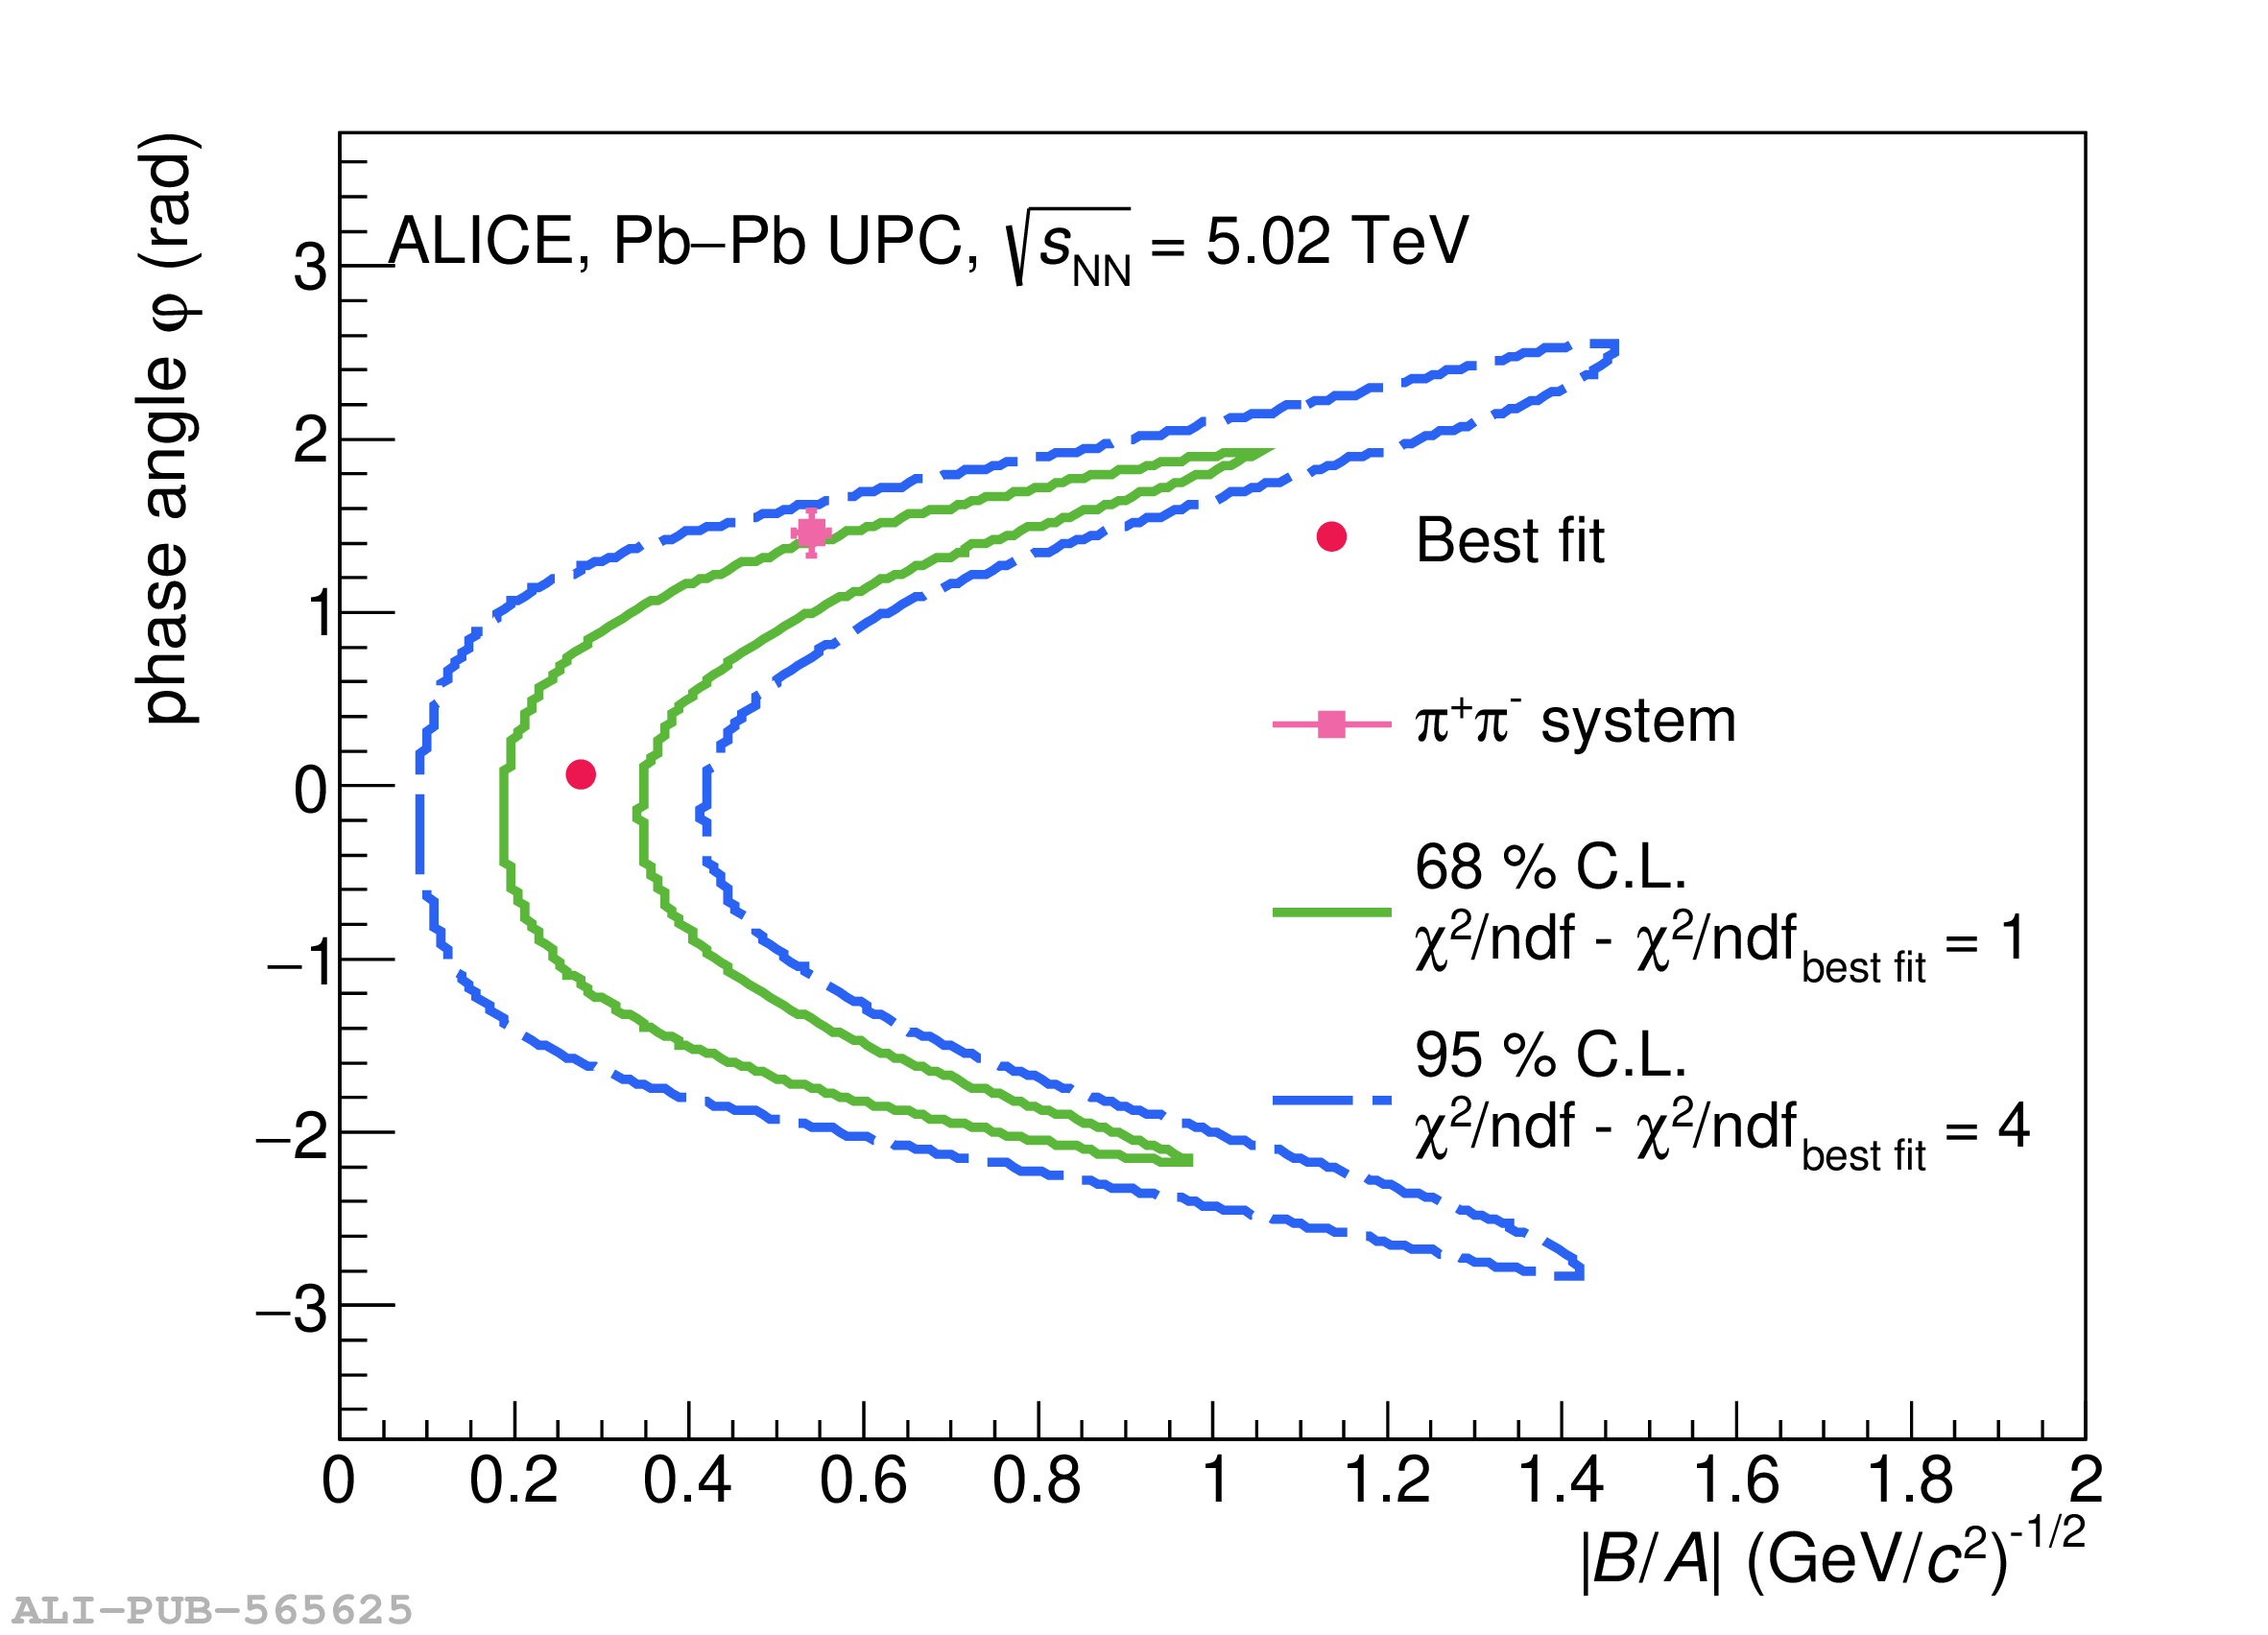 |