Panel a) shows the correlation function for p$-$p$-\overline{\rm p}$ triplets (green data points) and the total lower order contributions (grey band). Panels b) and c) show the (p$-$p$)-\overline{\rm p}$ and (p$-\overline{\rm p})-$p lower-order contributions to the measured p$-$p$-\overline{\rm p}$ correlation function. The error bars and the boxes represent the statistical and systematic uncertainties, respectively. The grey band includes systematic and statistical uncertainties summed in quadrature obtained from the projector method. | 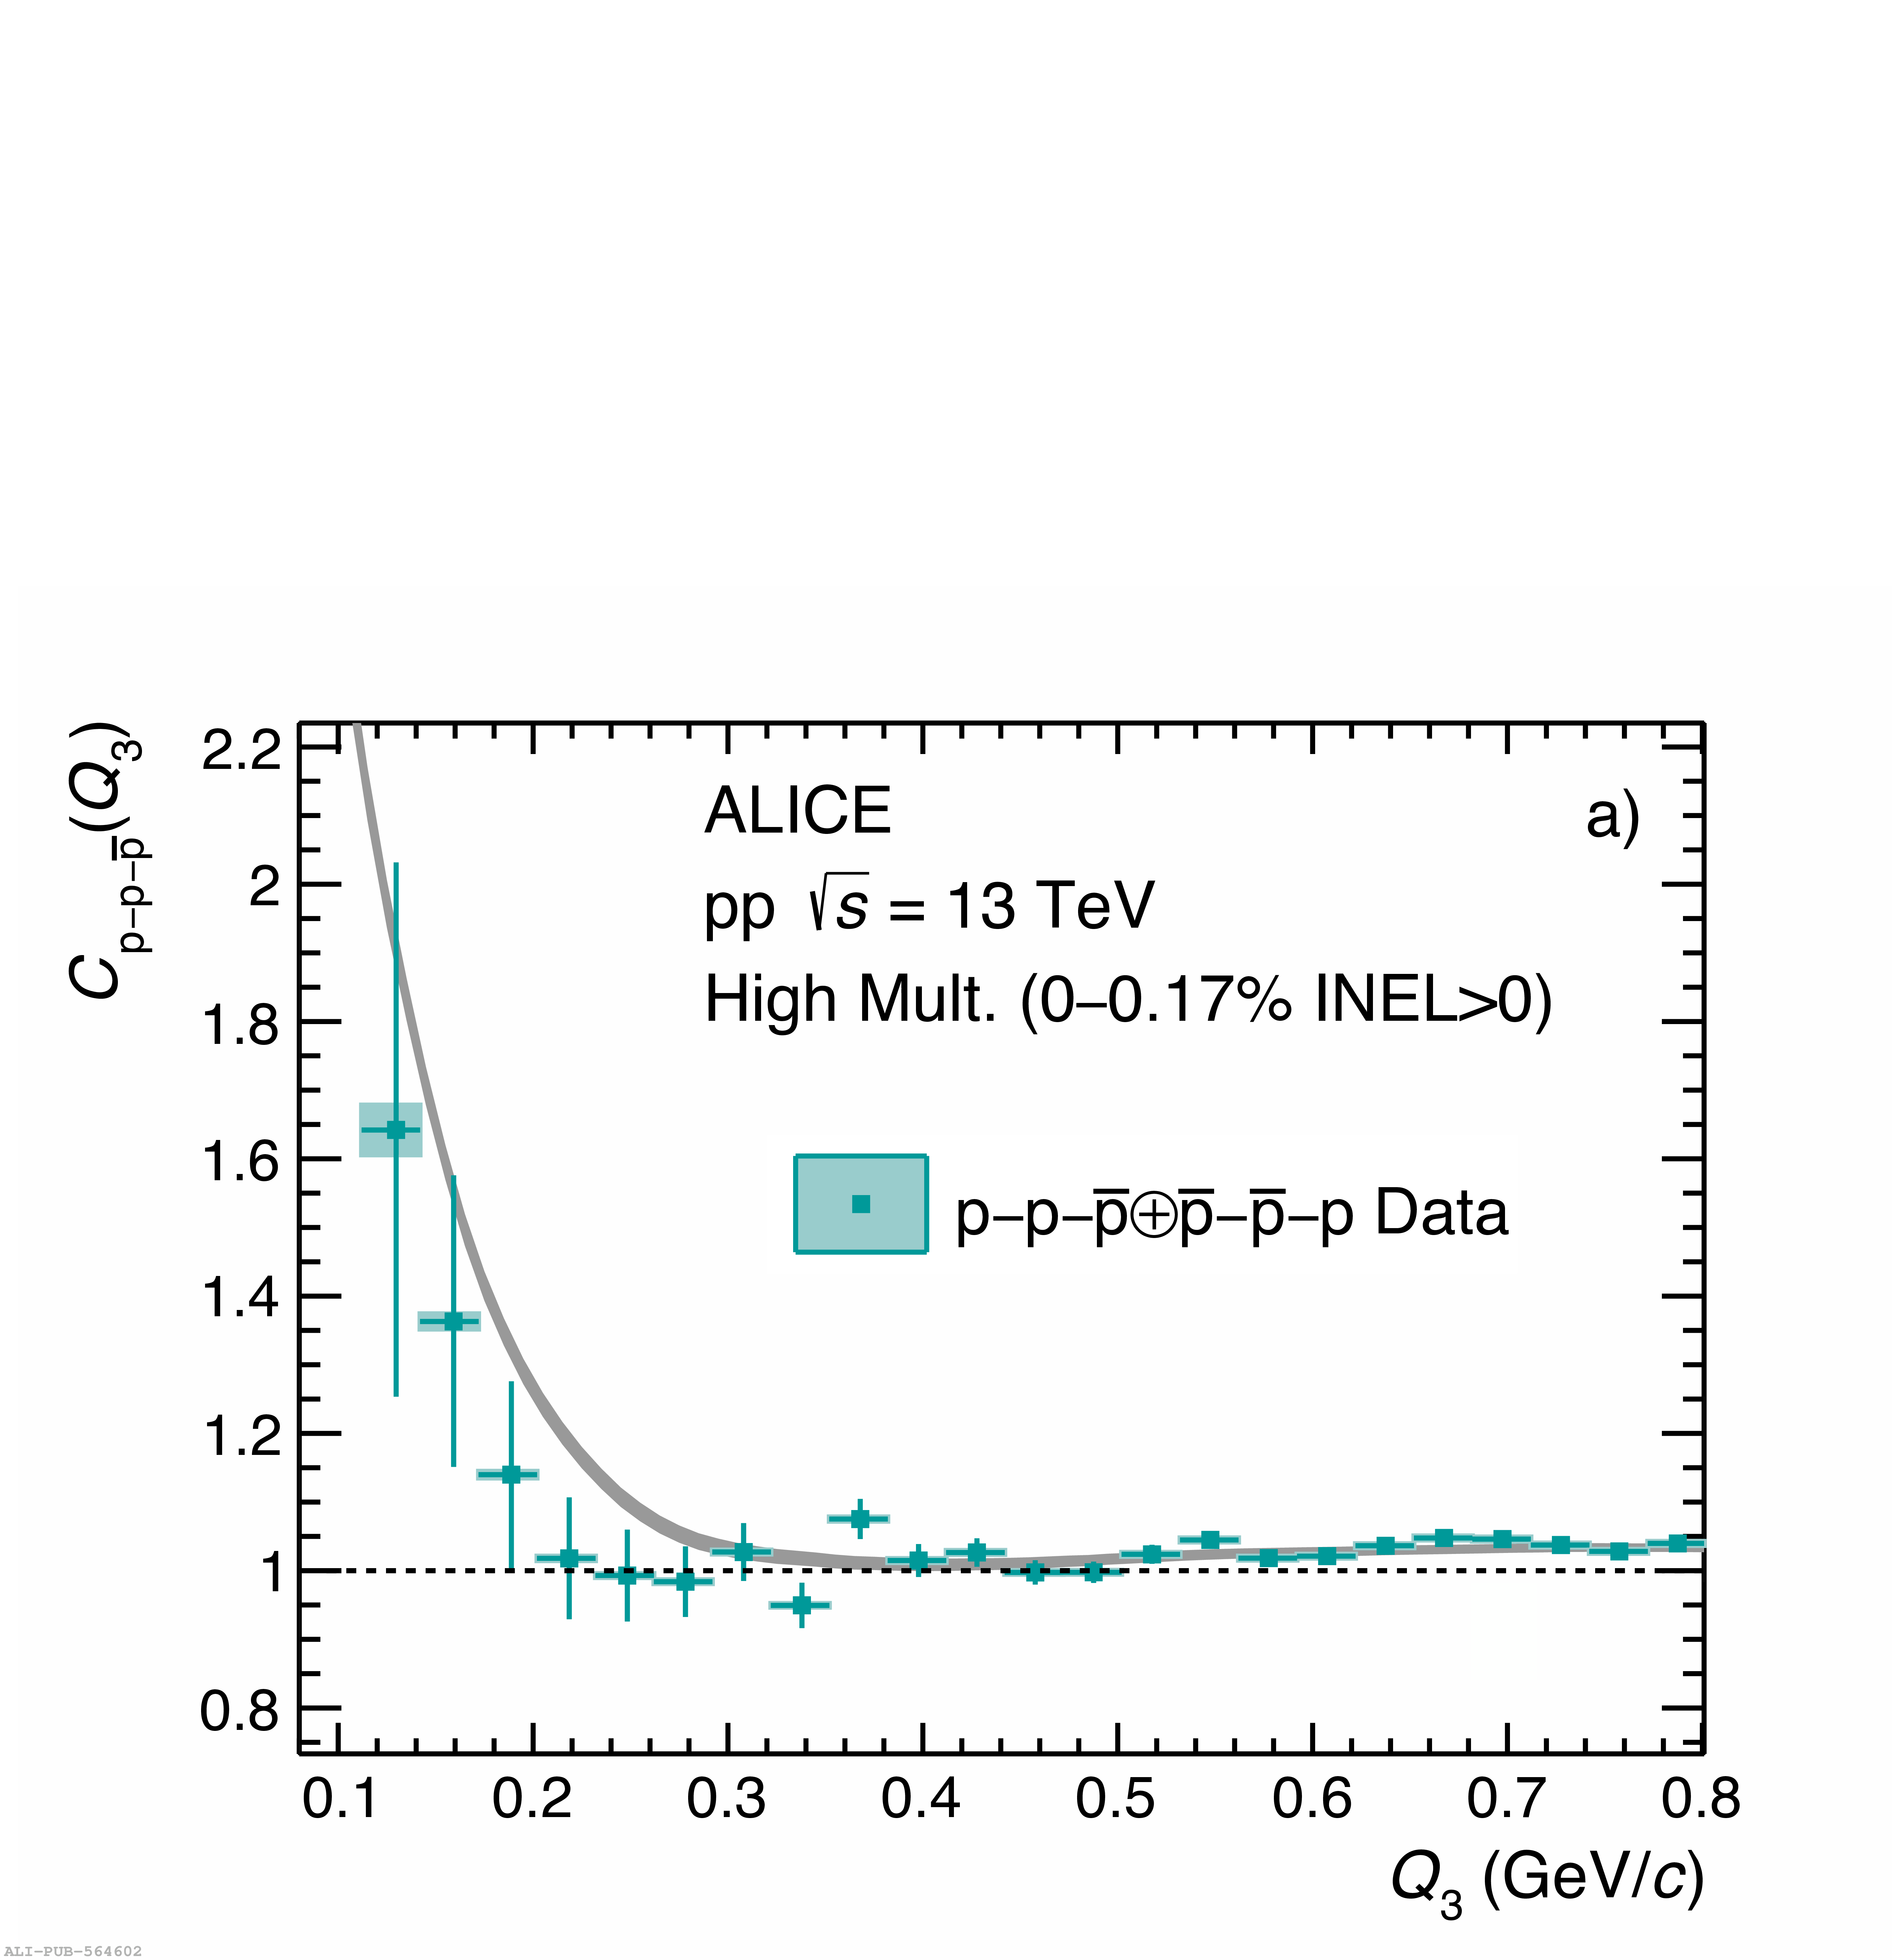 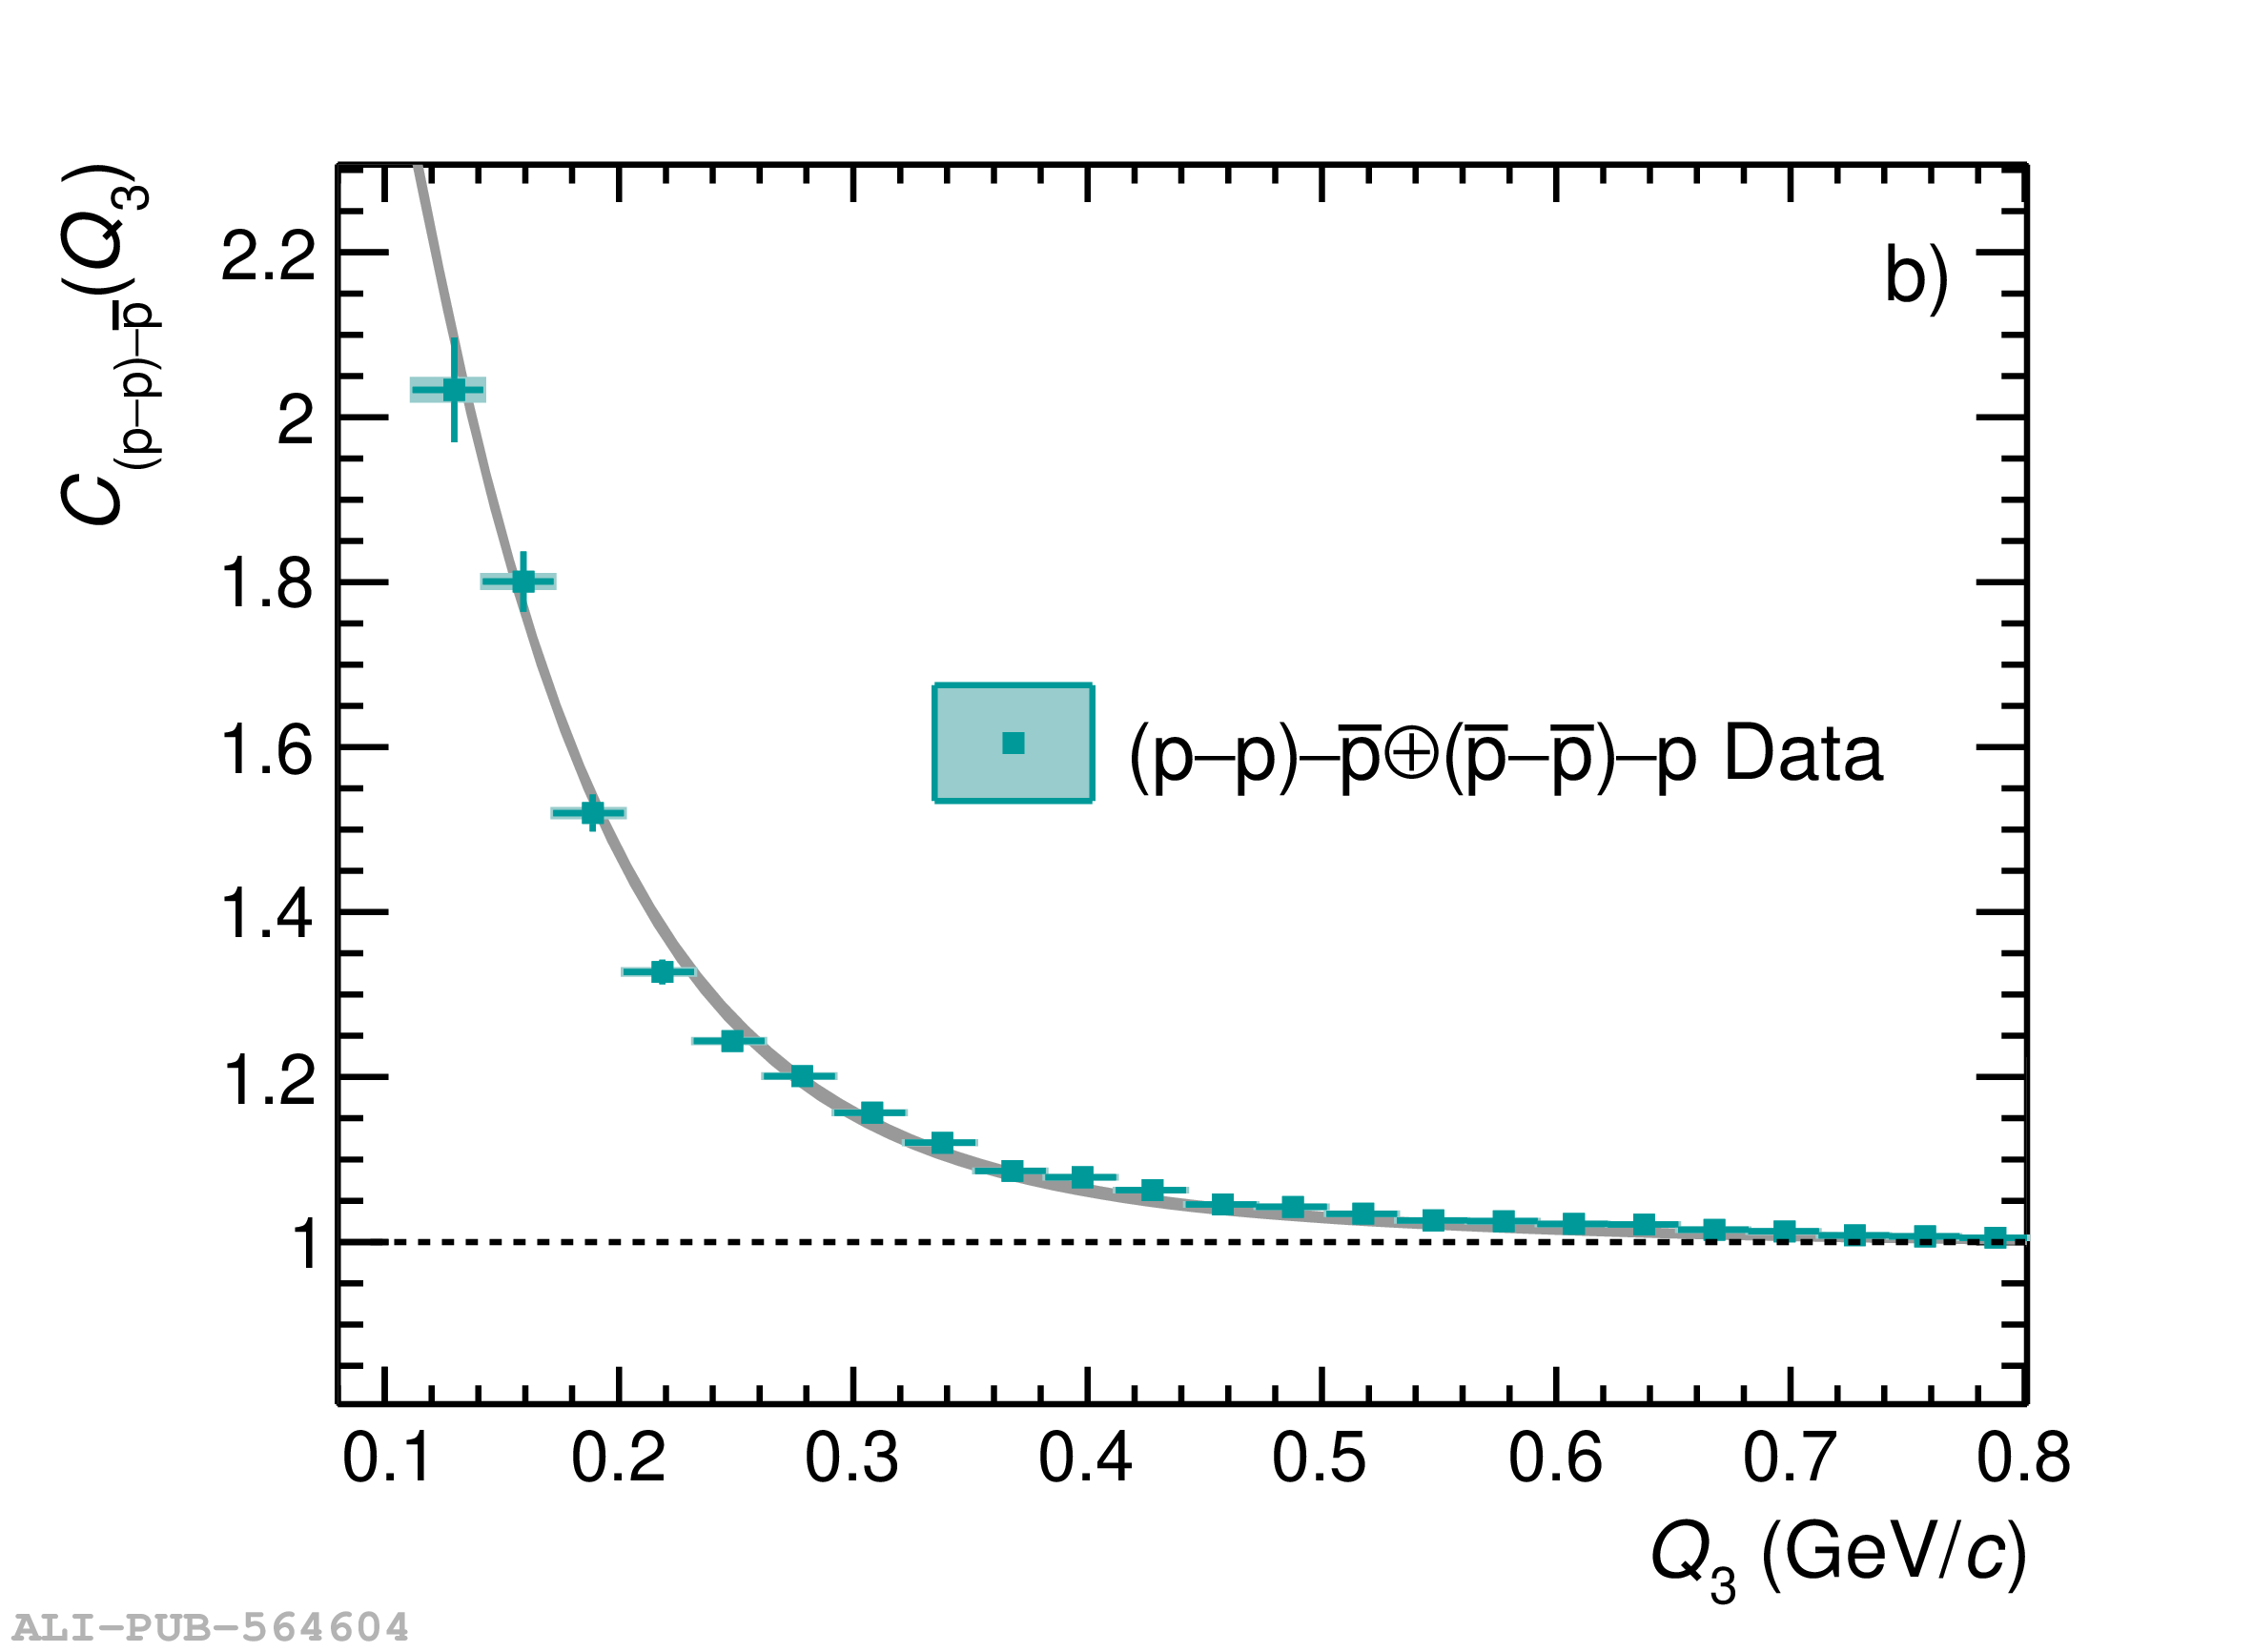 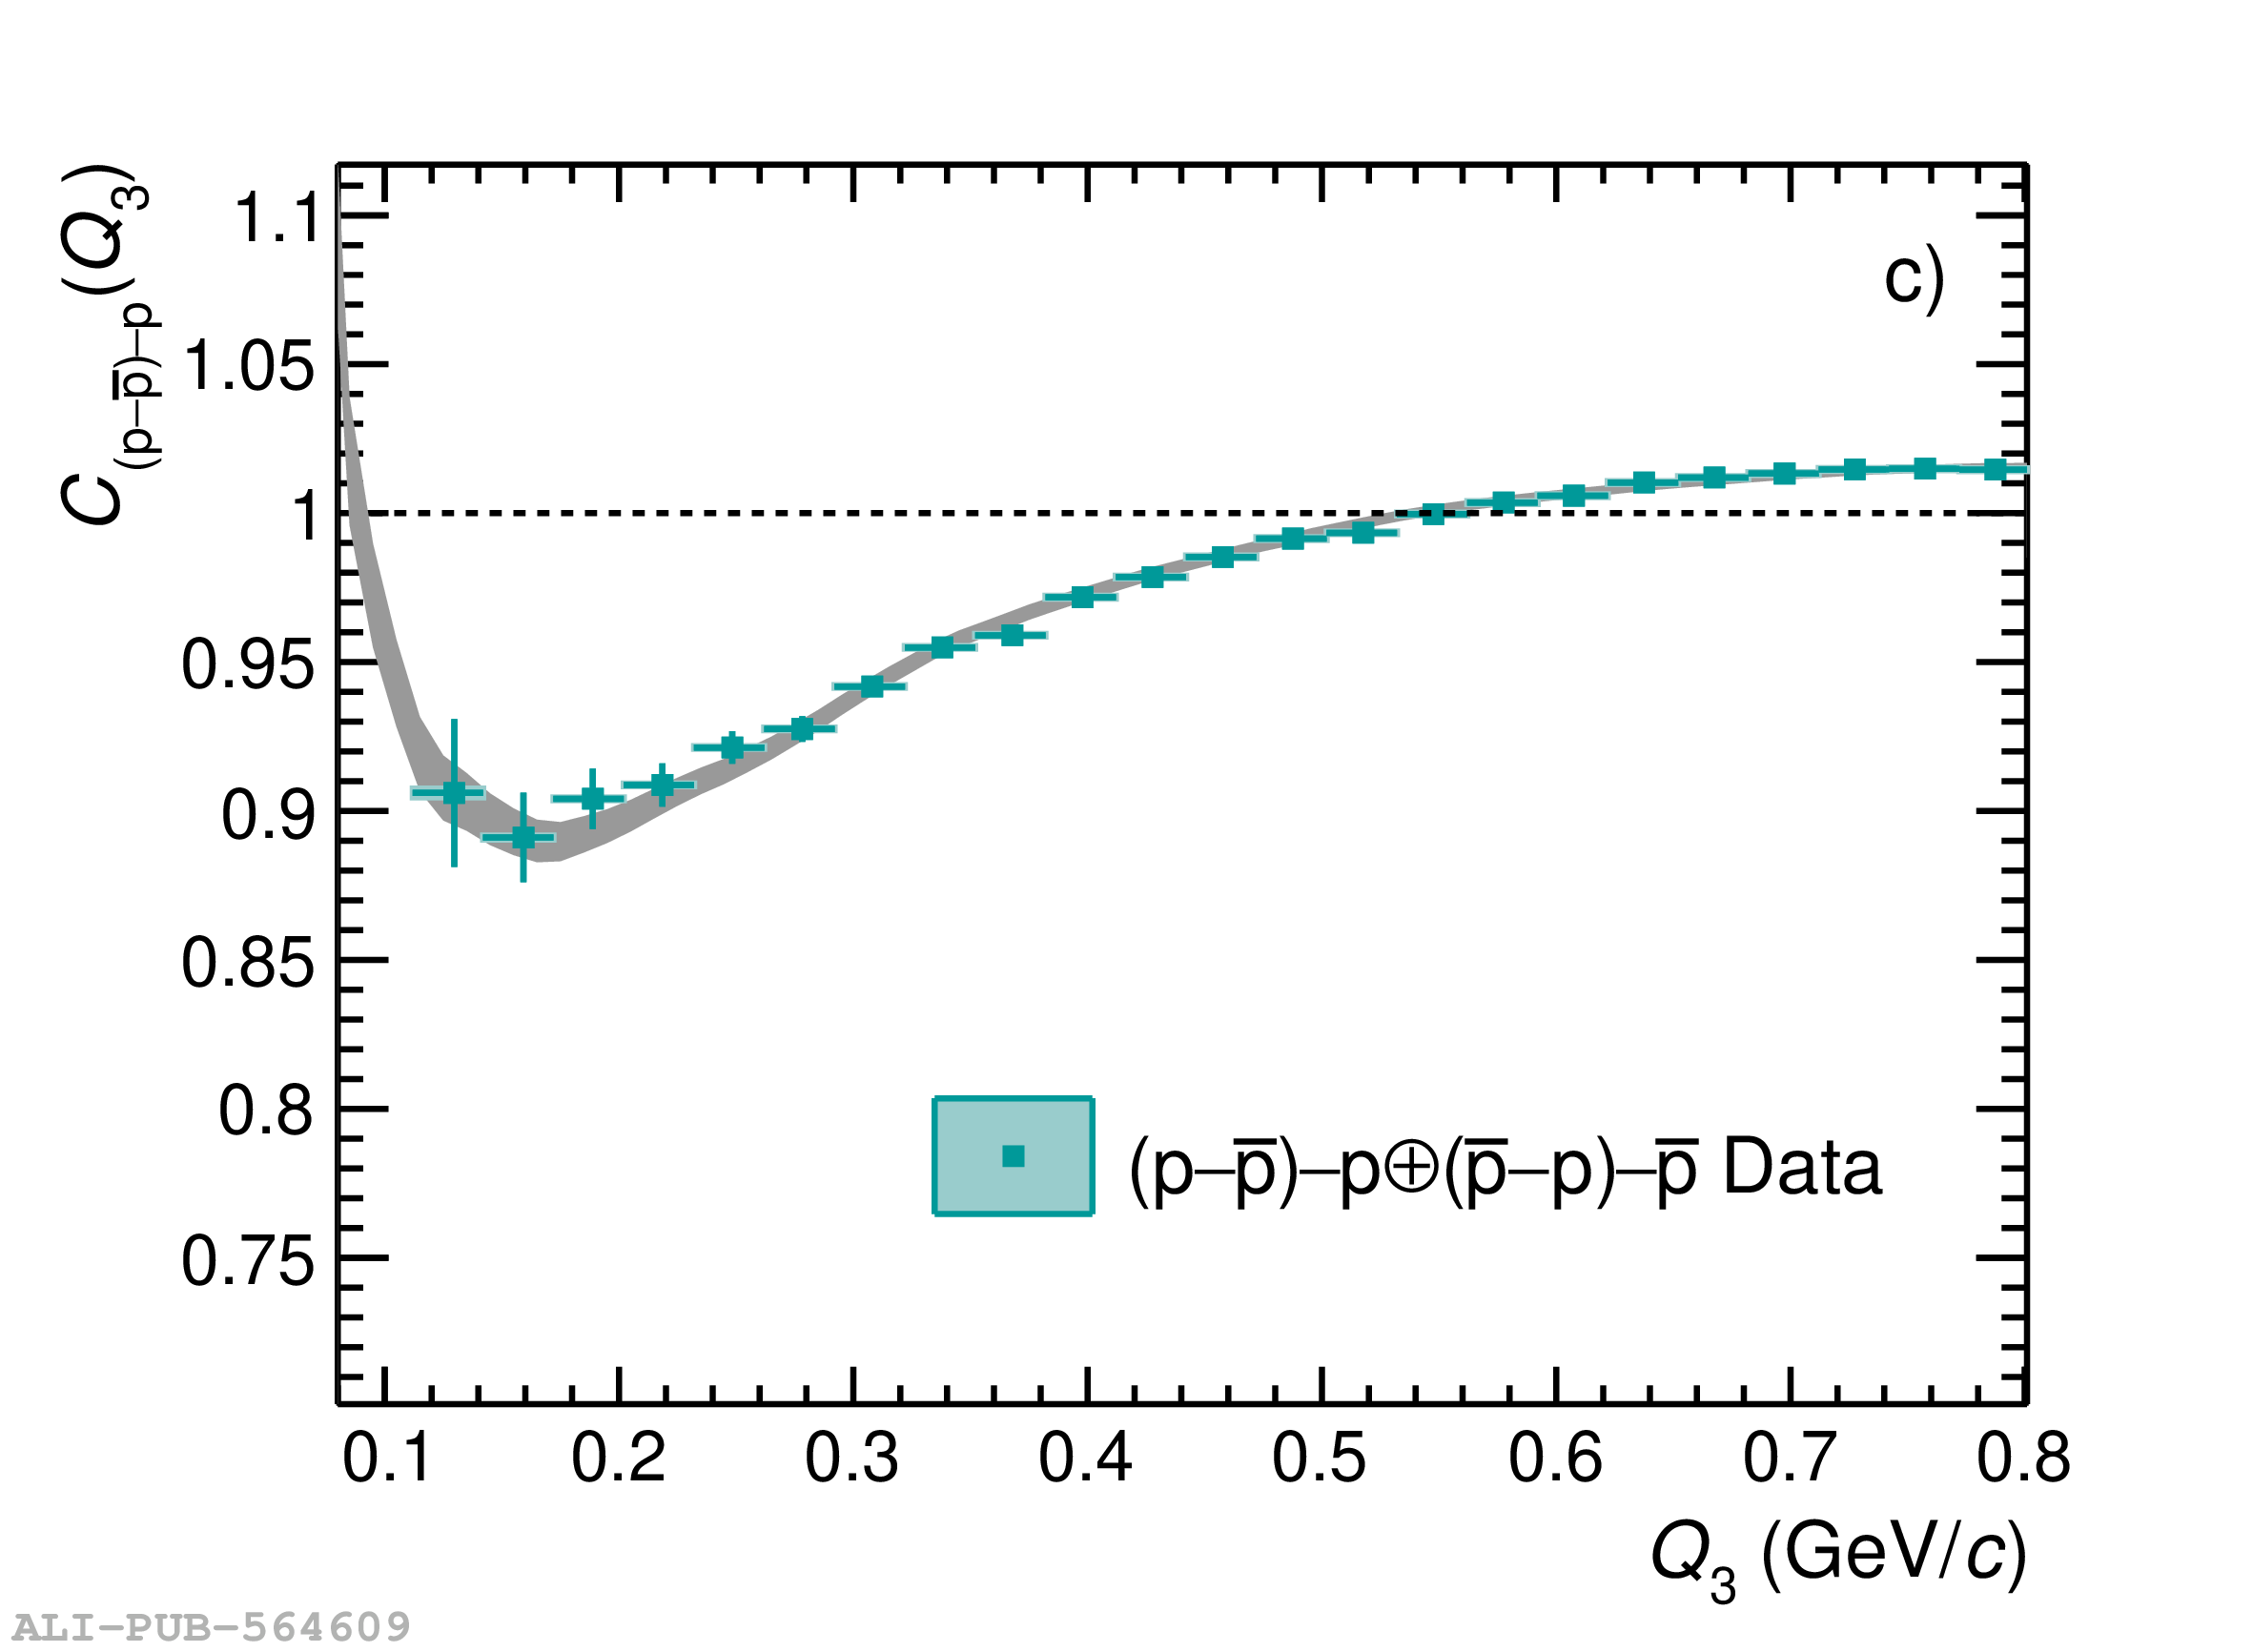 |