The upper panels show the comparison of the two-particle correlations projected on three-particle phase space obtained using the data-driven approach based on event mixing (green points) and the projector method (grey band). The resulting correlation functions are shown for (p$-$p)$-$p (panel a), (p$-$p)$-\Lambda$ (panel b) and p$-$(p$-\Lambda$) (panel c) cases. The error bars and the boxes represent the statistical and systematic uncertainties, respectively. The grey band includes systematic and statistical uncertainties summed in quadrature. The lower panels show the deviations between the data-driven approach and the projector method, expressed in terms of $n_\sigma$. | 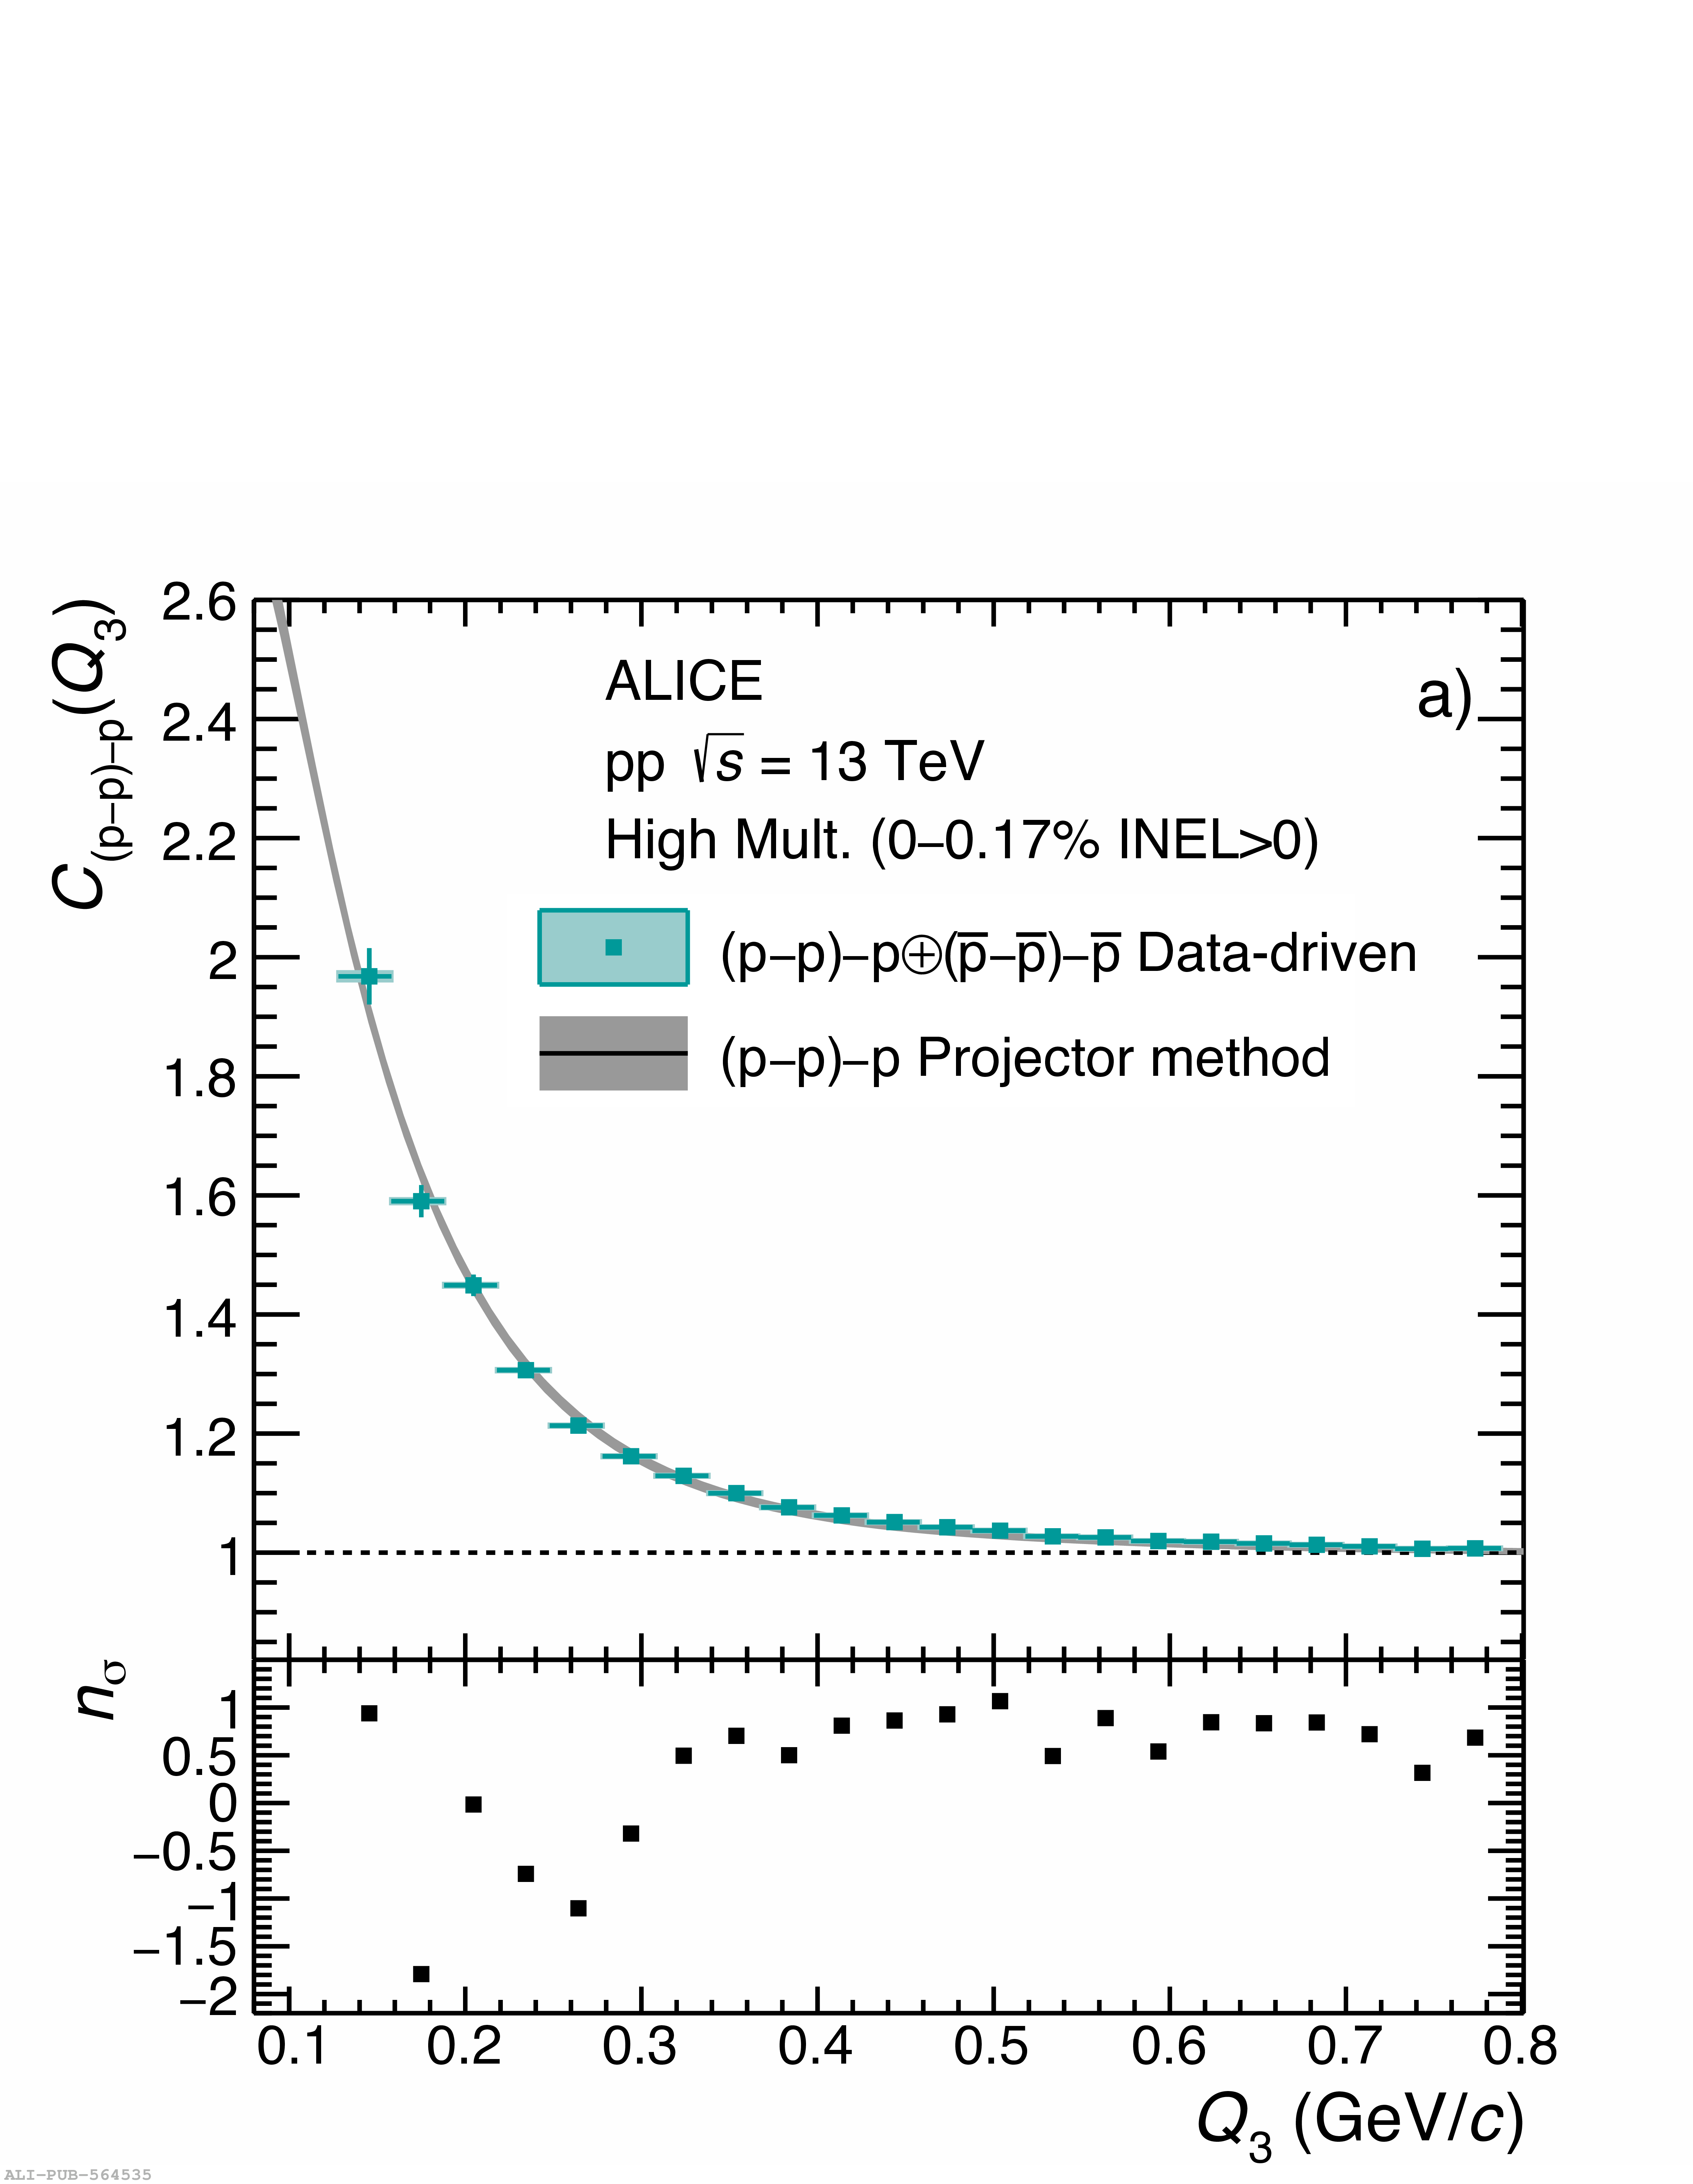 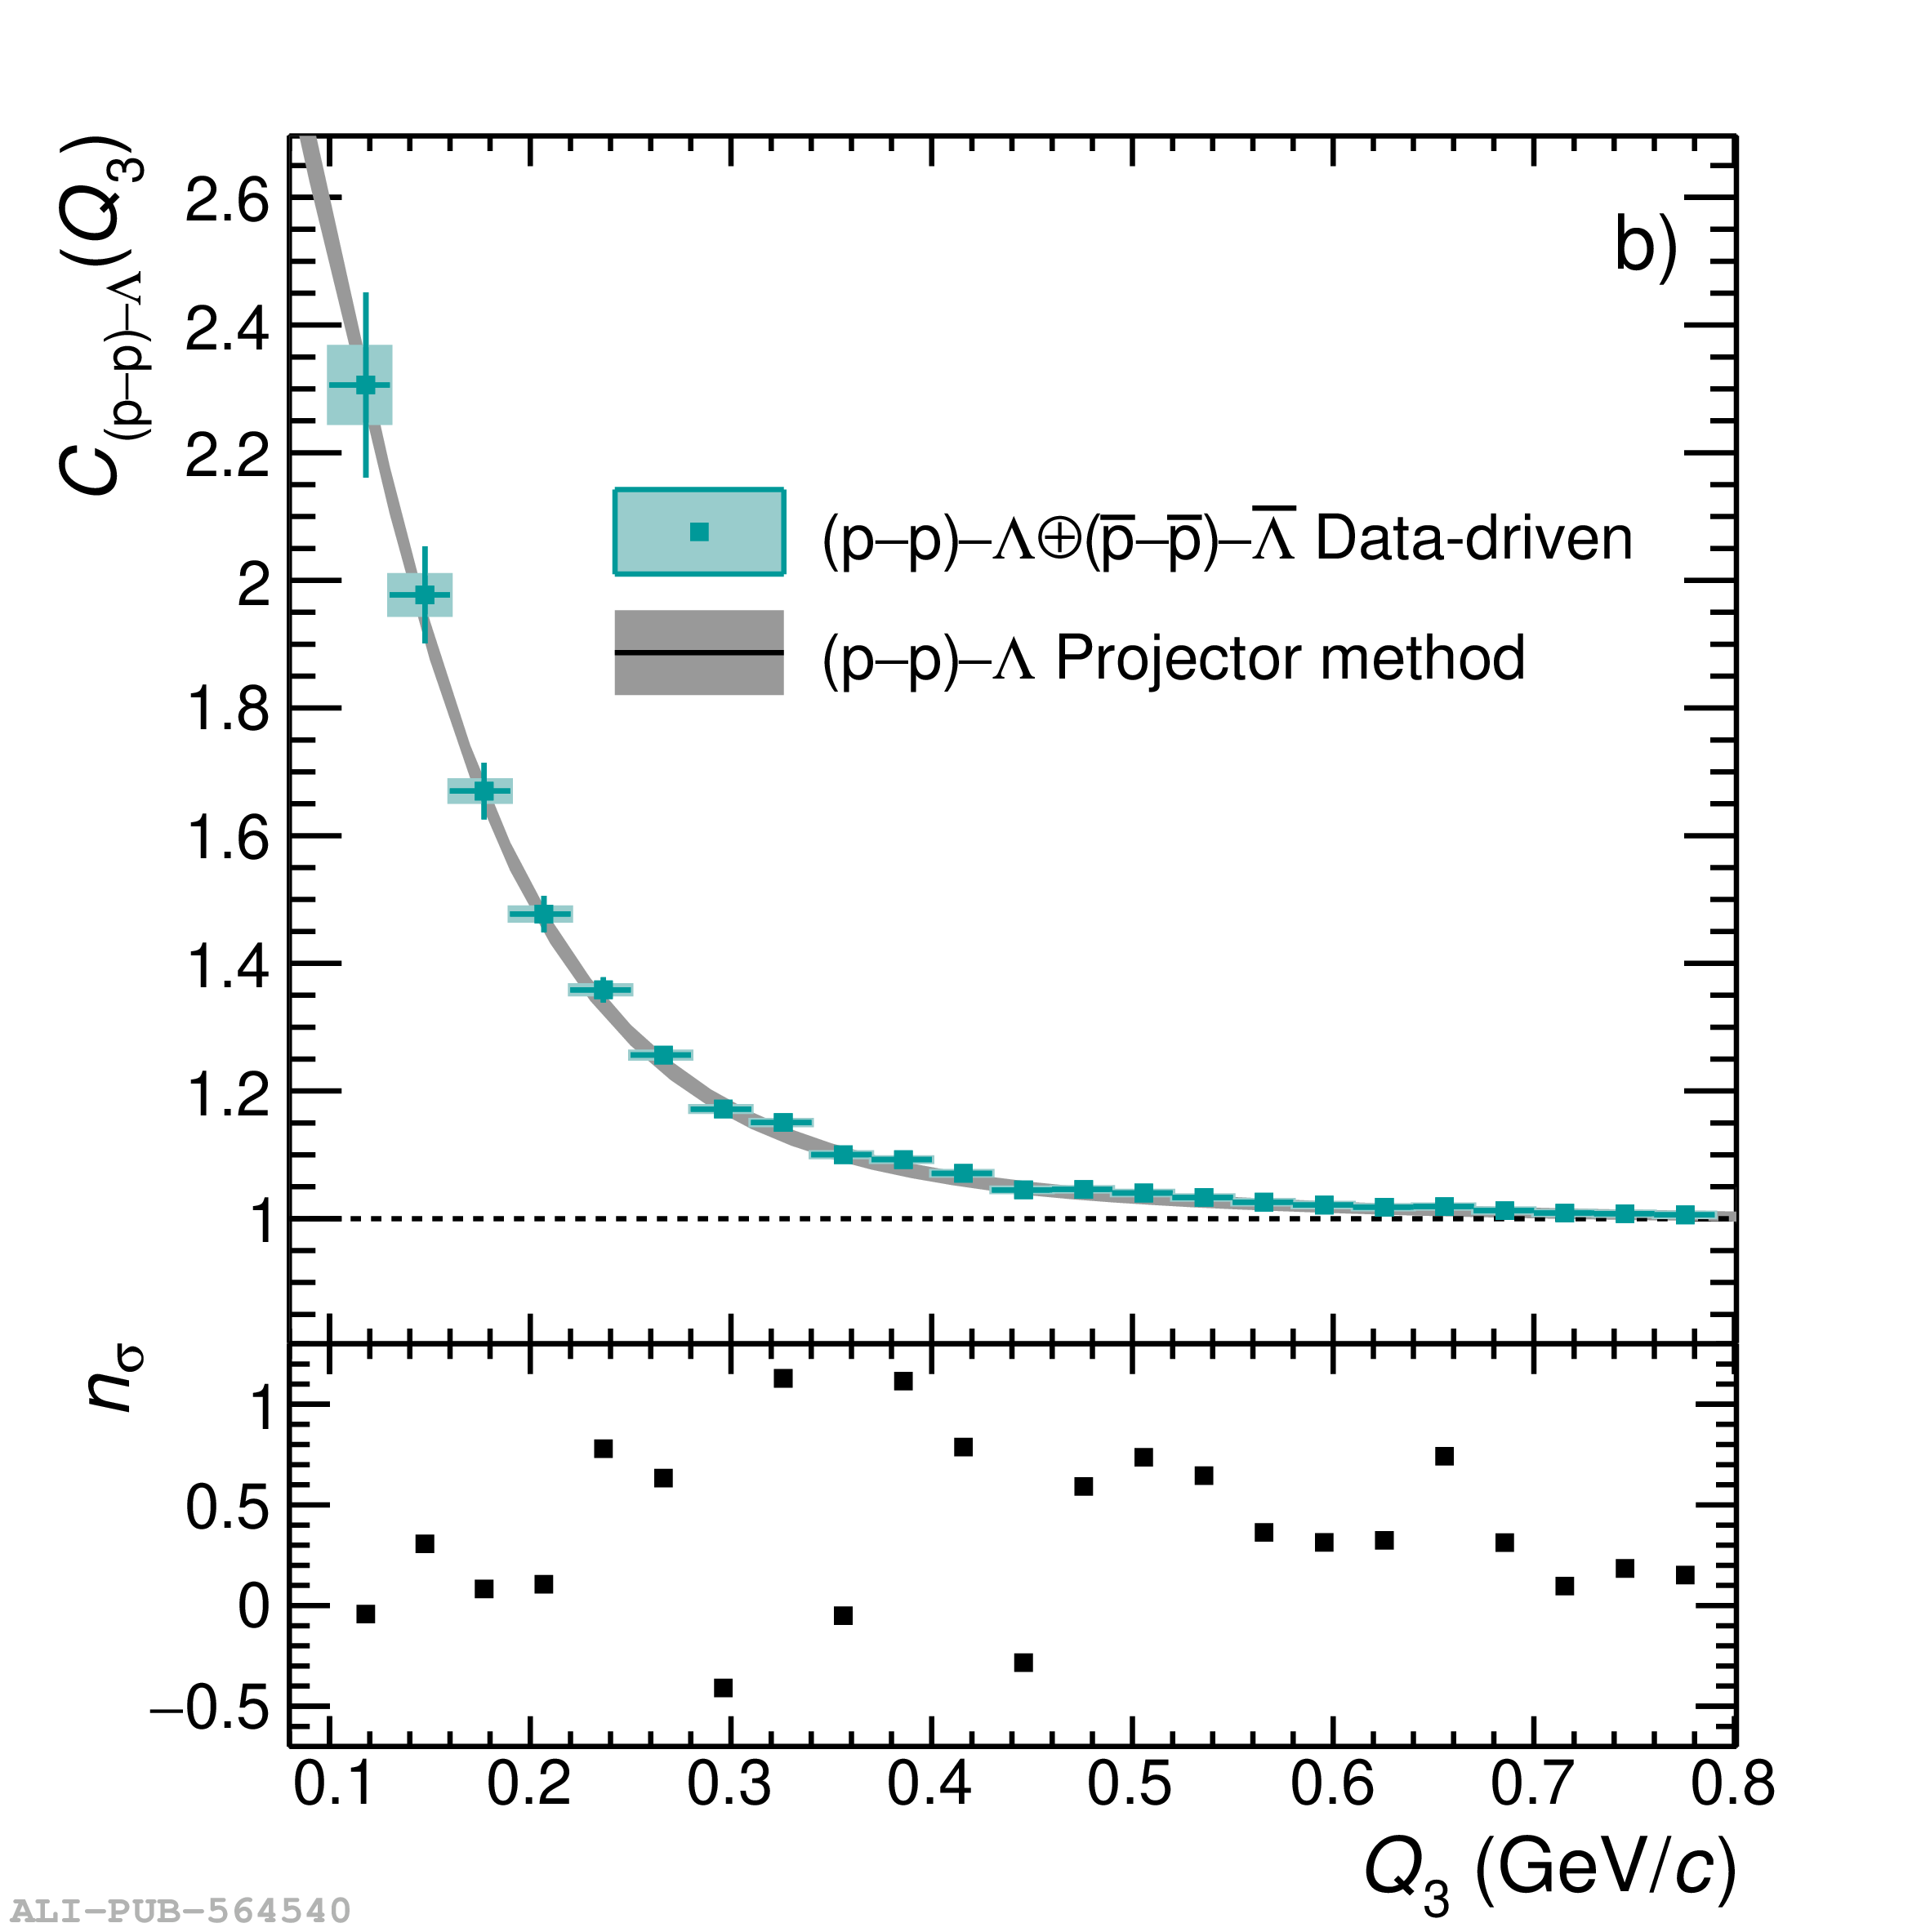 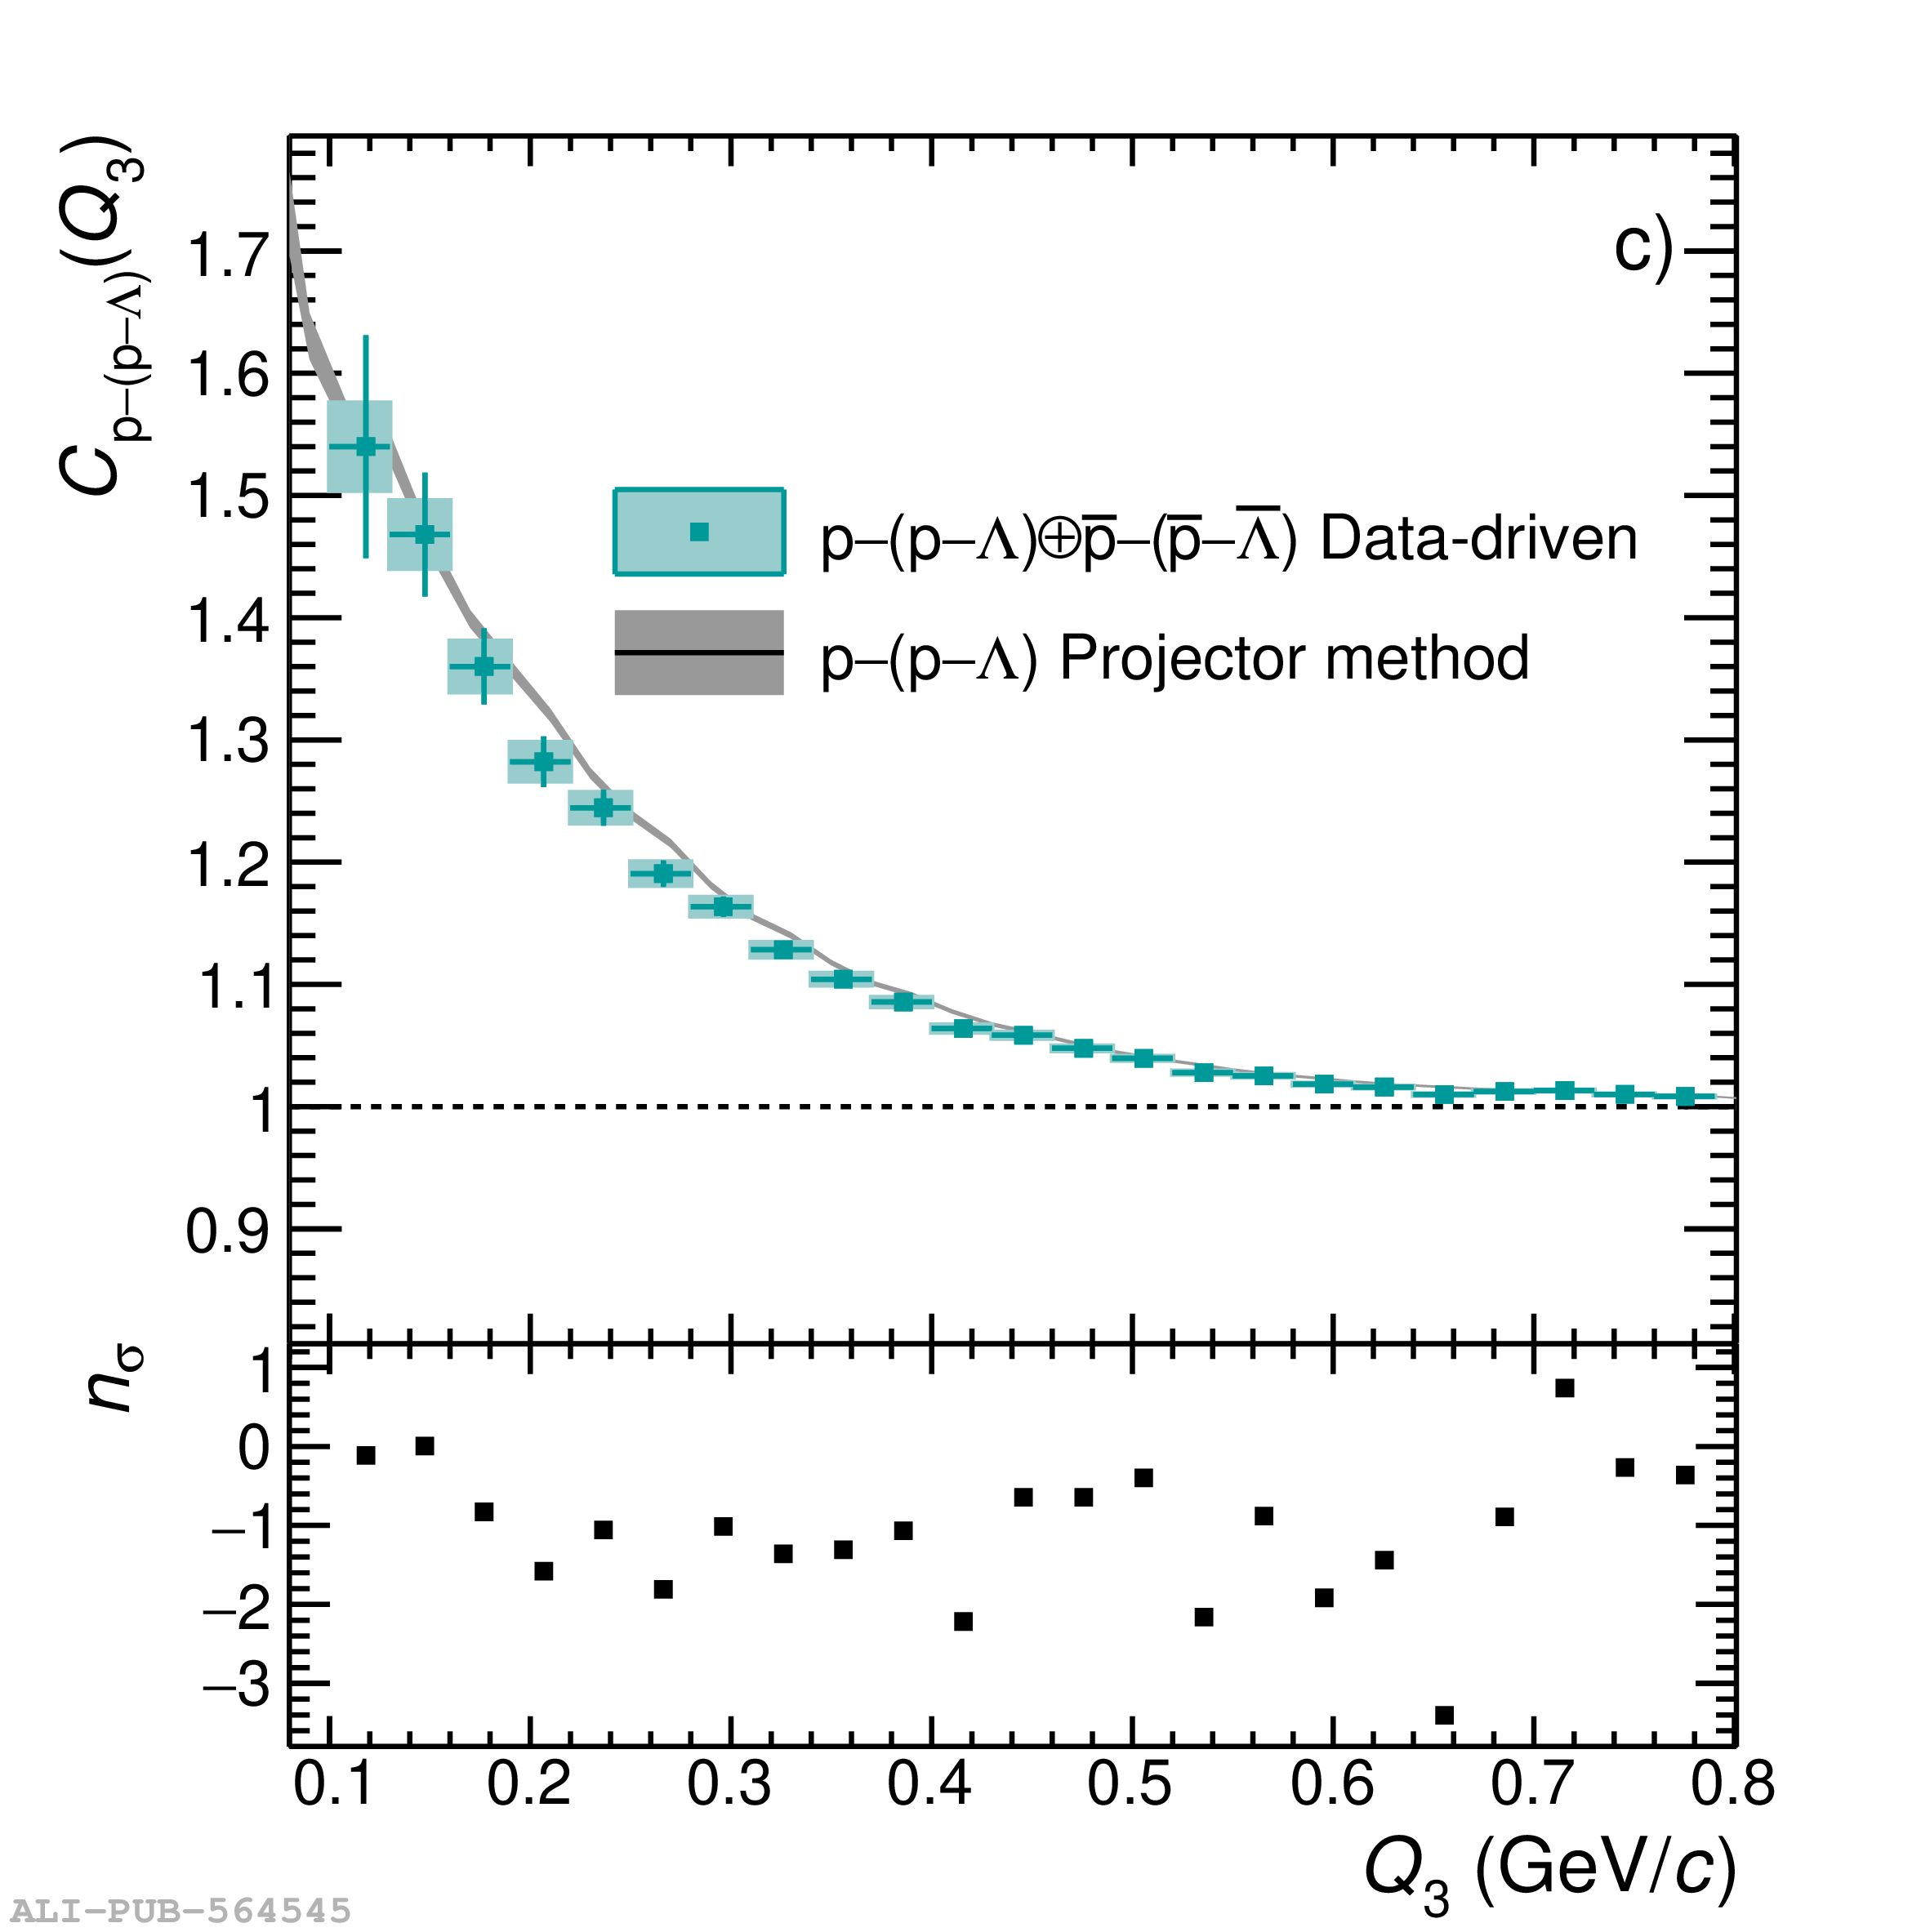 |