The double ratios of integrated yield as a function of \SOPT are presented for V0M 0--1\% (upper) and \tracklet 0--10\% (lower). Left and right panels show the same data points, but with different model predictions. Statistical and total systematic uncertainties are shown by bars and boxes, respectively. The curves represent different model predictions of the same measurement. | 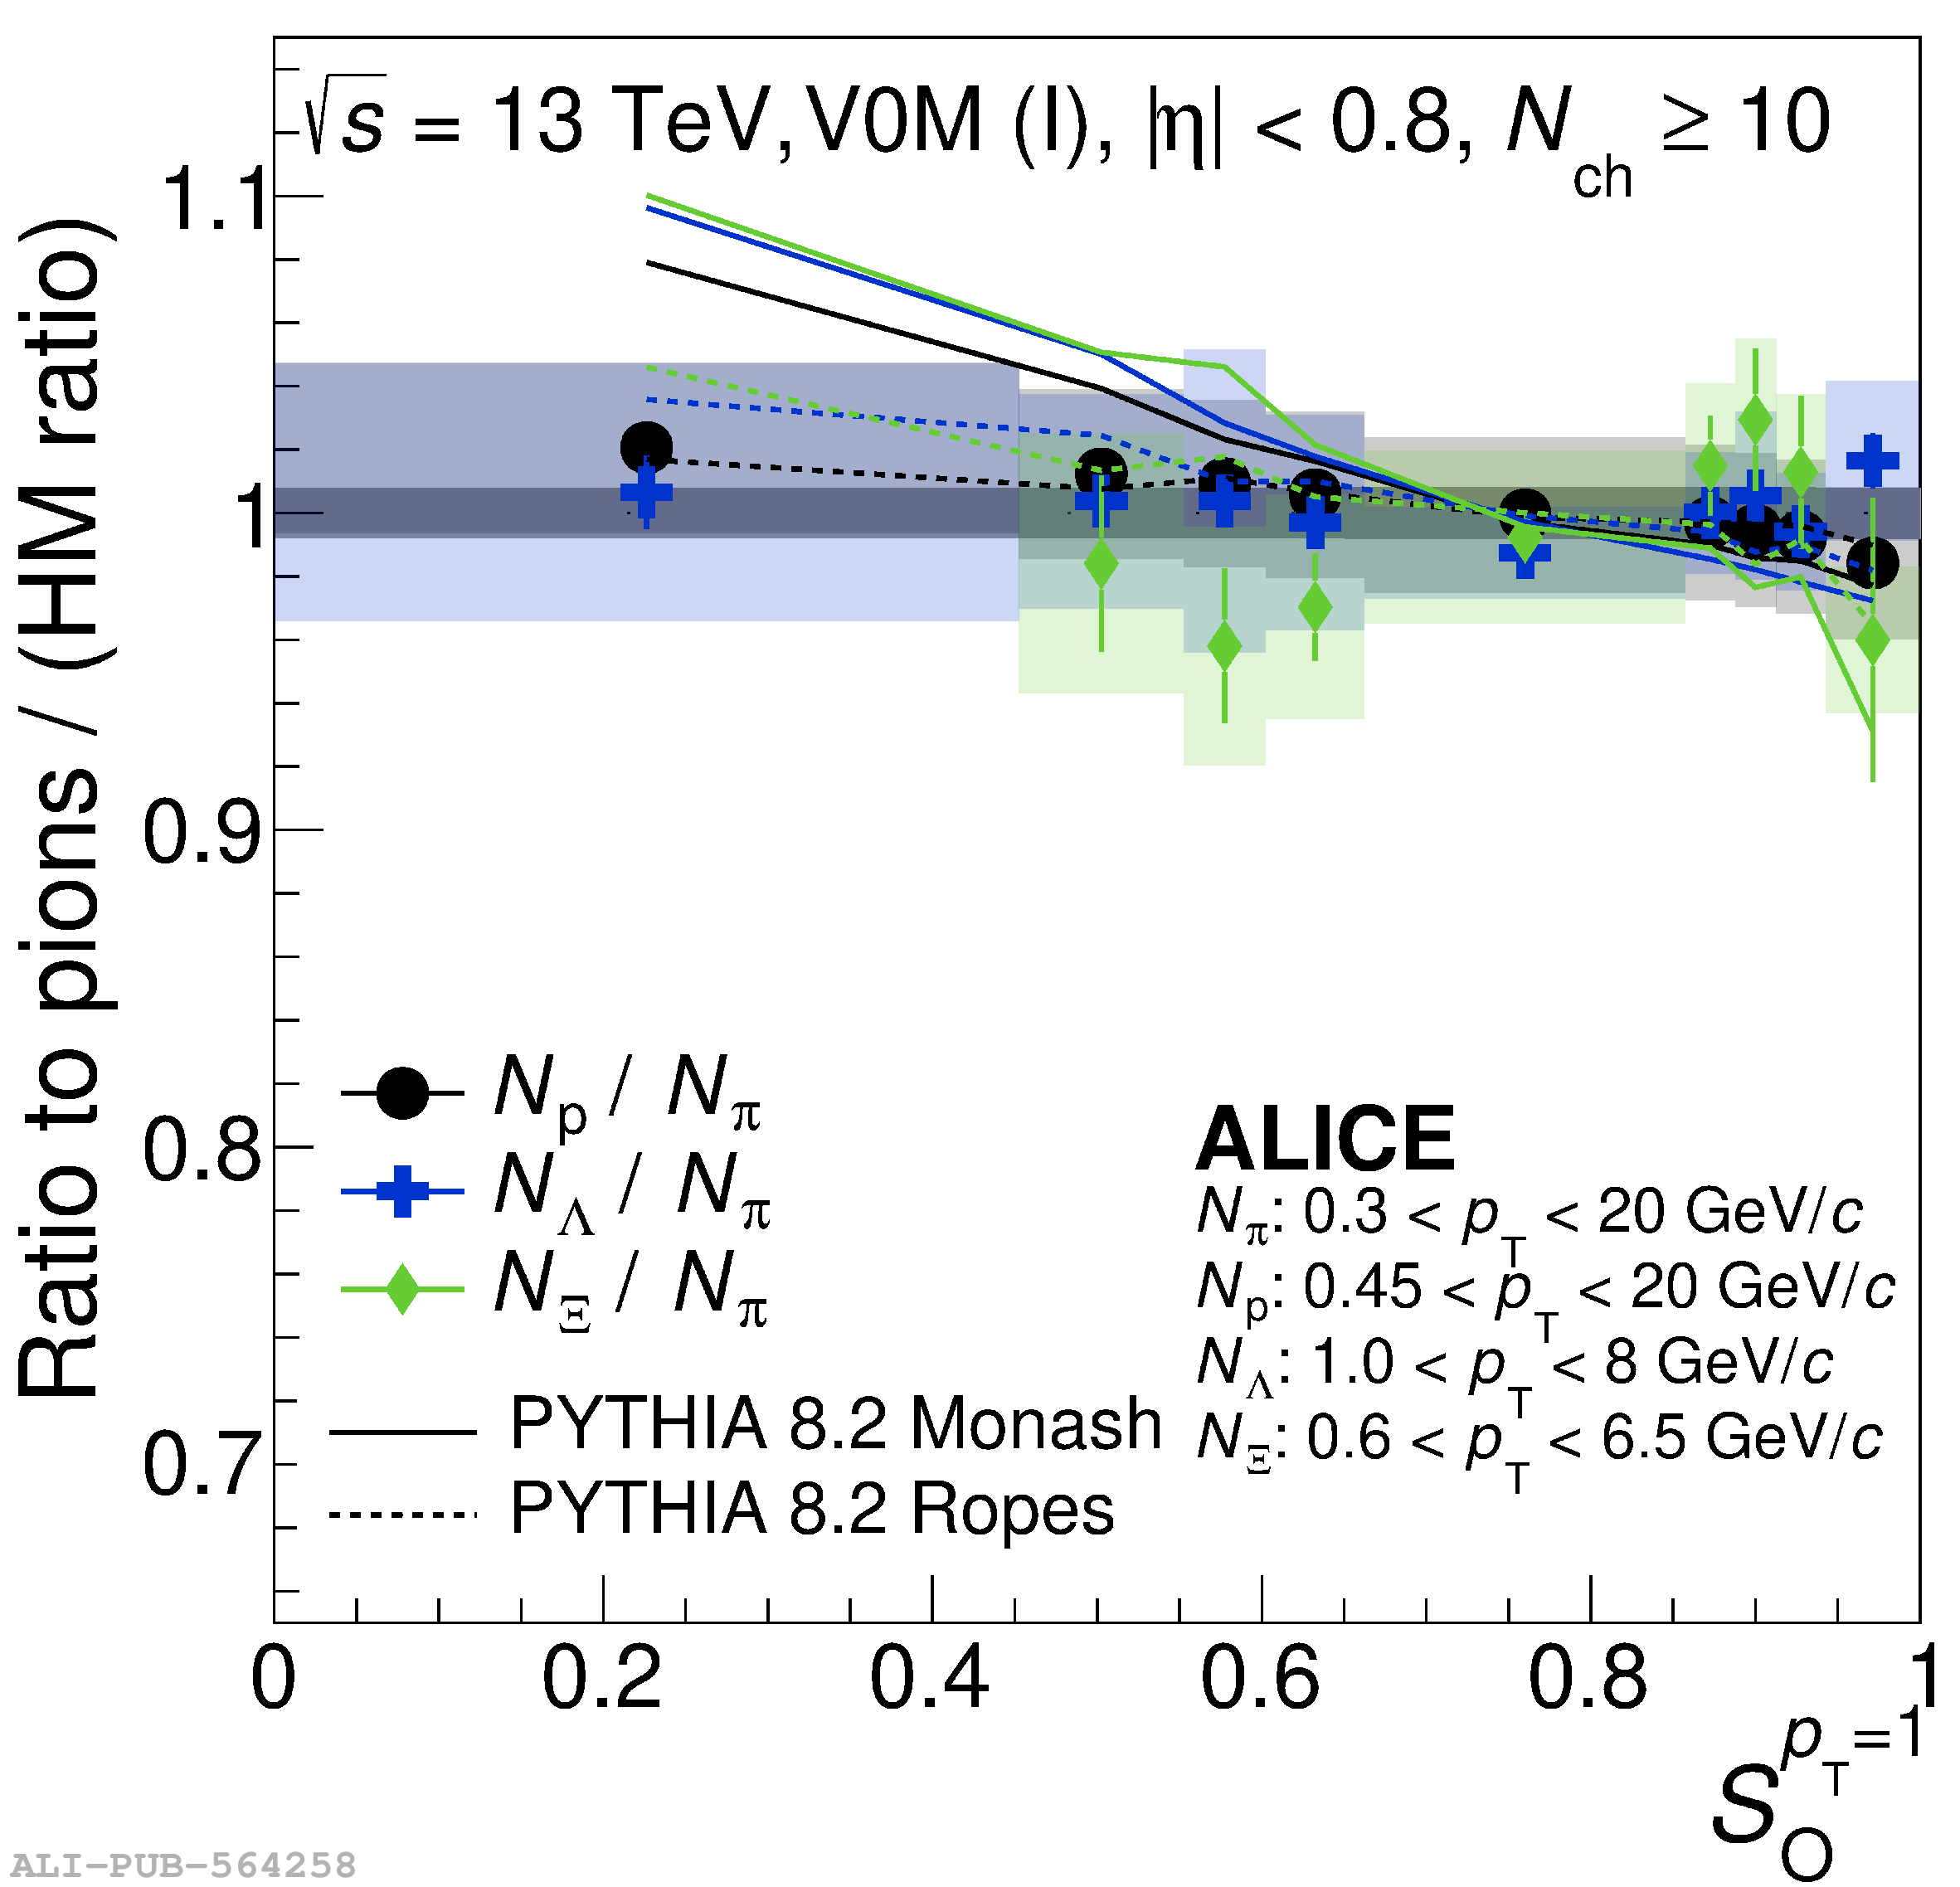 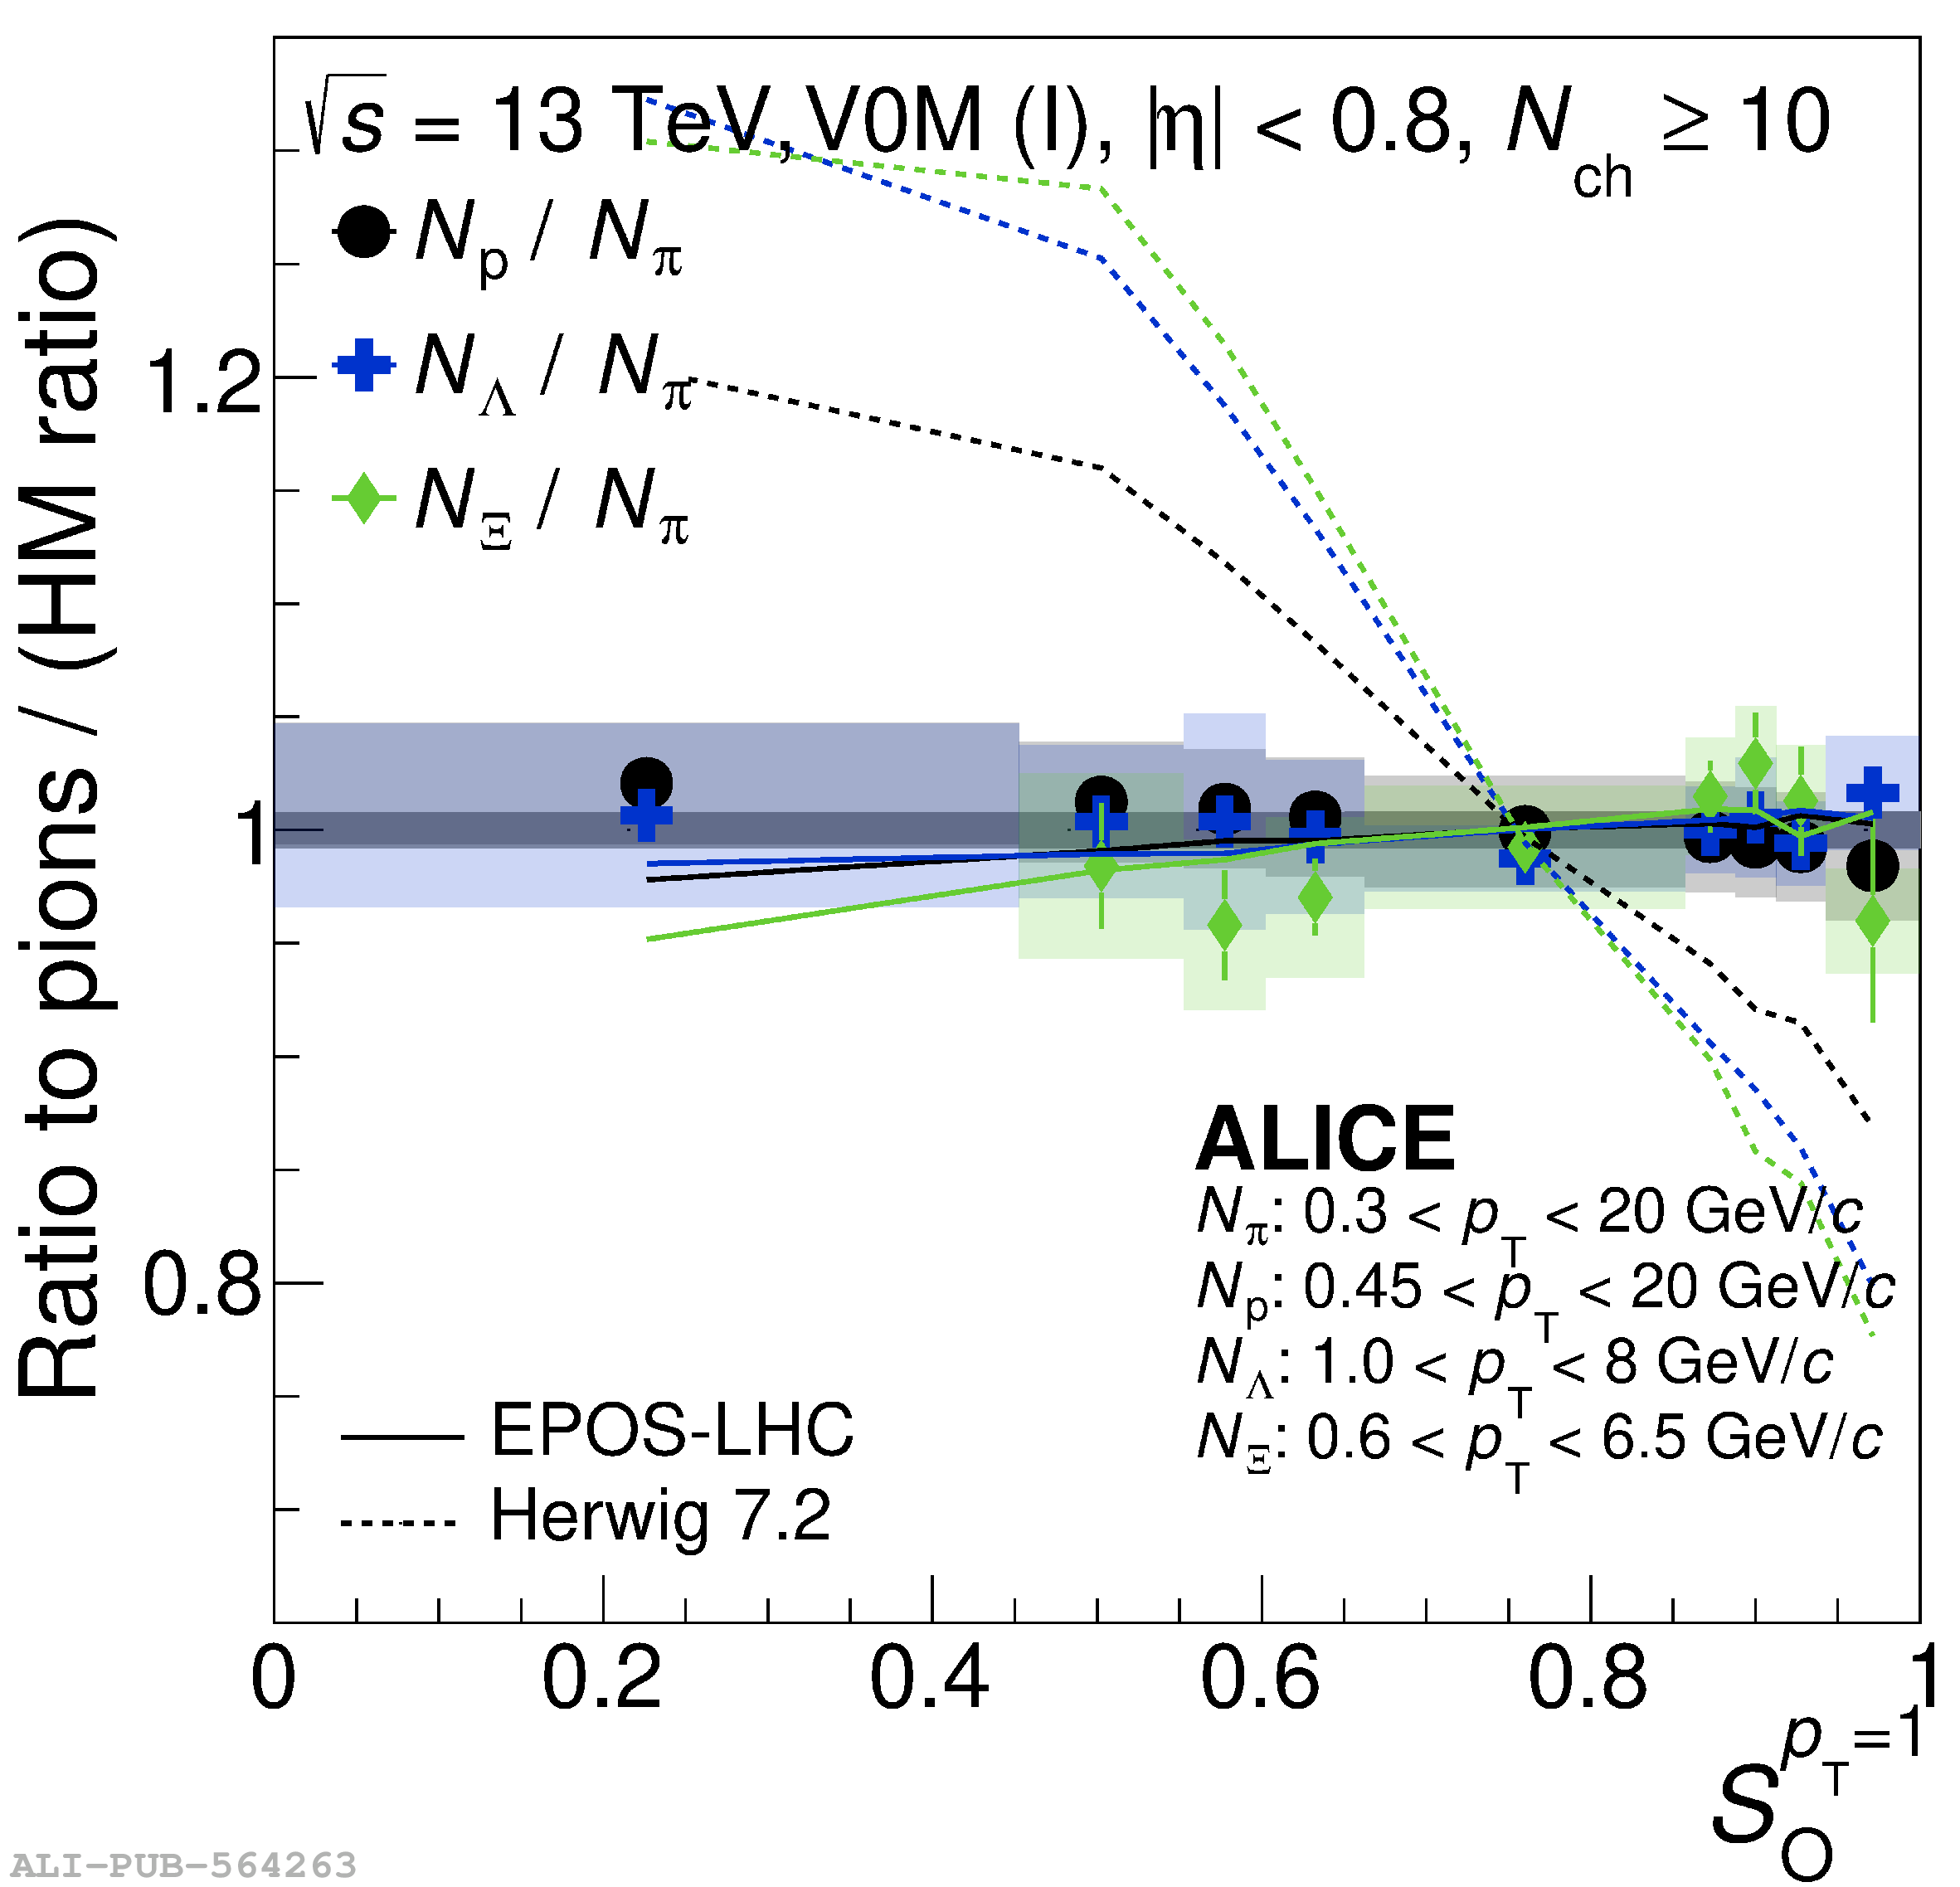 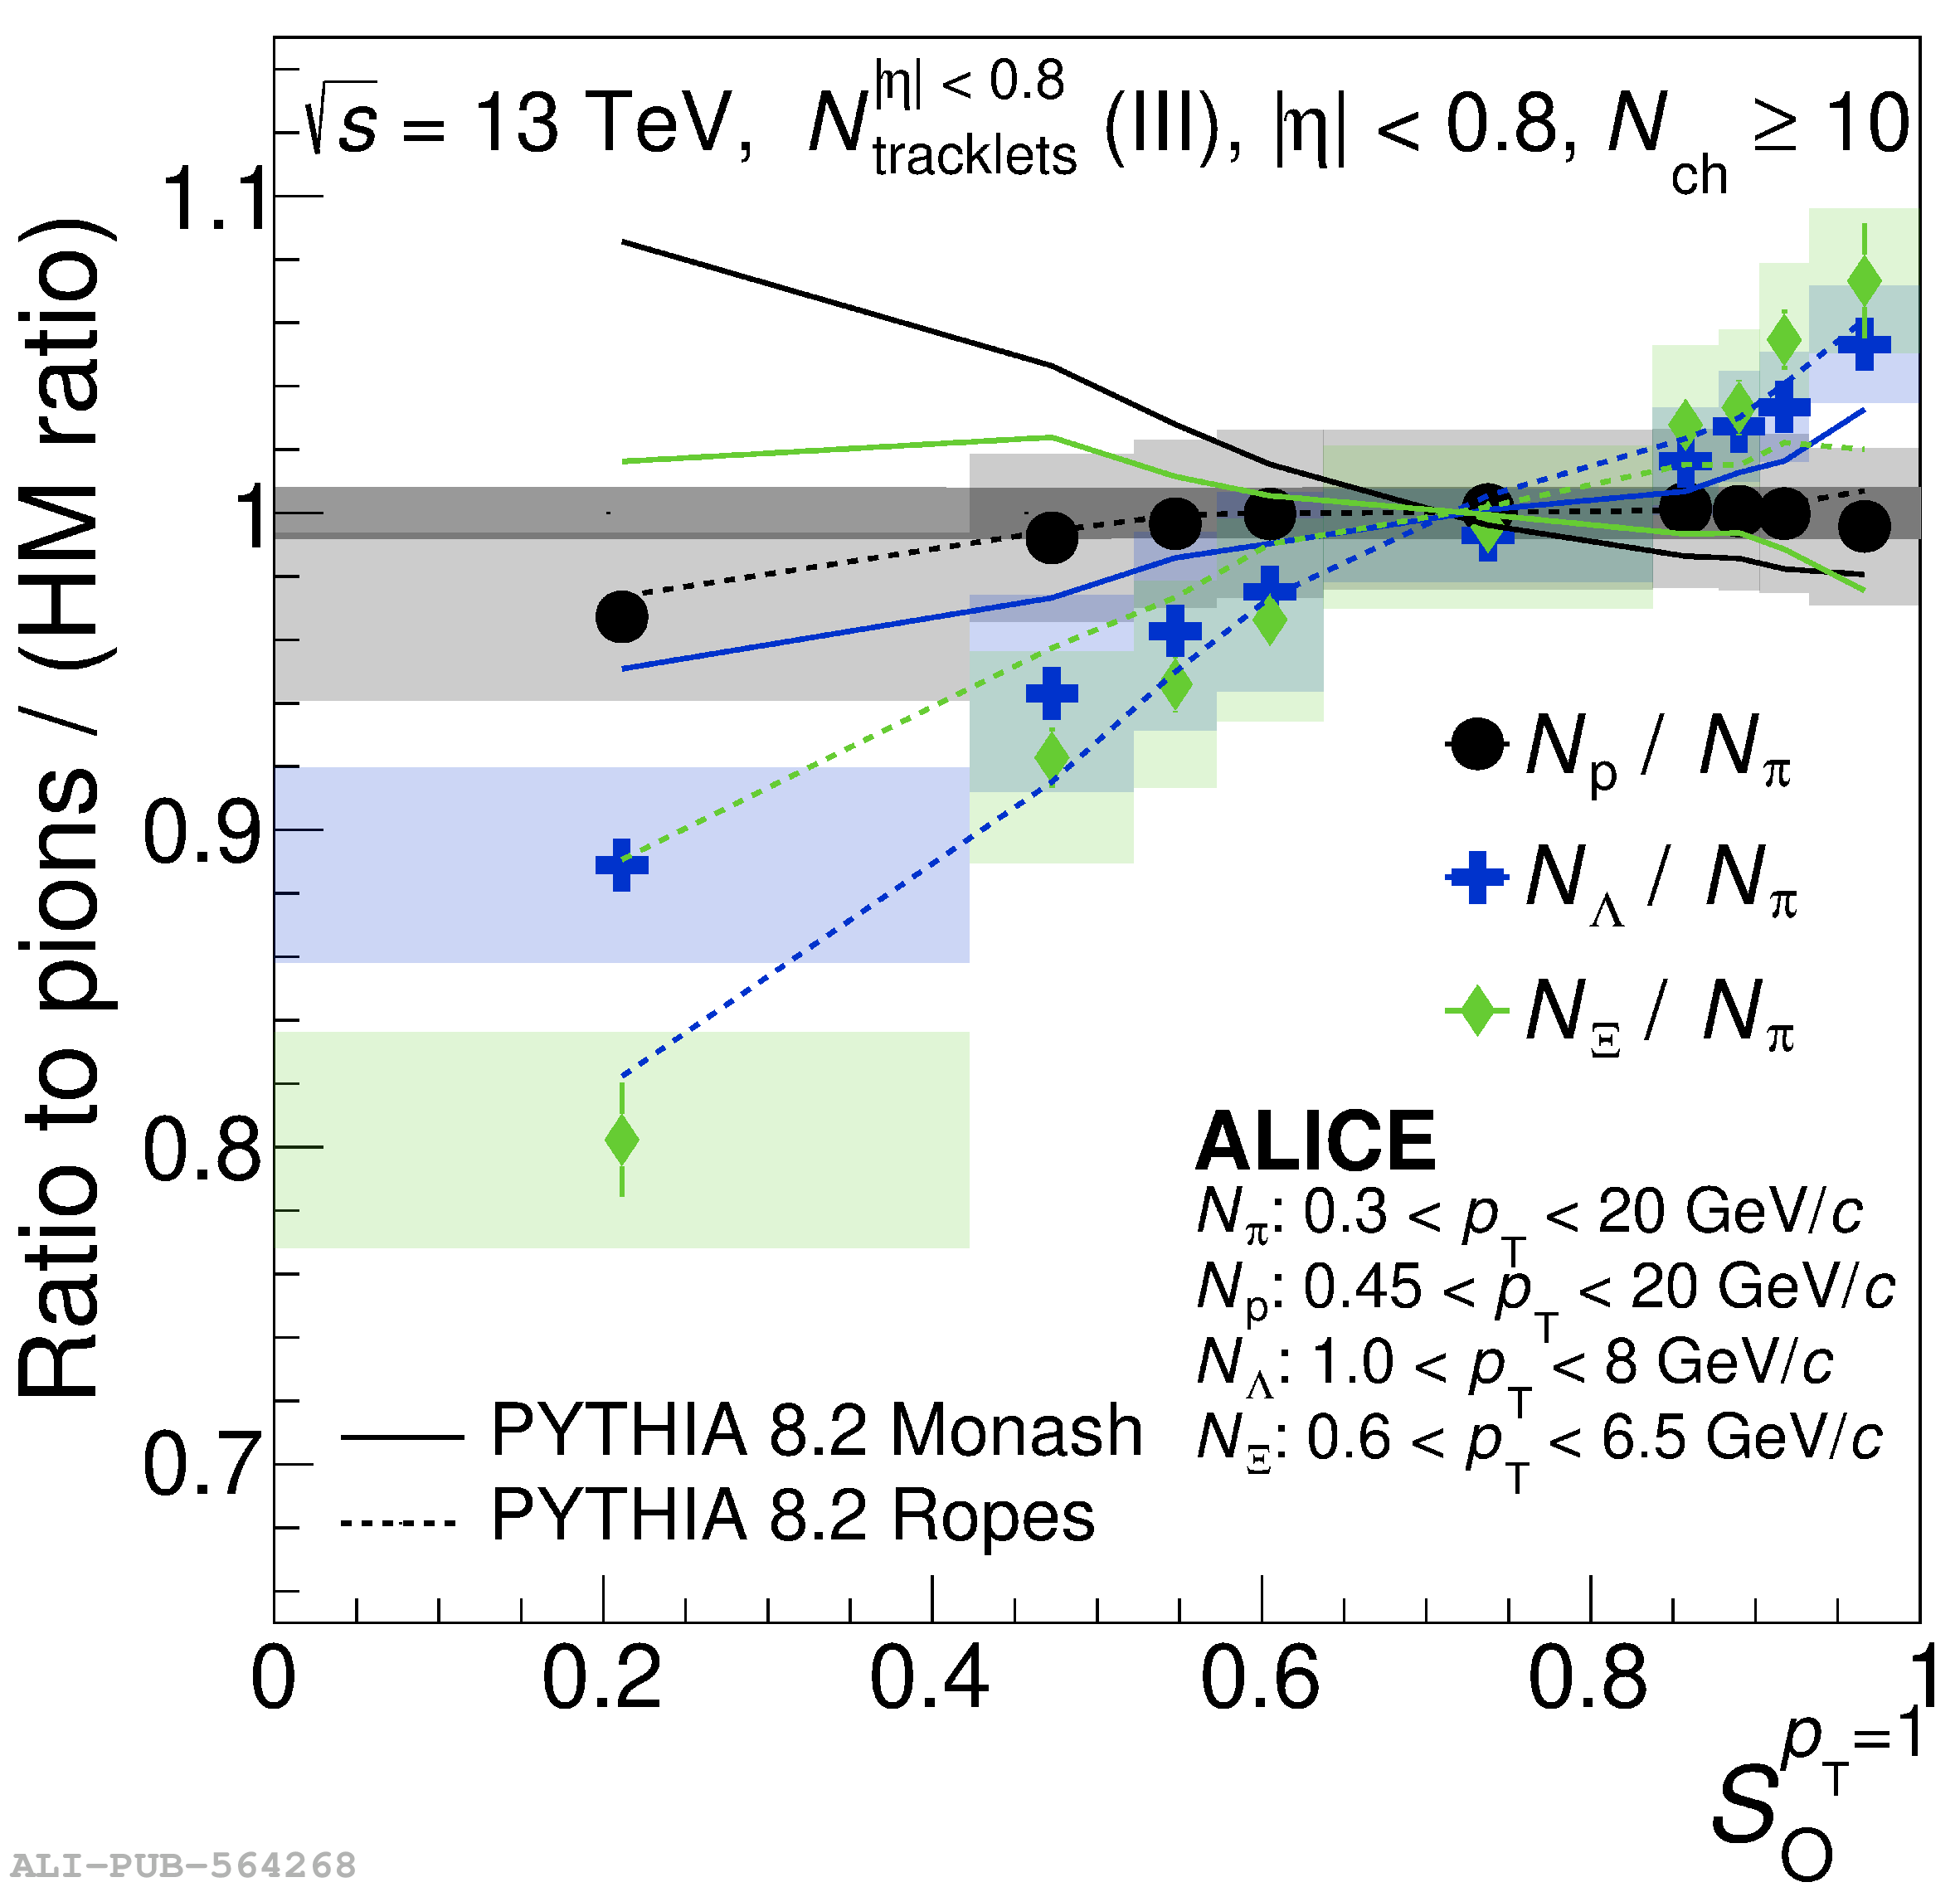 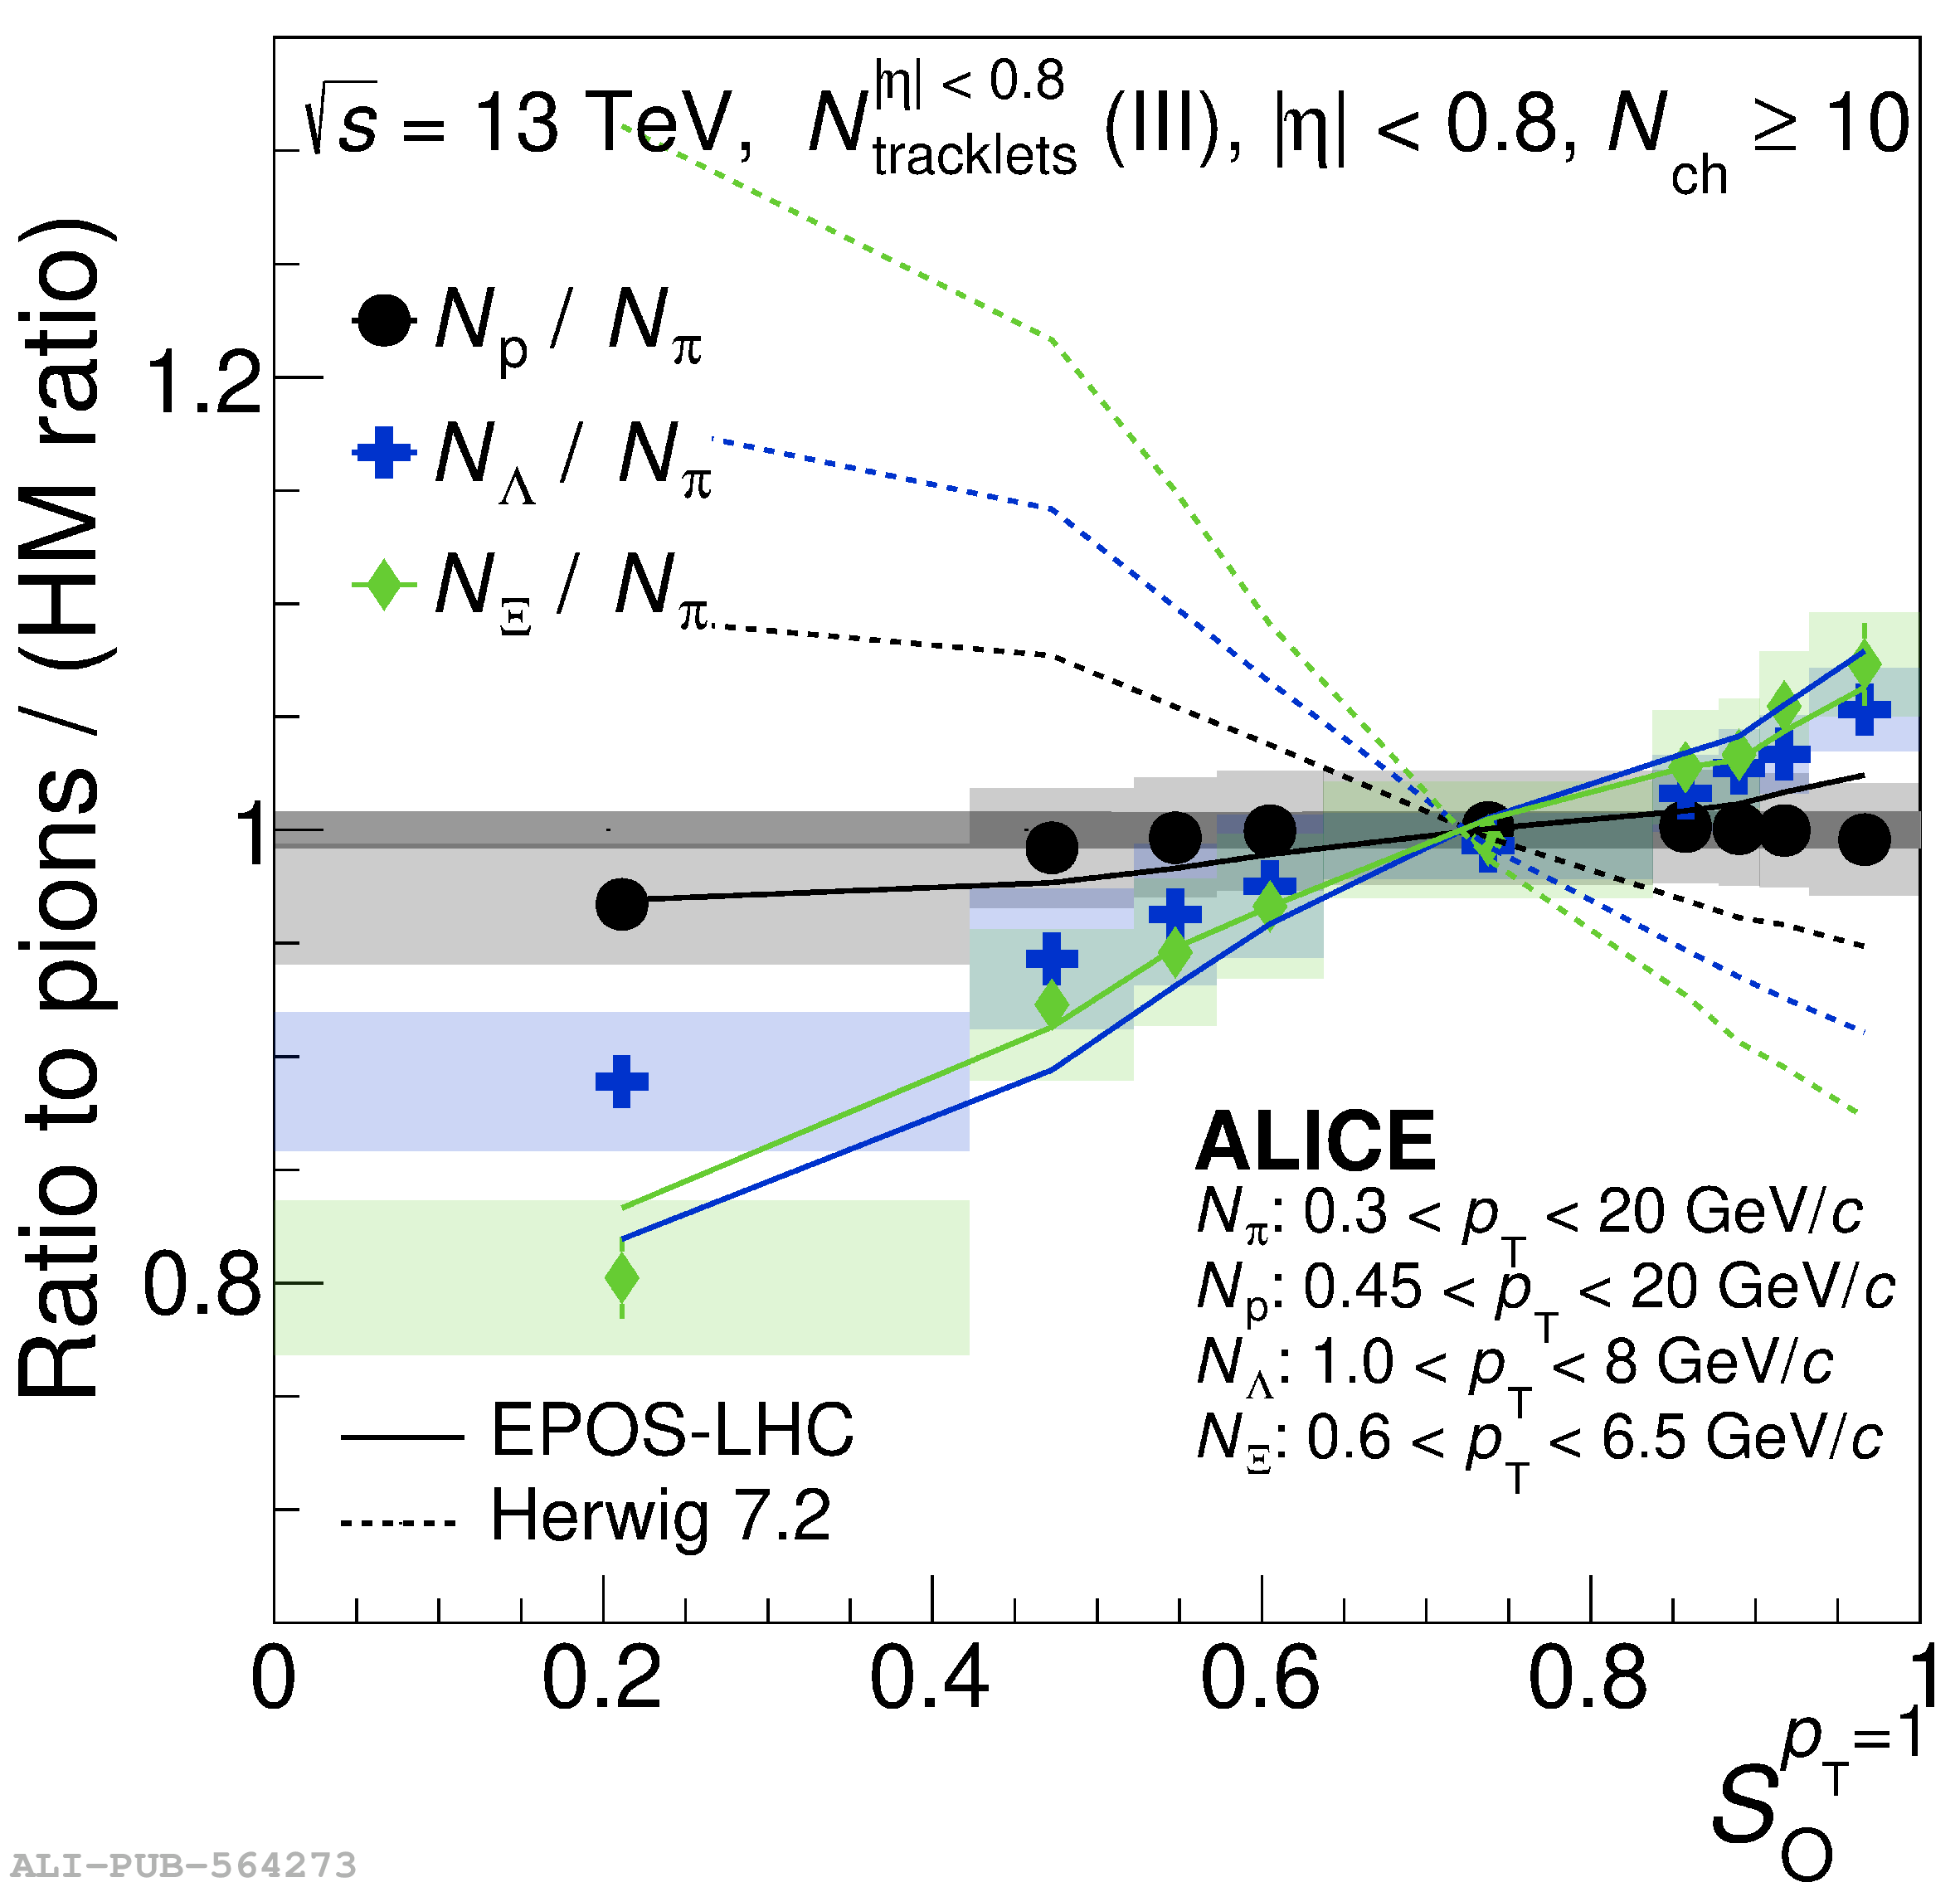 |