The double ratios of integrated yield as a function of \SOPT are represented in the top-1\% of \tracklet. The yields are integrated in measured \pt ranges for each particle species. Statistical and systematic uncertainties are shown by bars and boxes, respectively. Figure \ref{Fig:CL1_1_Int_py} and Fig. \ref{Fig:CL1_1_Int_hw} both contain the same experimental data, but the vertical ranges are modified to accommodate the model predictions. The curves represent different model predictions of the same measurement. The grey band around unity represents the systematic uncertainty of the pion measurement. | 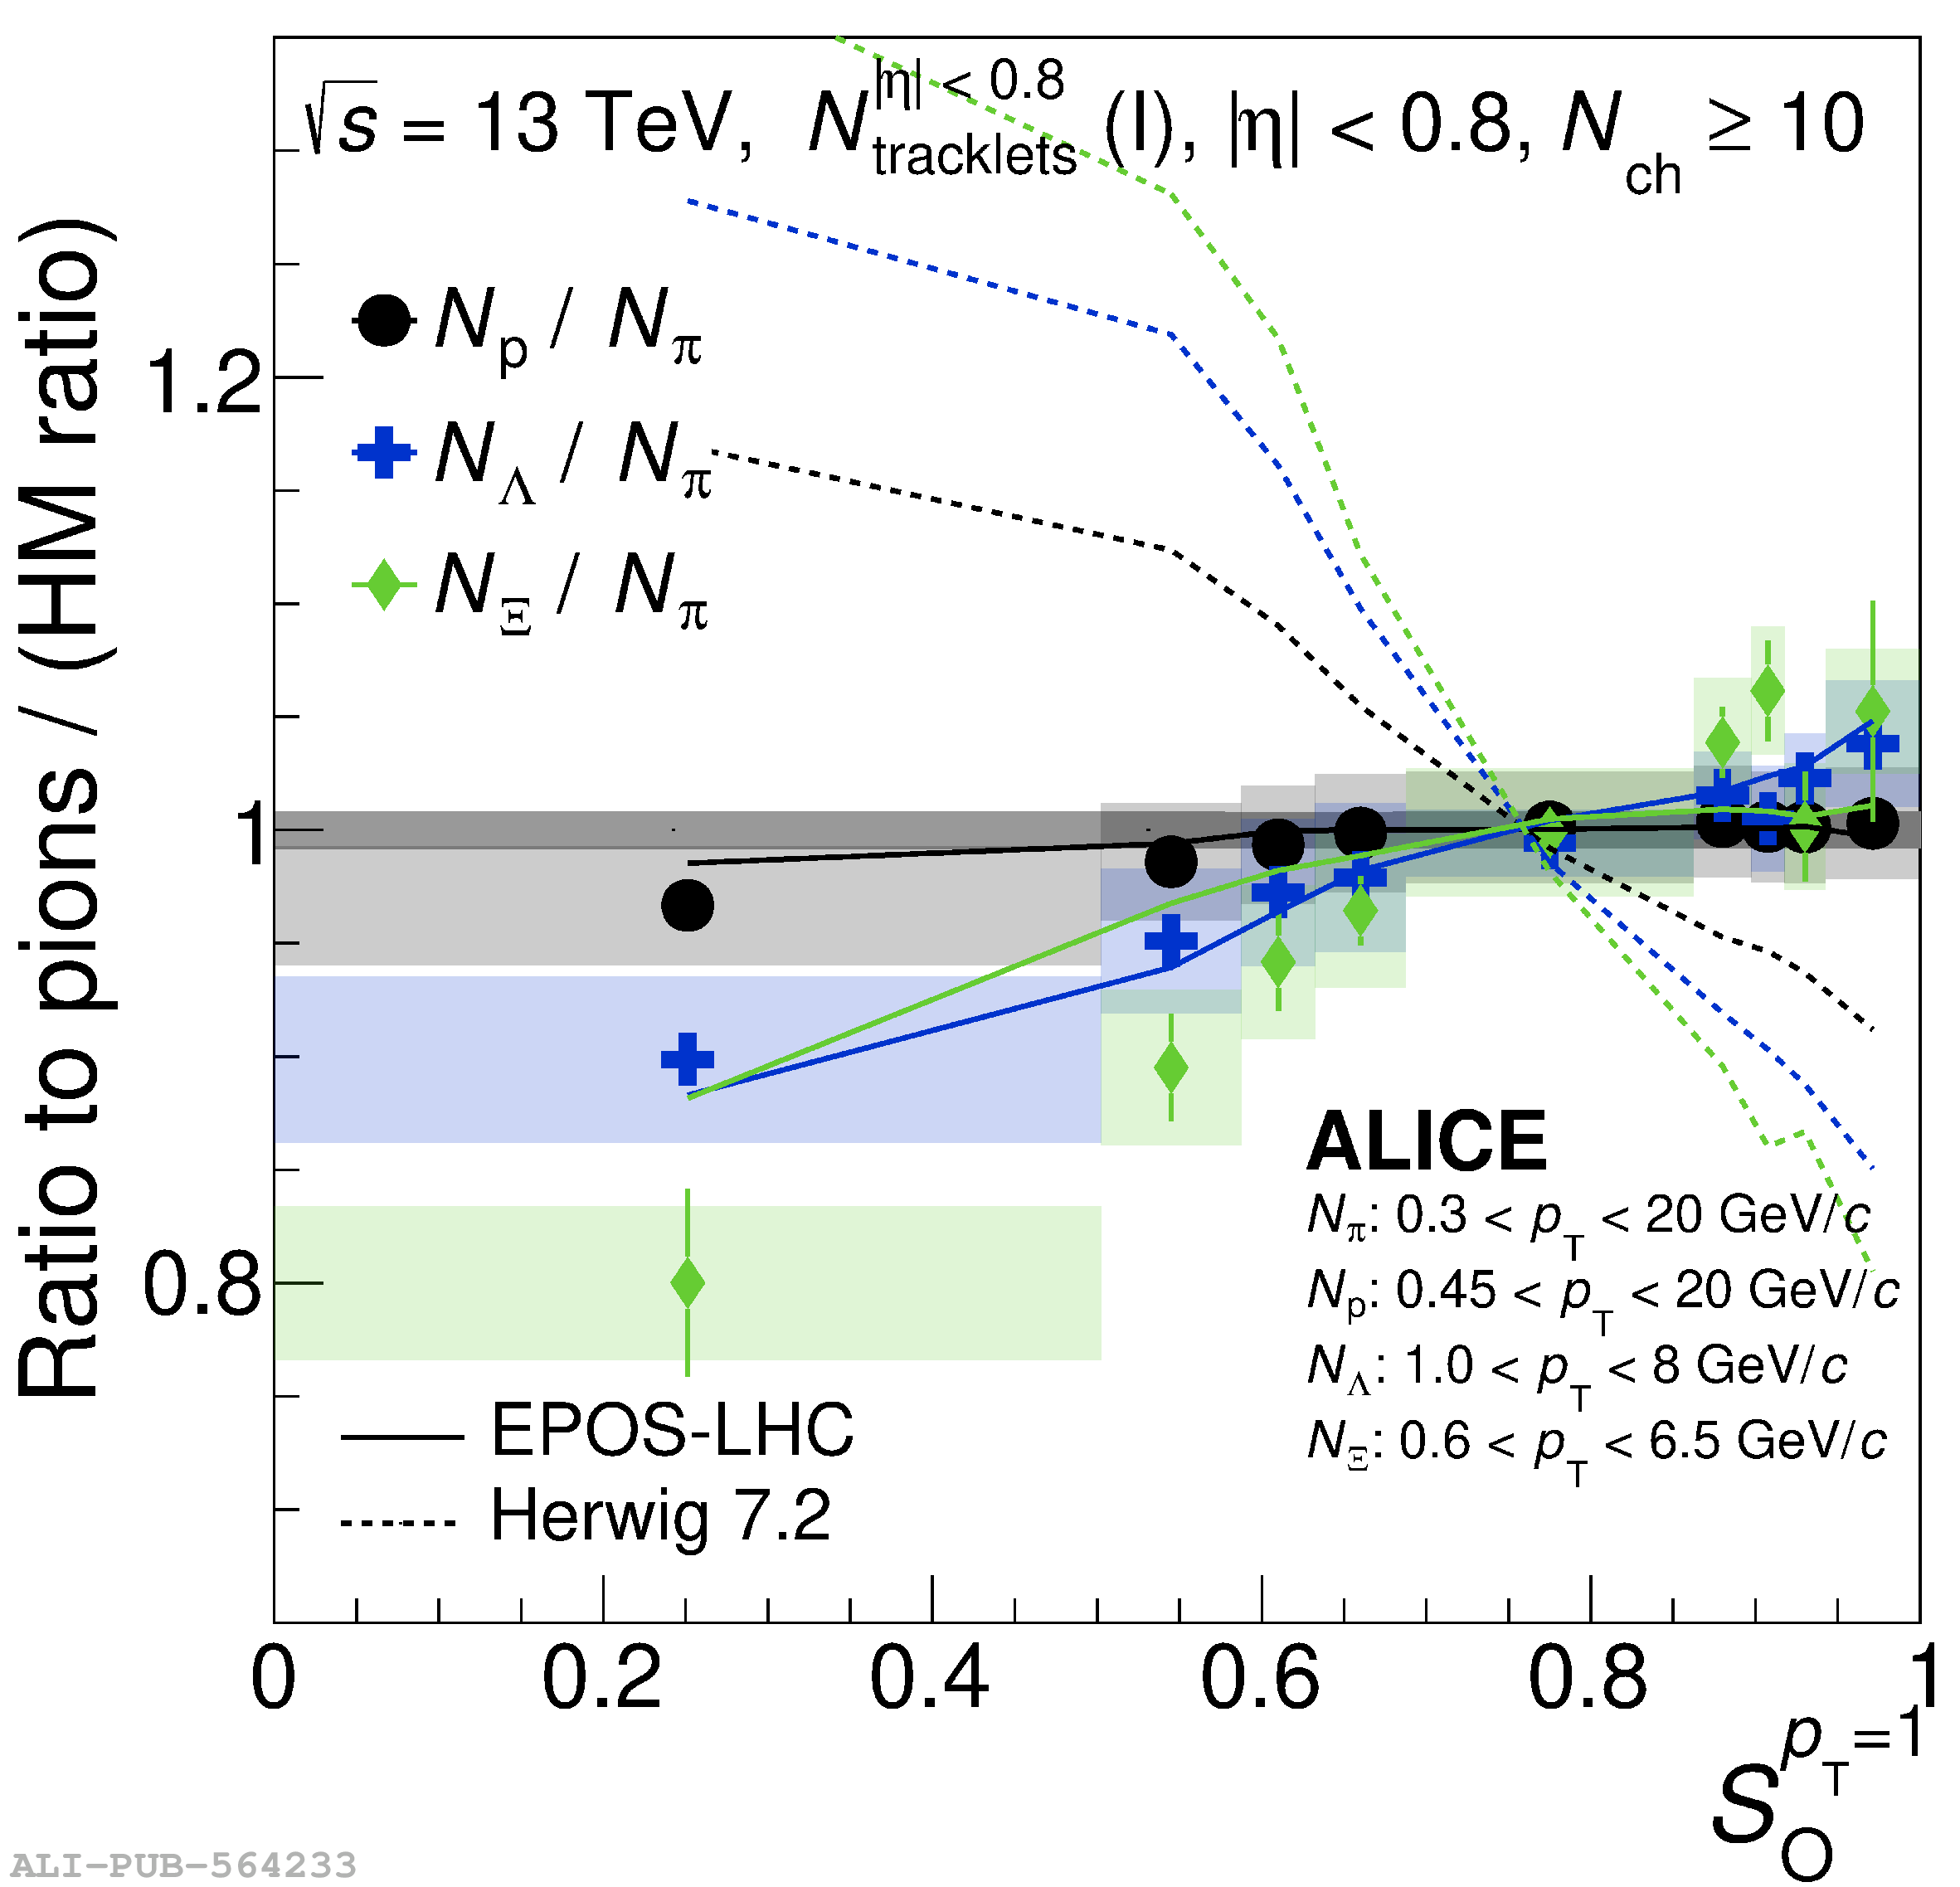 |