The \mpt and \myield as a function of particle masses obtained for the various particle species in \SOPT classes selected for high-multiplicity events, determined by the events in the 0--1\% of \tracklet. Upper (lower) panels show the \mpt (\myield). The total systematic uncertainty is represented by the shaded regions. The measured data is compared to predictions from PYTHIA8 Monash, PYTHIA8 Rope, EPOS-LHC, and Herwig 7.2. |  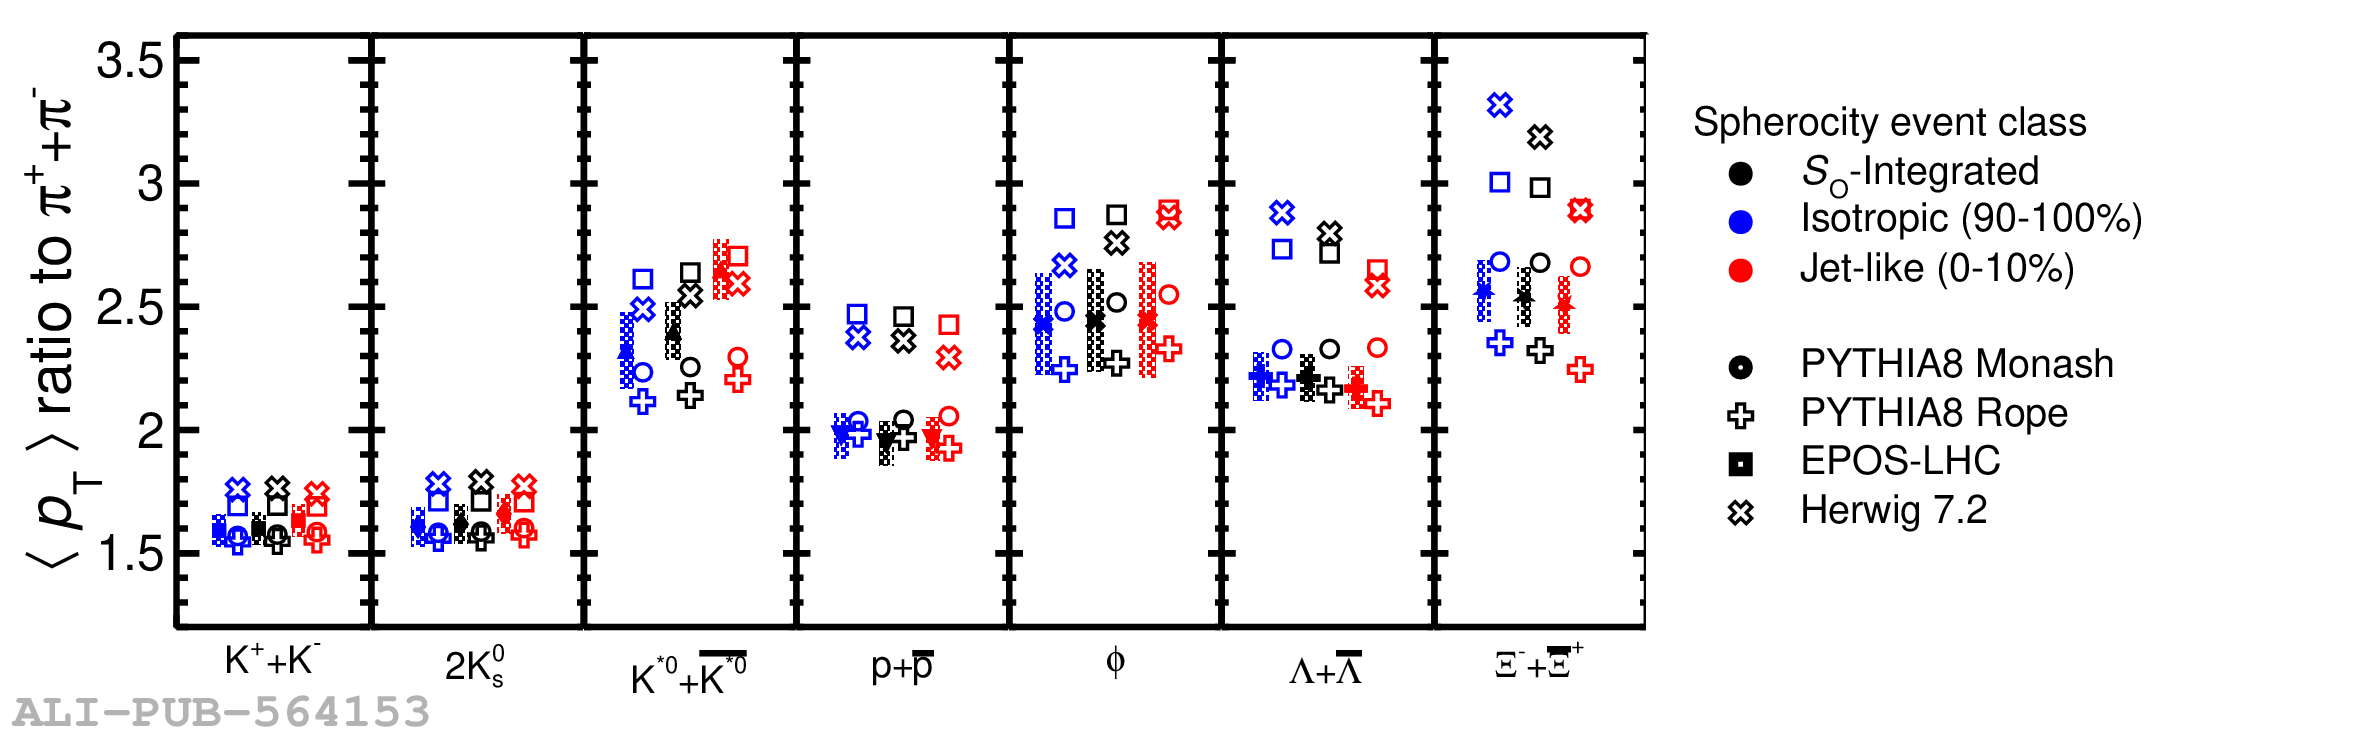  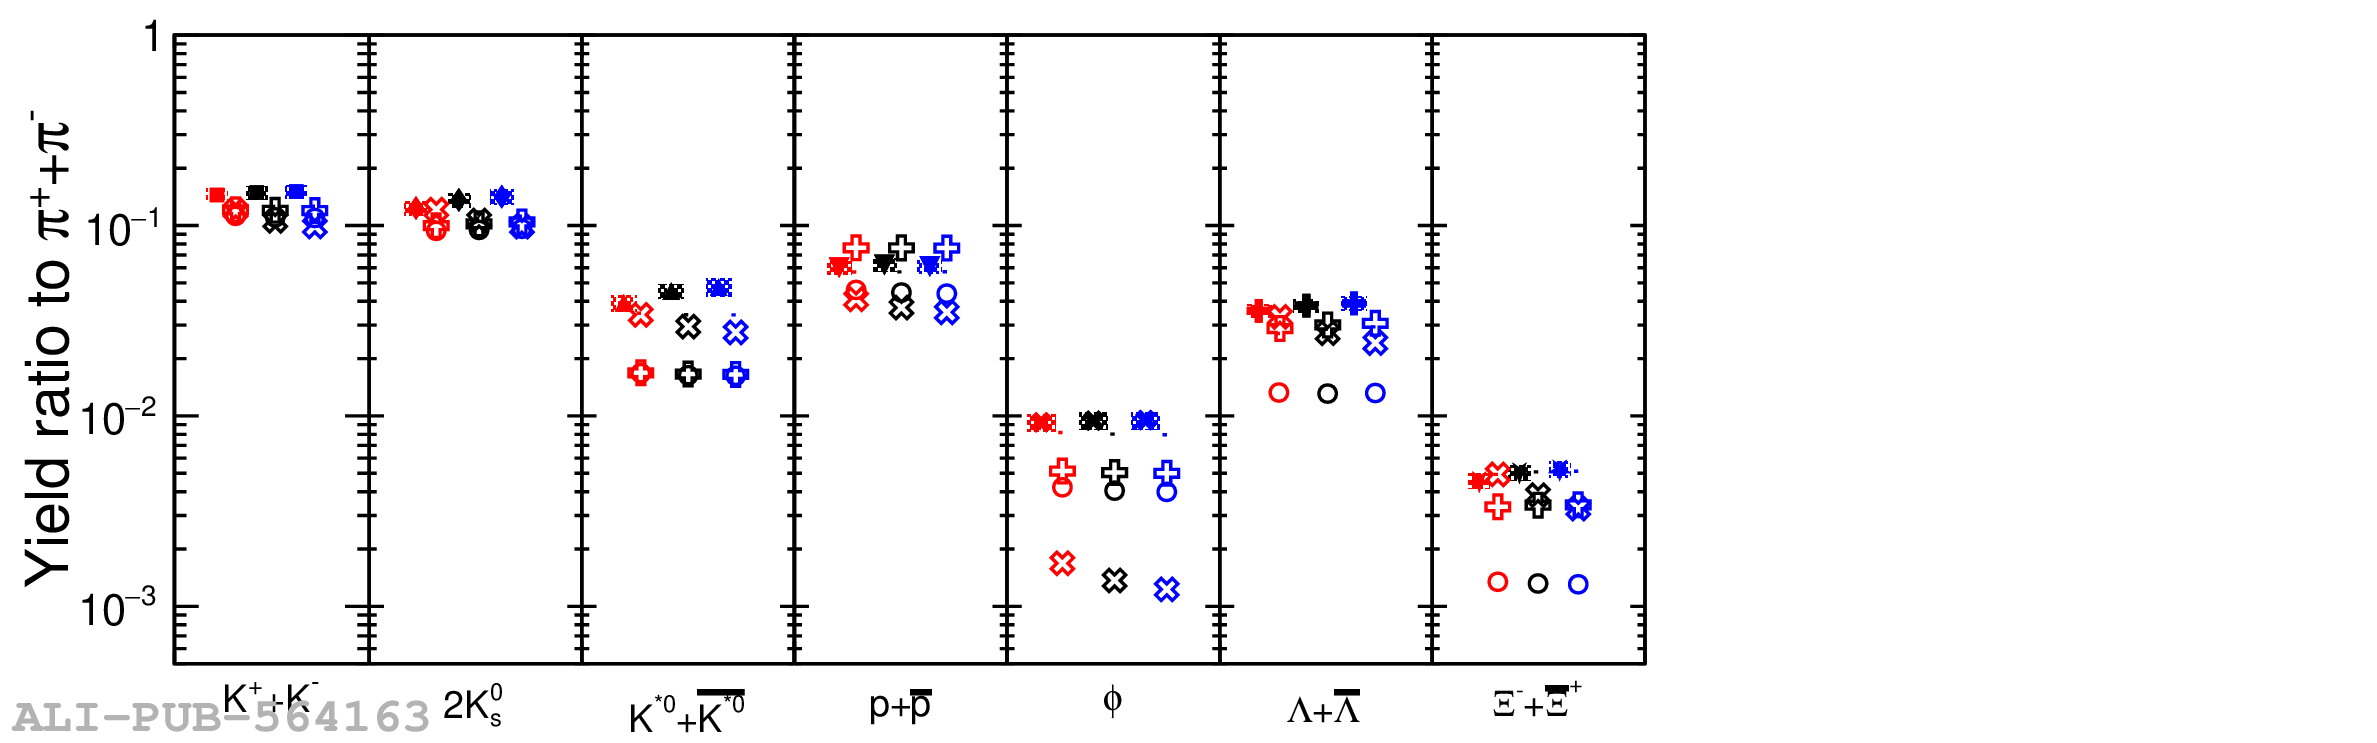 |