PYTHIA 8.2 correlation study between $\left<\pthat\right>$ and $\left< n>$ as a function of \SOPT, in 0--1\% V0M and \tracklet multiplicity classes. The default PYTHIA 8.2 Monash variation is compared to PYTHIA 8.2 with color rope hadronization. The total systematic and statistical uncertainties are smaller than the marker sizes. The grey band is an interpolation between the points, to more clearly illustrate the trend of each multiplicity and model variation. < /n> | 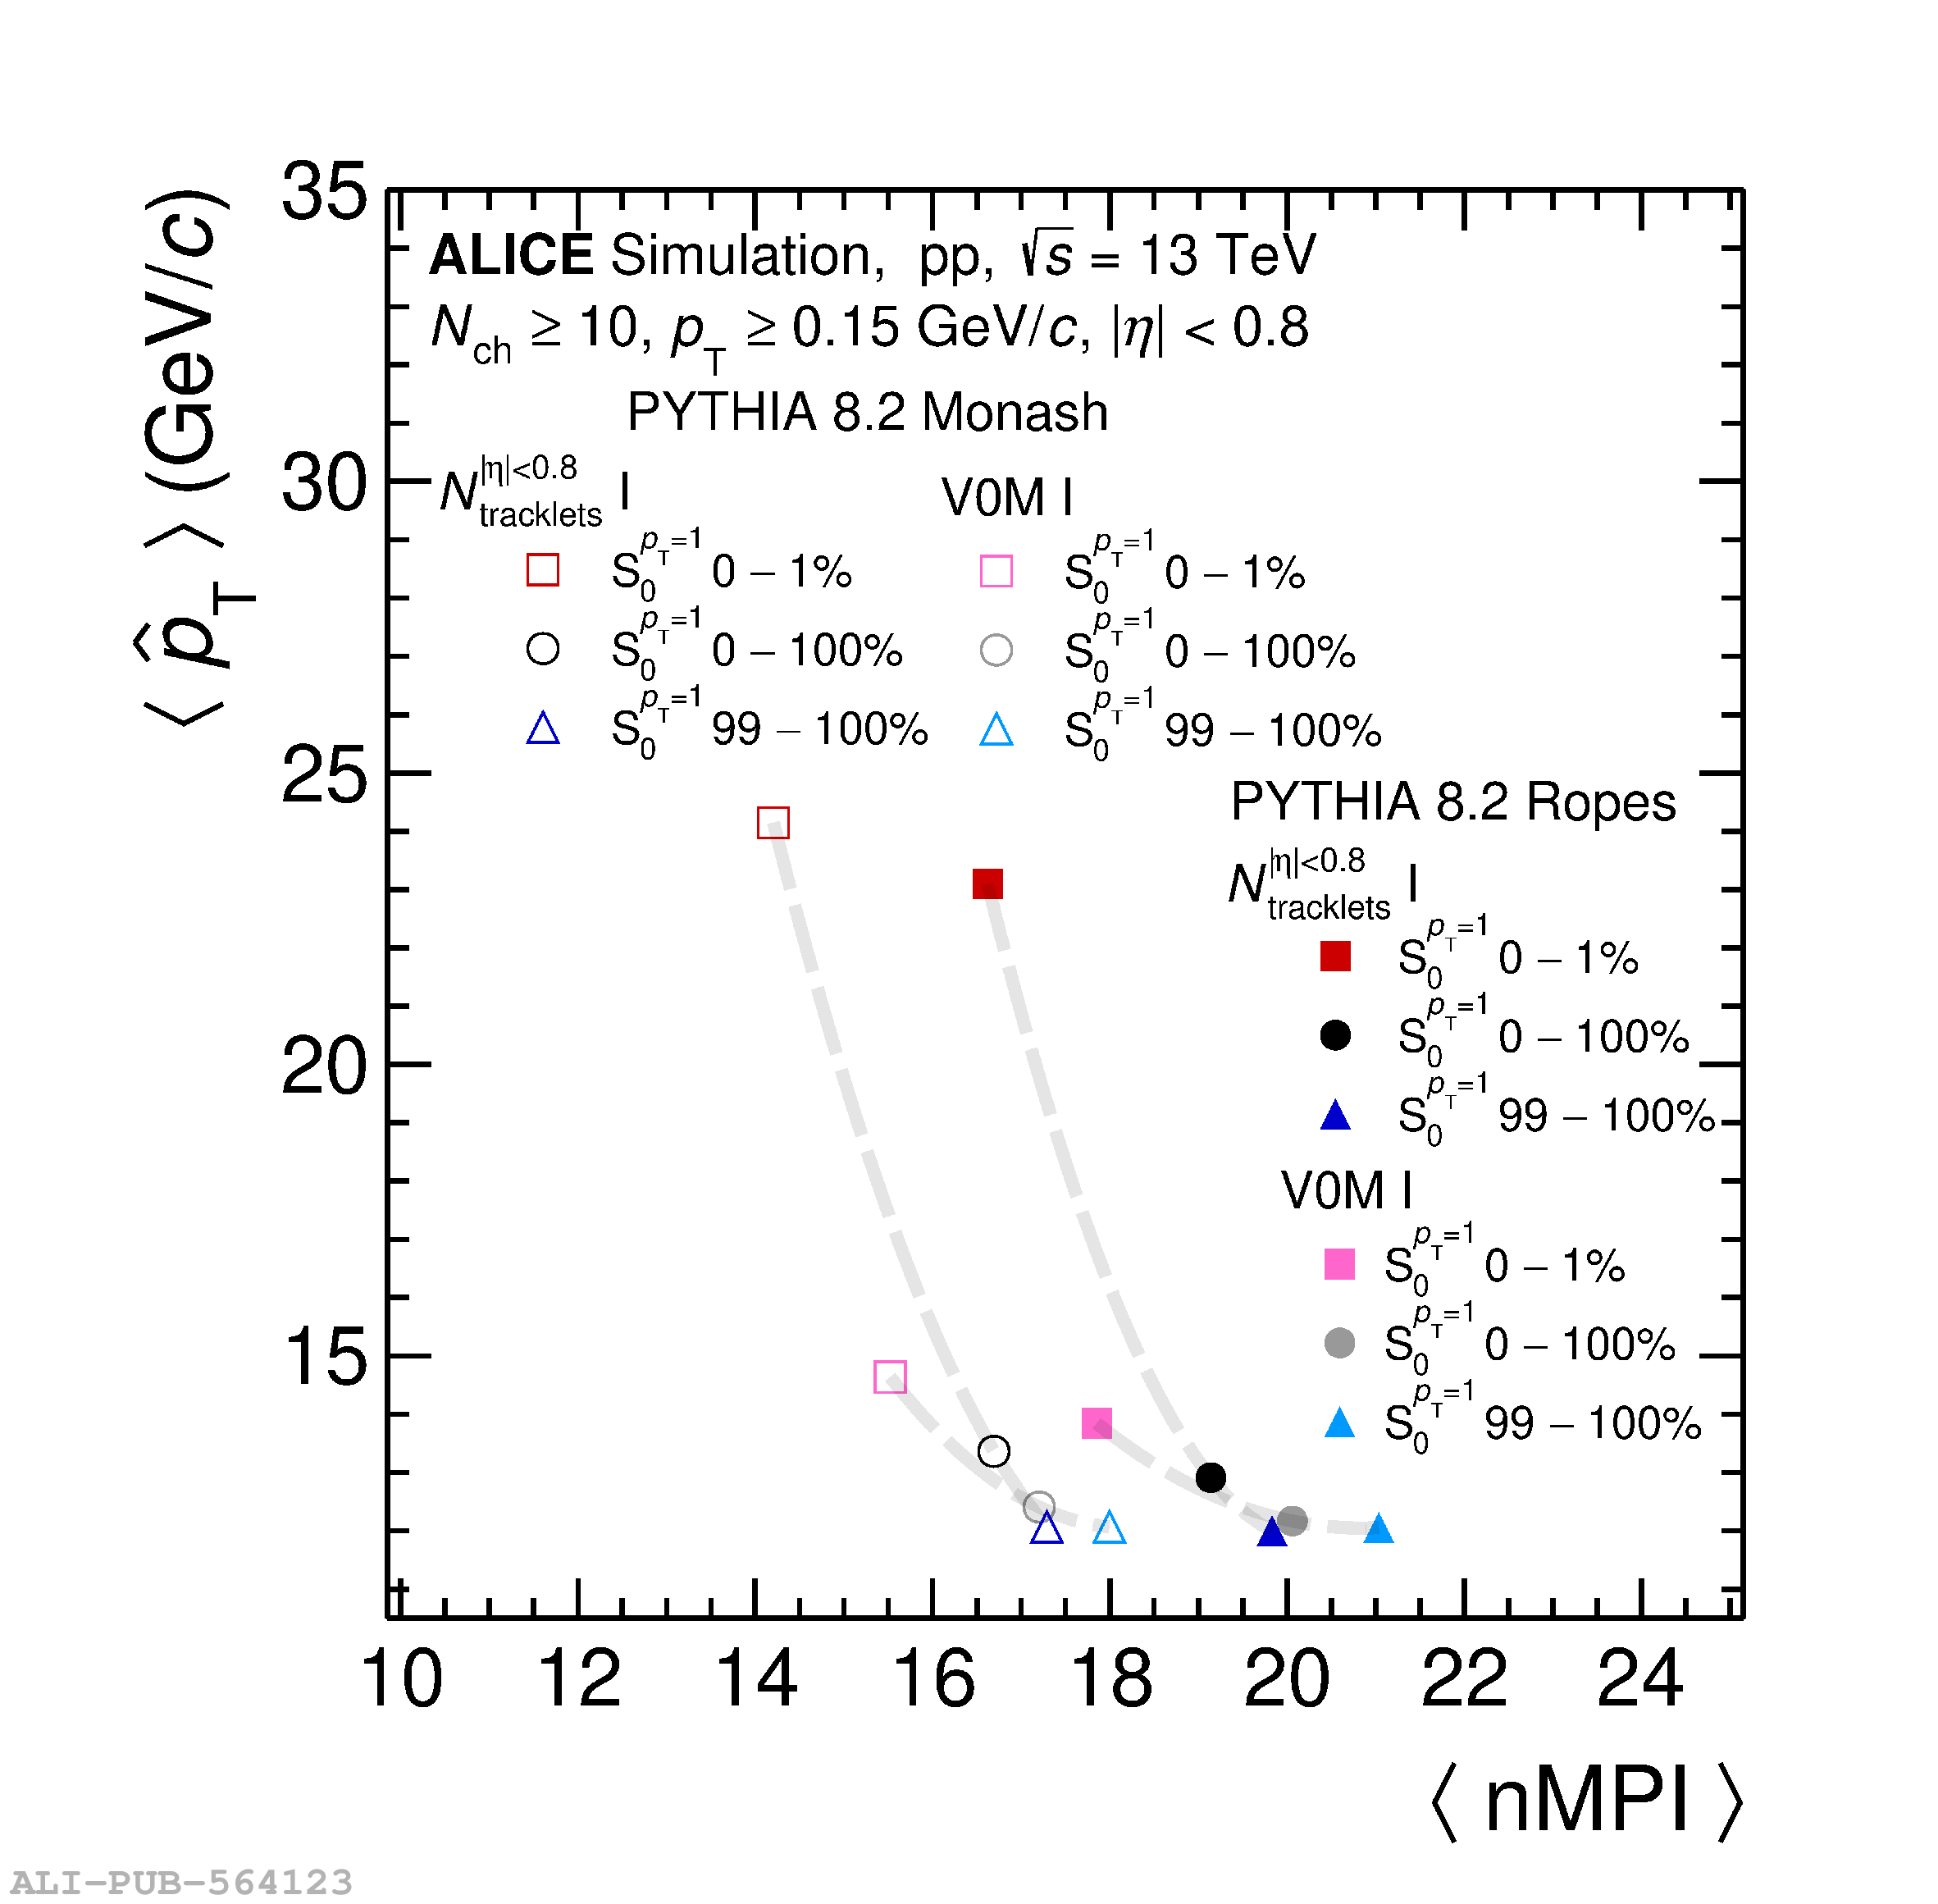 |