Upper panels: The measured and fully corrected \SOPT distributions. Lower panels: Ratio between model calculations and experimental data. These are presented for \tracklet 0--1\% (top), 0--10\% (middle) and V0M 0--1\% (bottom). The curves represent different model predictions, where the shaded area represents the statistical uncertainty of the models. The relative systematic uncertainty is shown as a gray area around unity in the lower panels. | 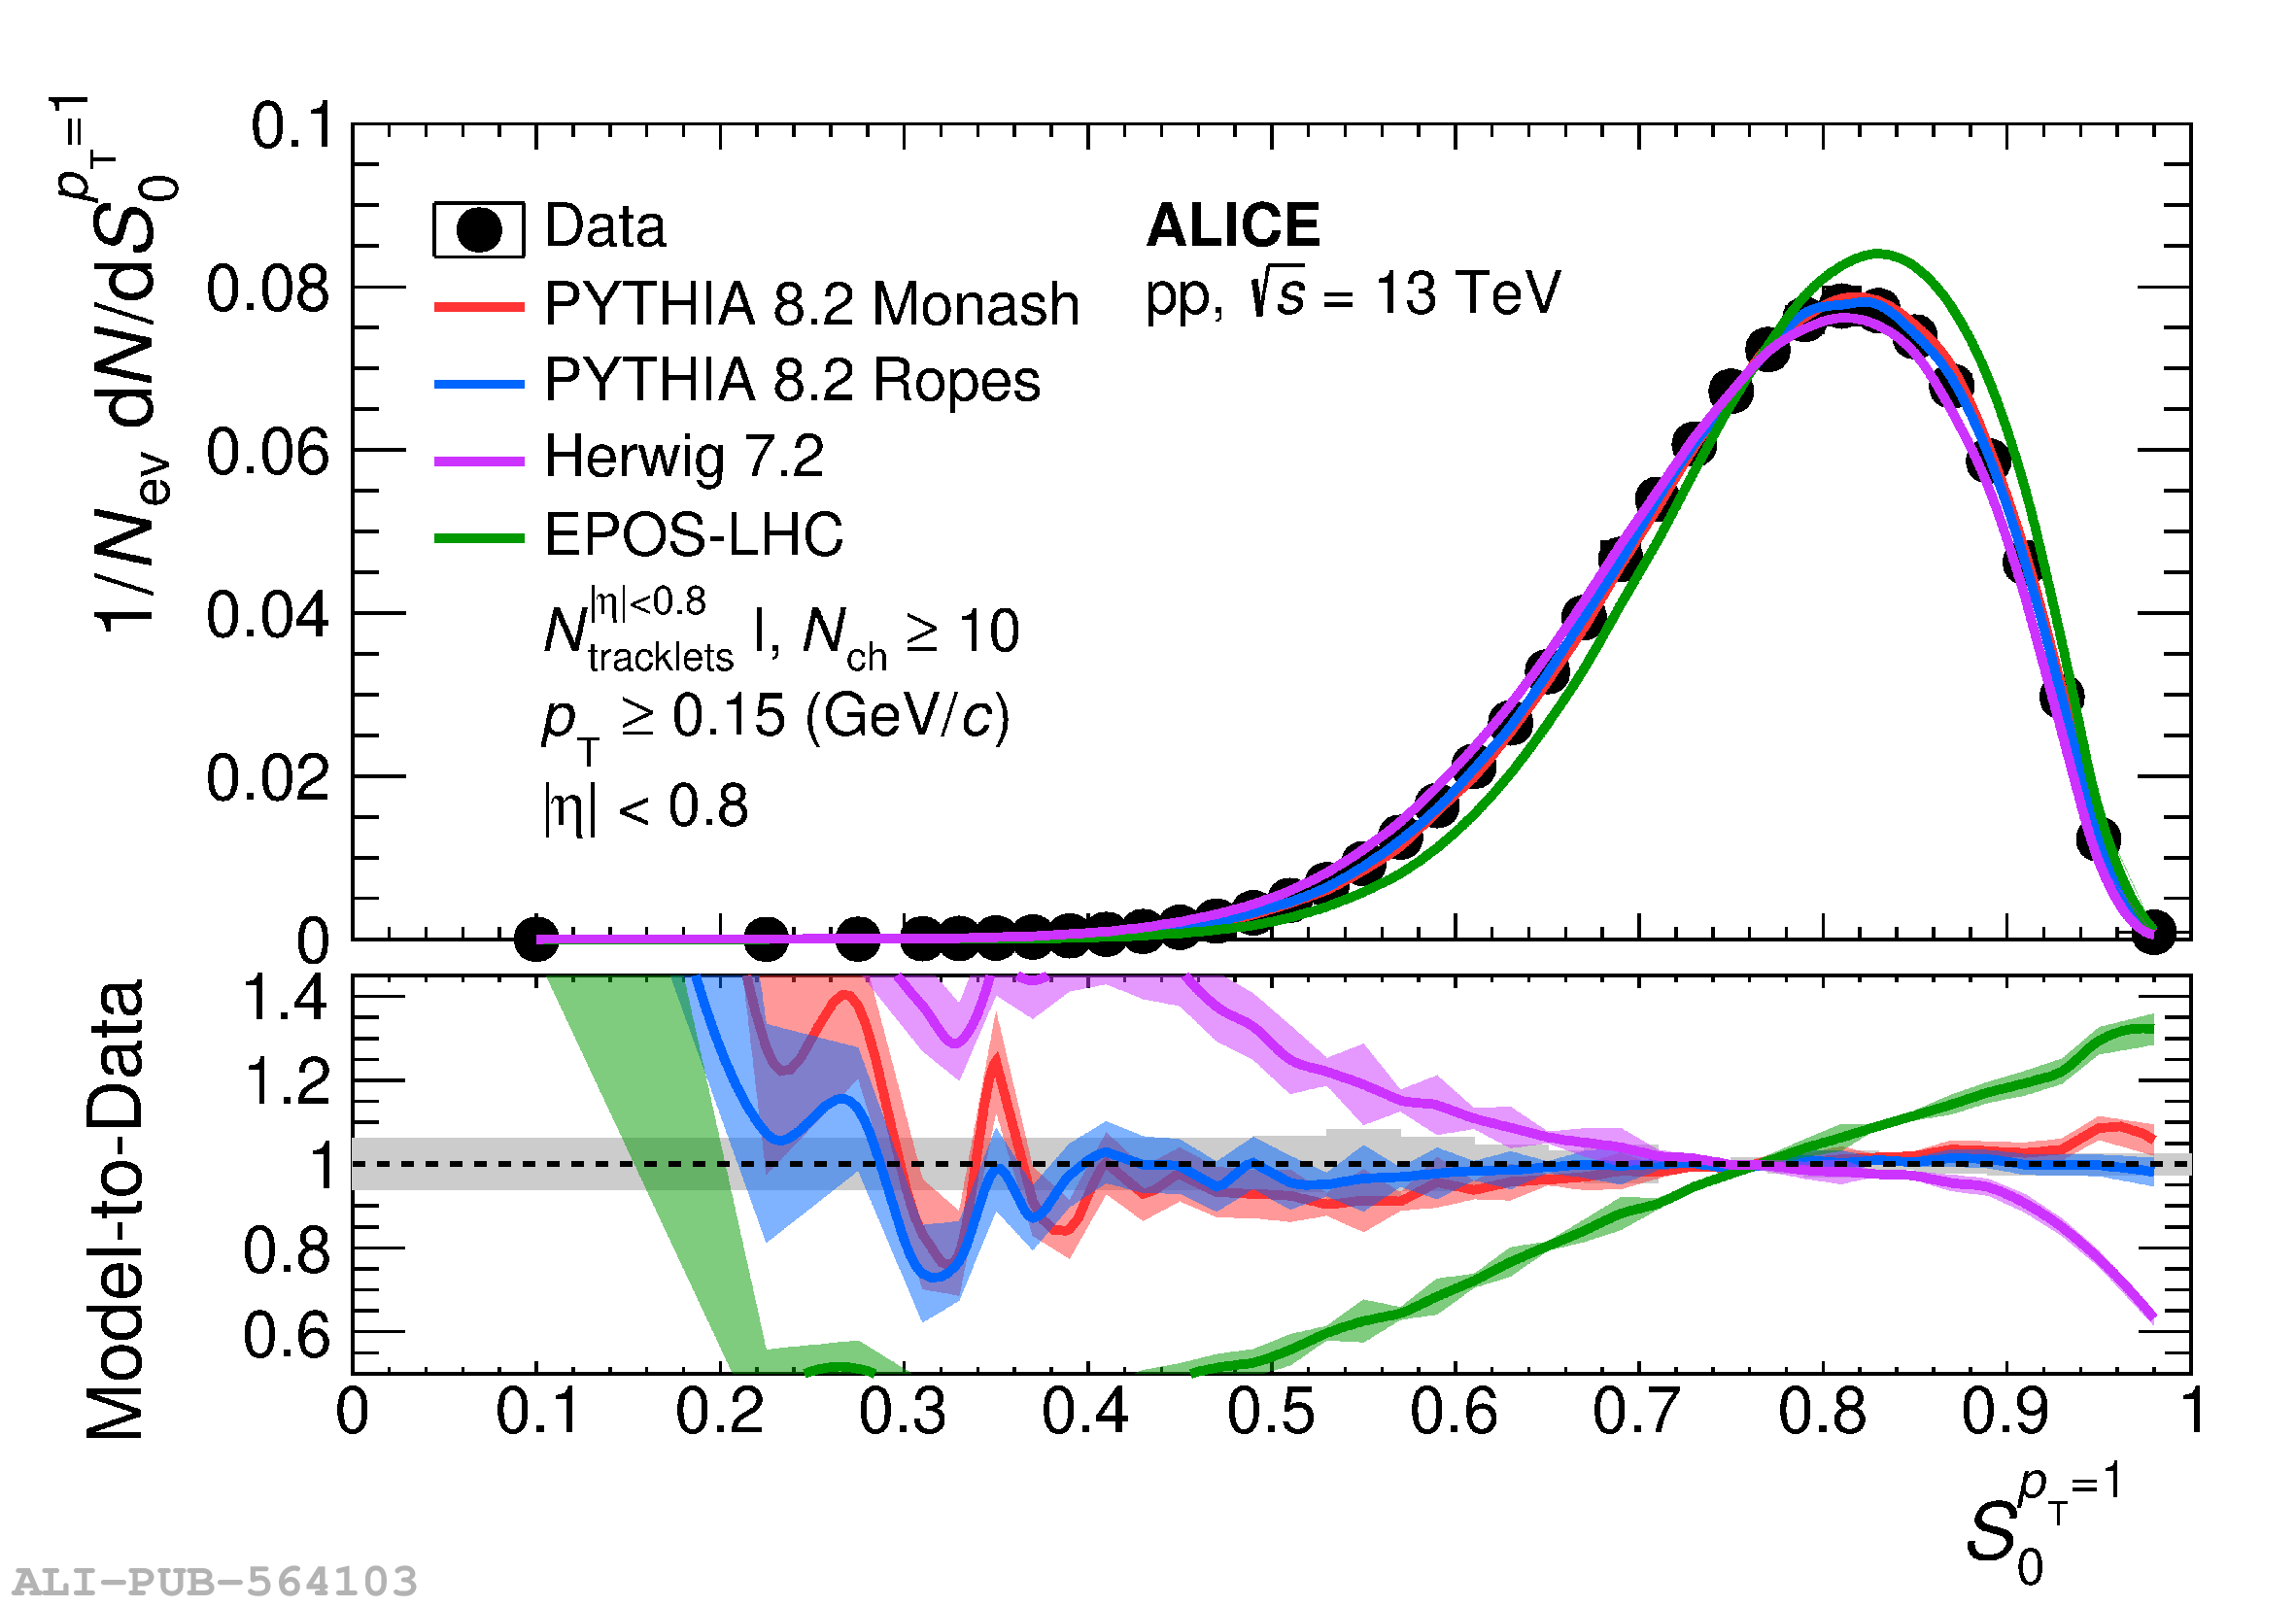 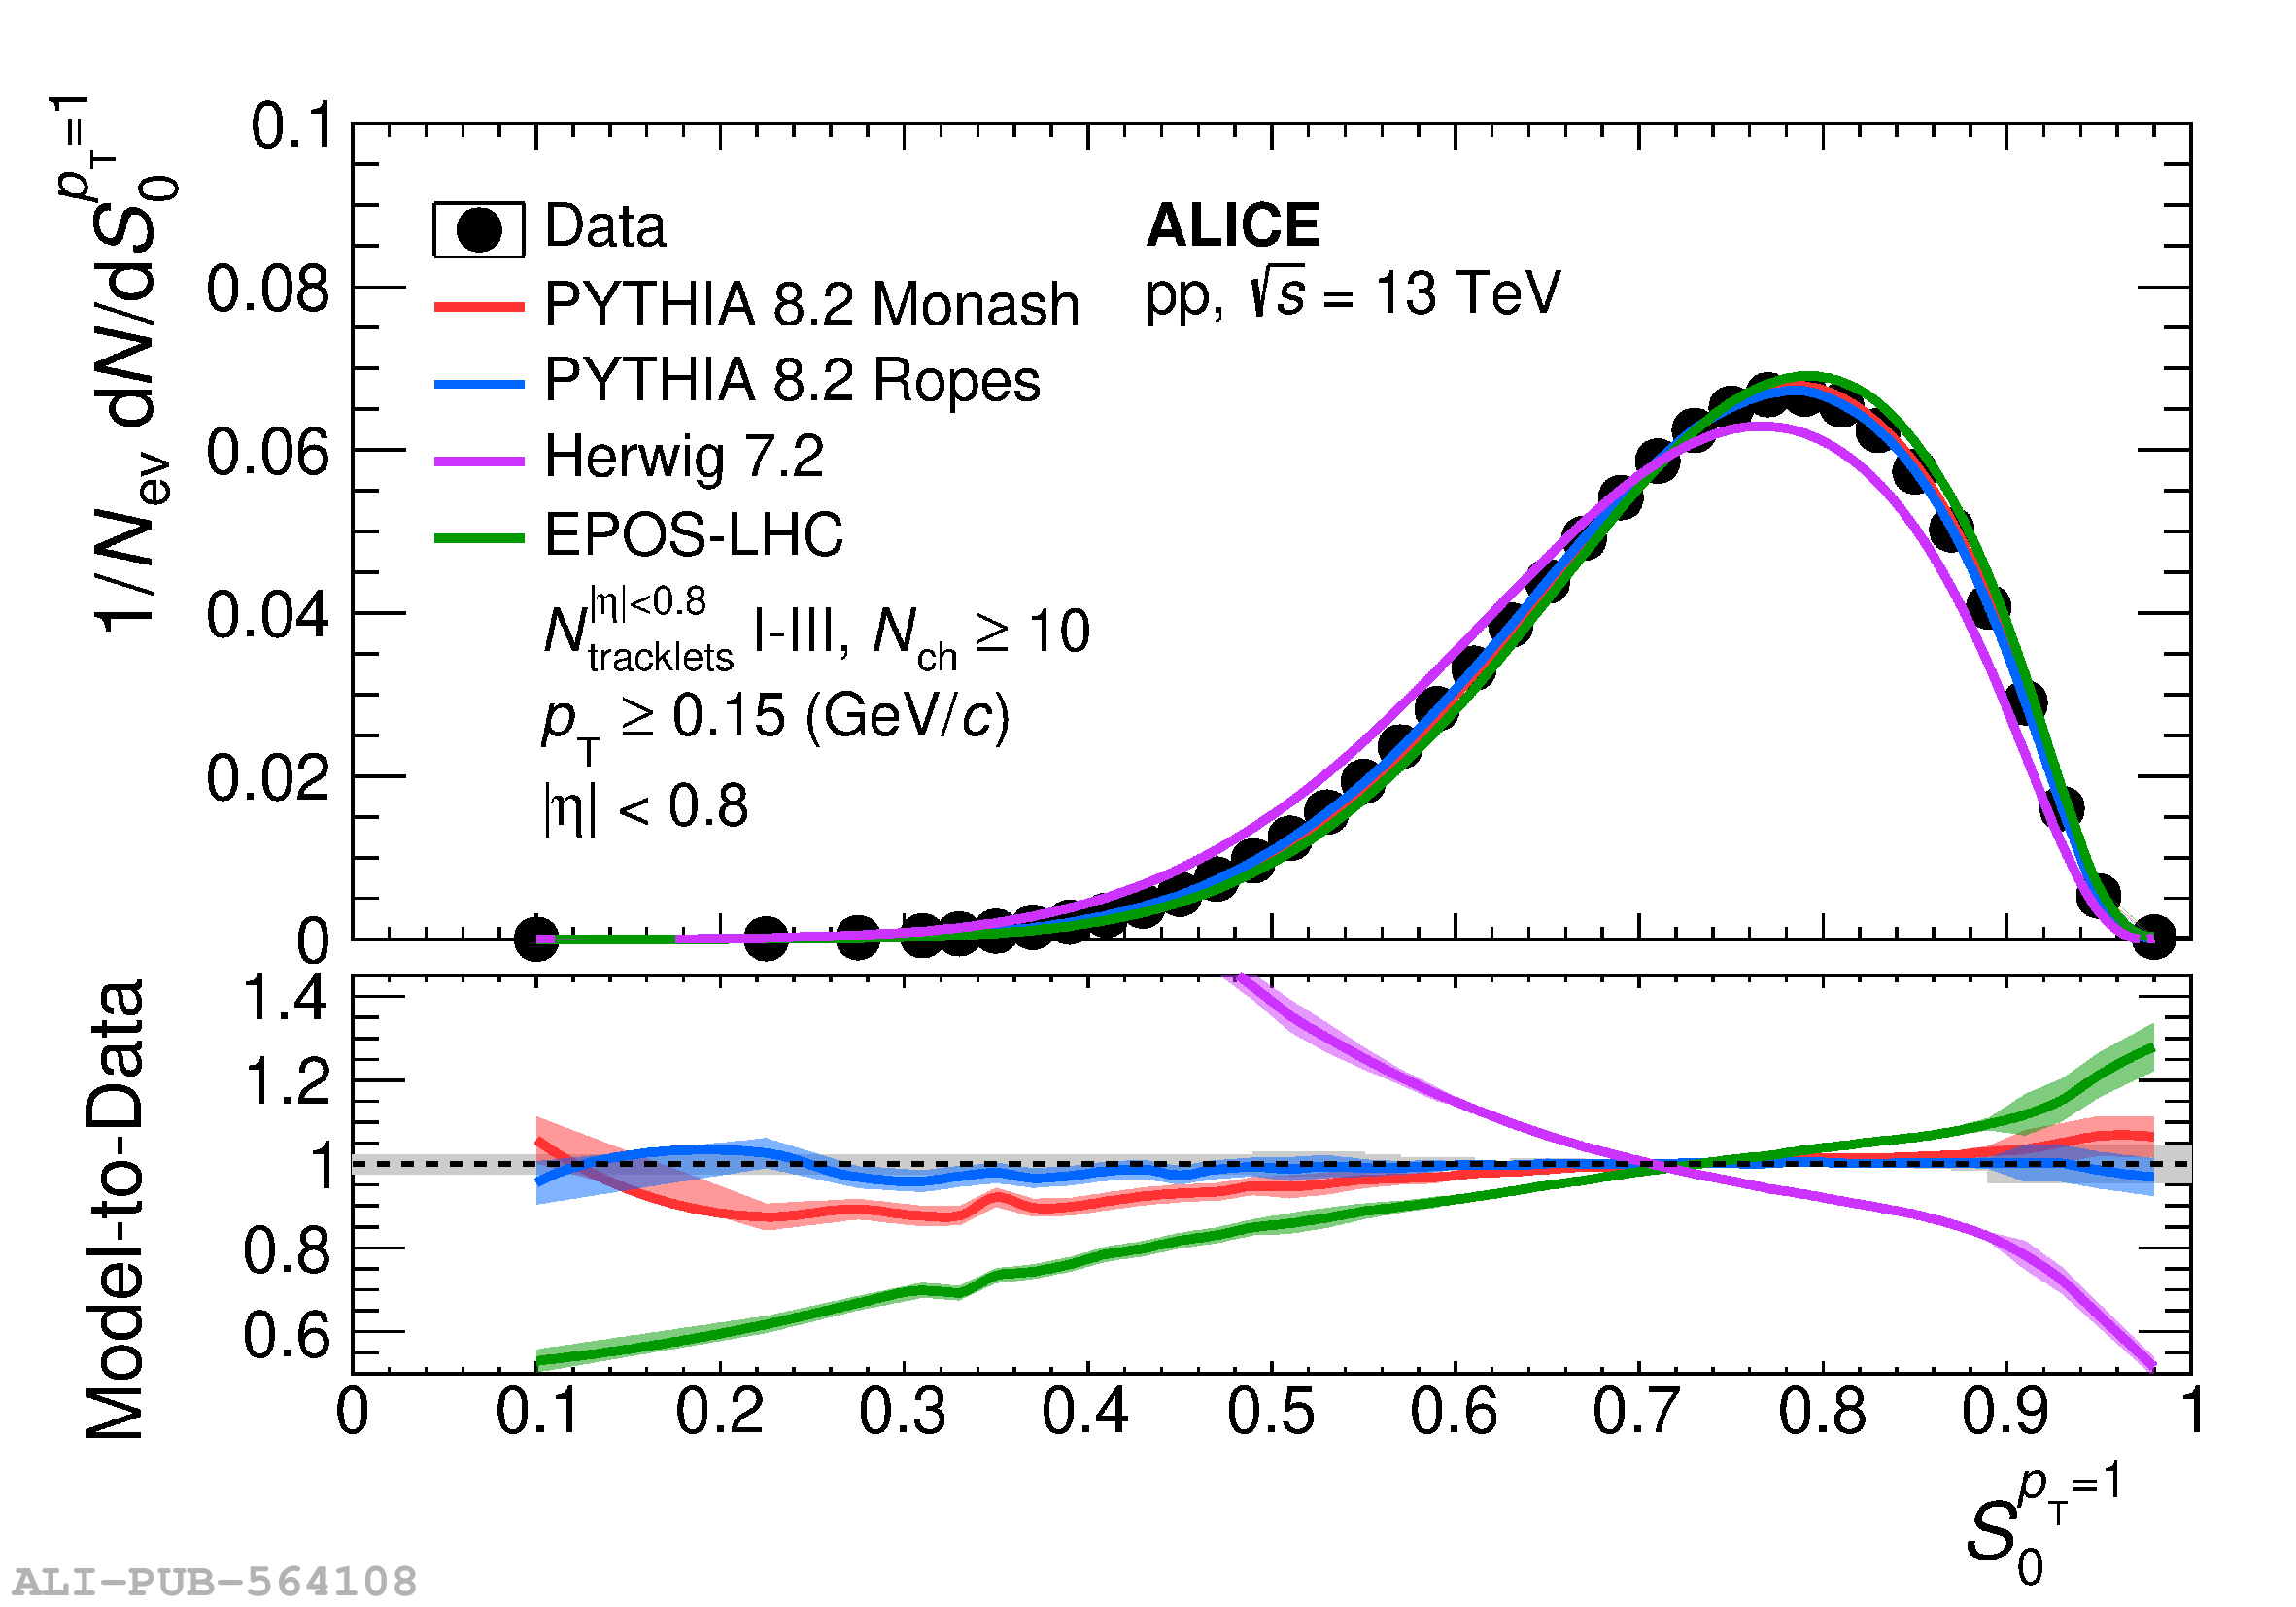 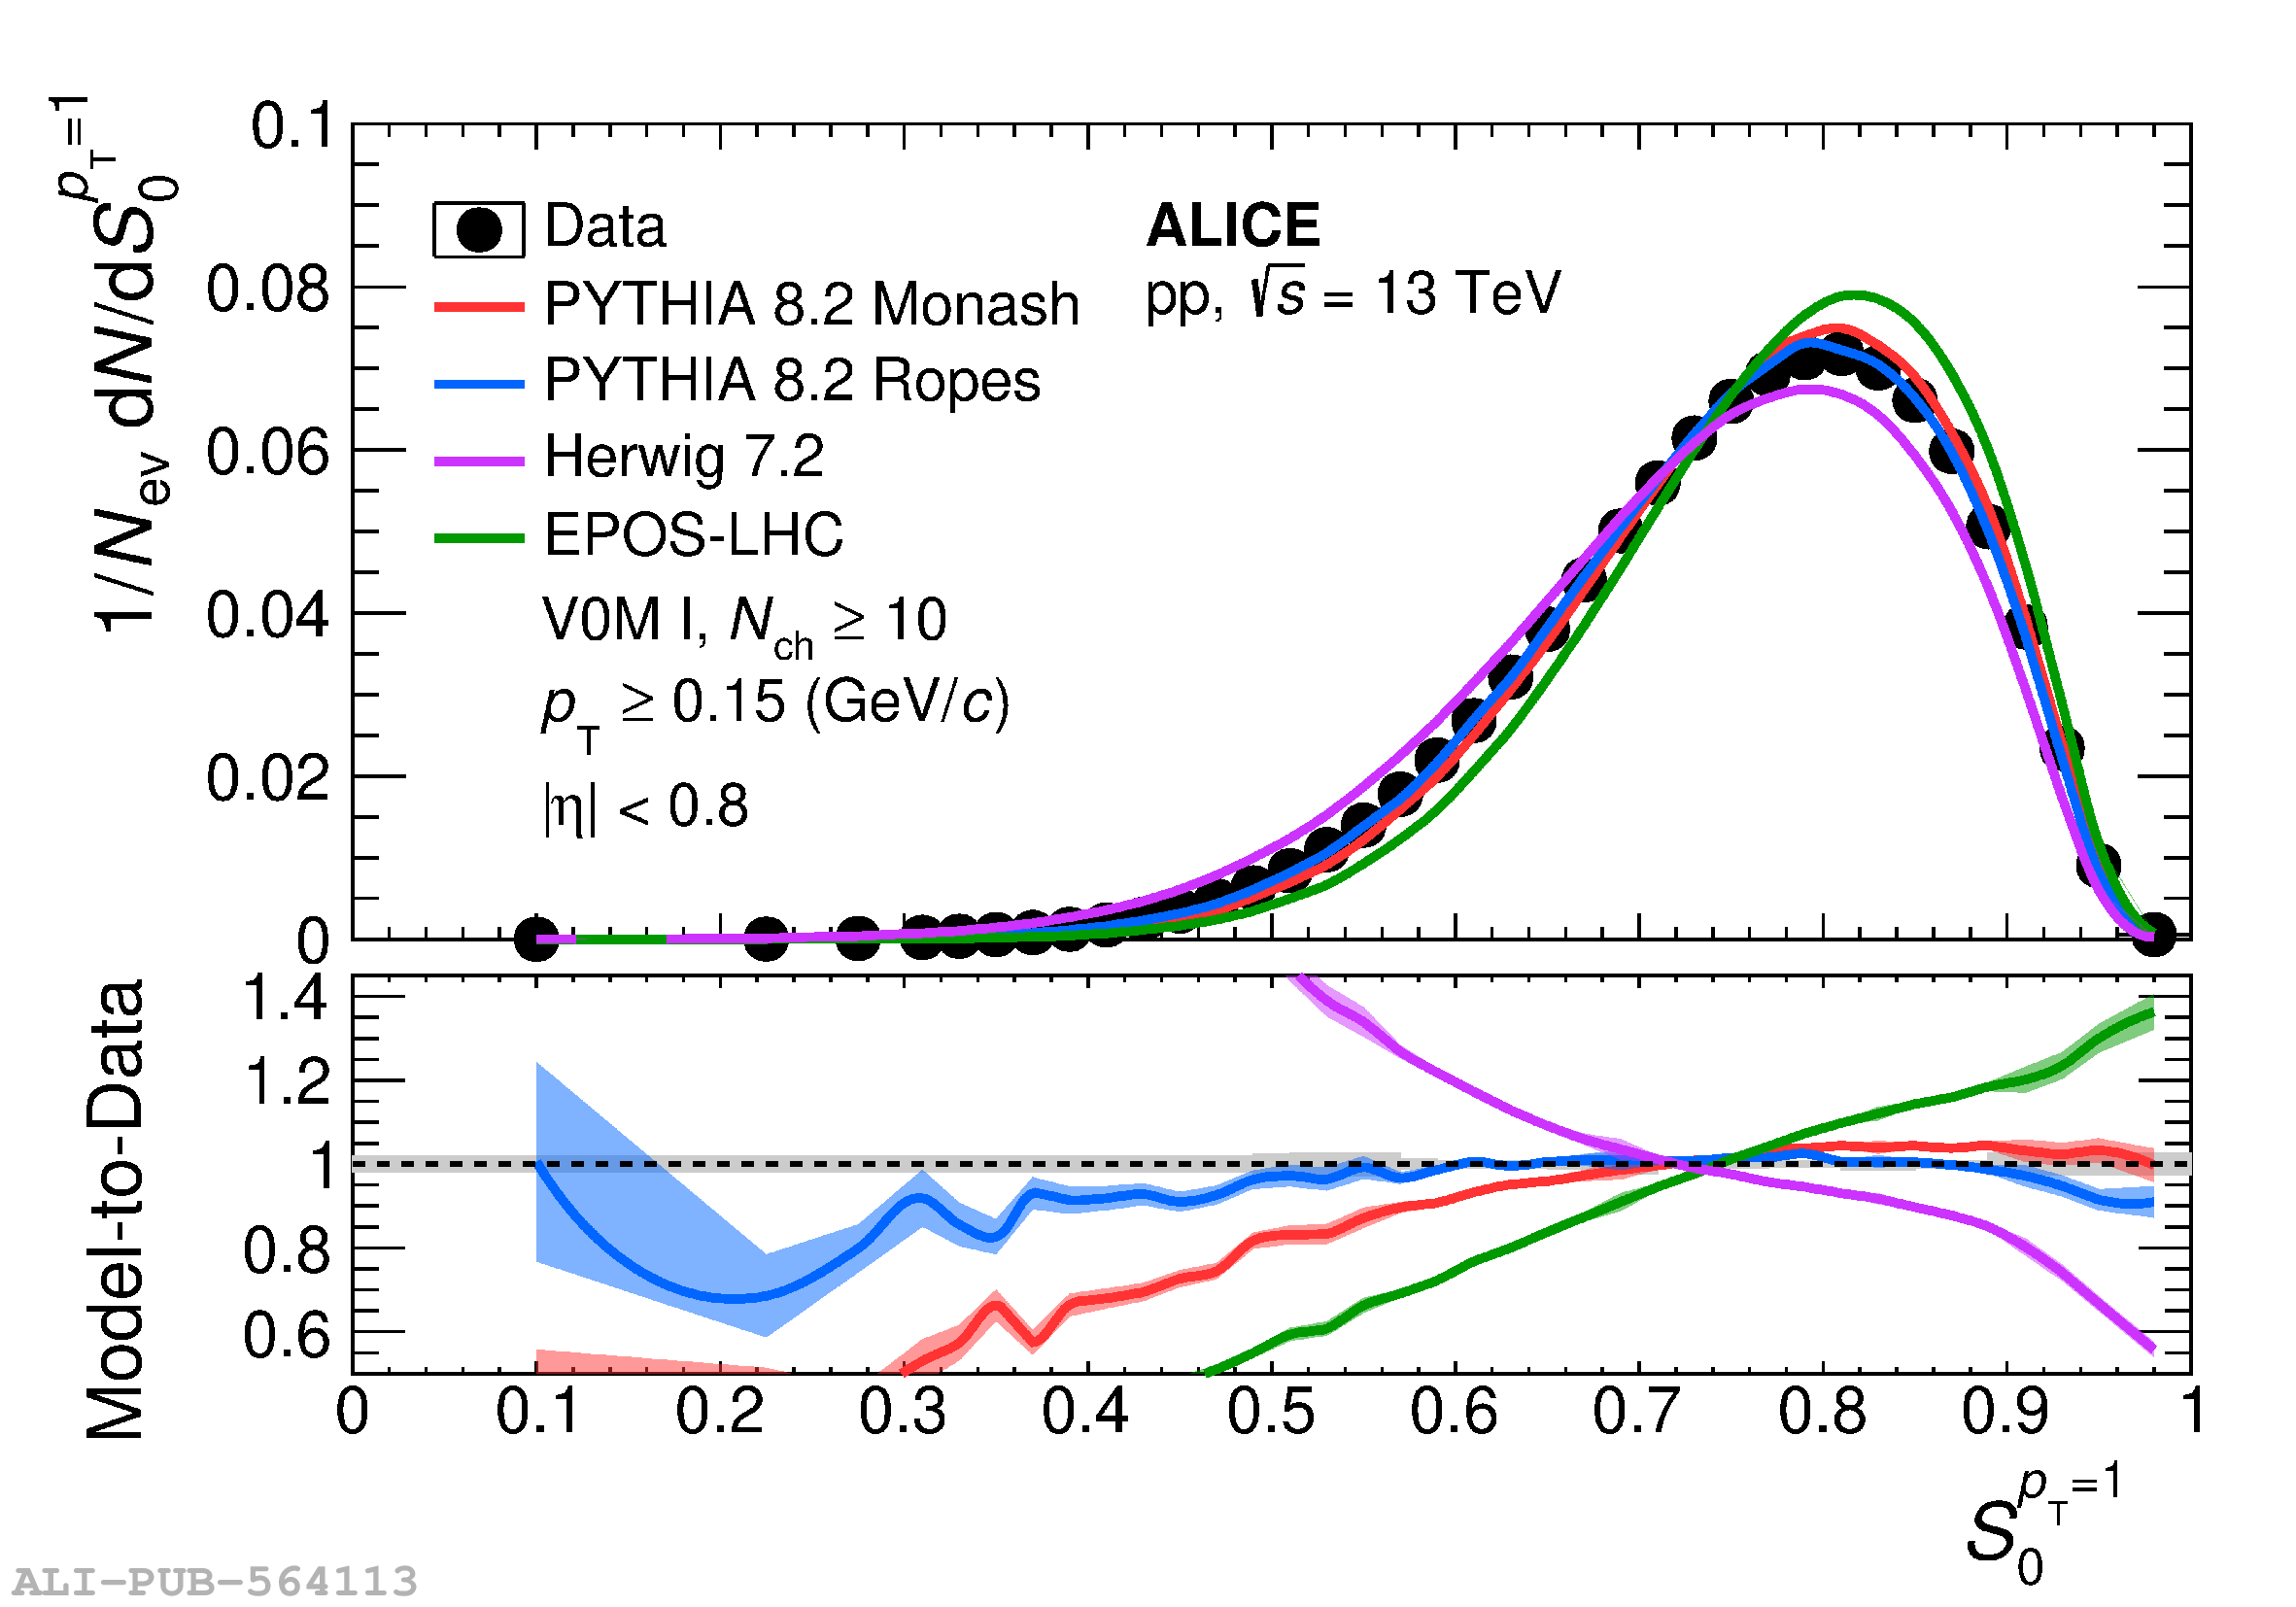 |