Ratio of model predictions to data for p-Pb collisions at various energies. The upper panels show it for the multiplicity distributions (left) and their KNO-scaling form (right), the bottom panels represent $\langle p_{\rm T} \rangle$ (left) and $\sigma (p_{\rm T})$ (right). The semi-transparent bands indicate the relative systematic uncertainties of the data. | 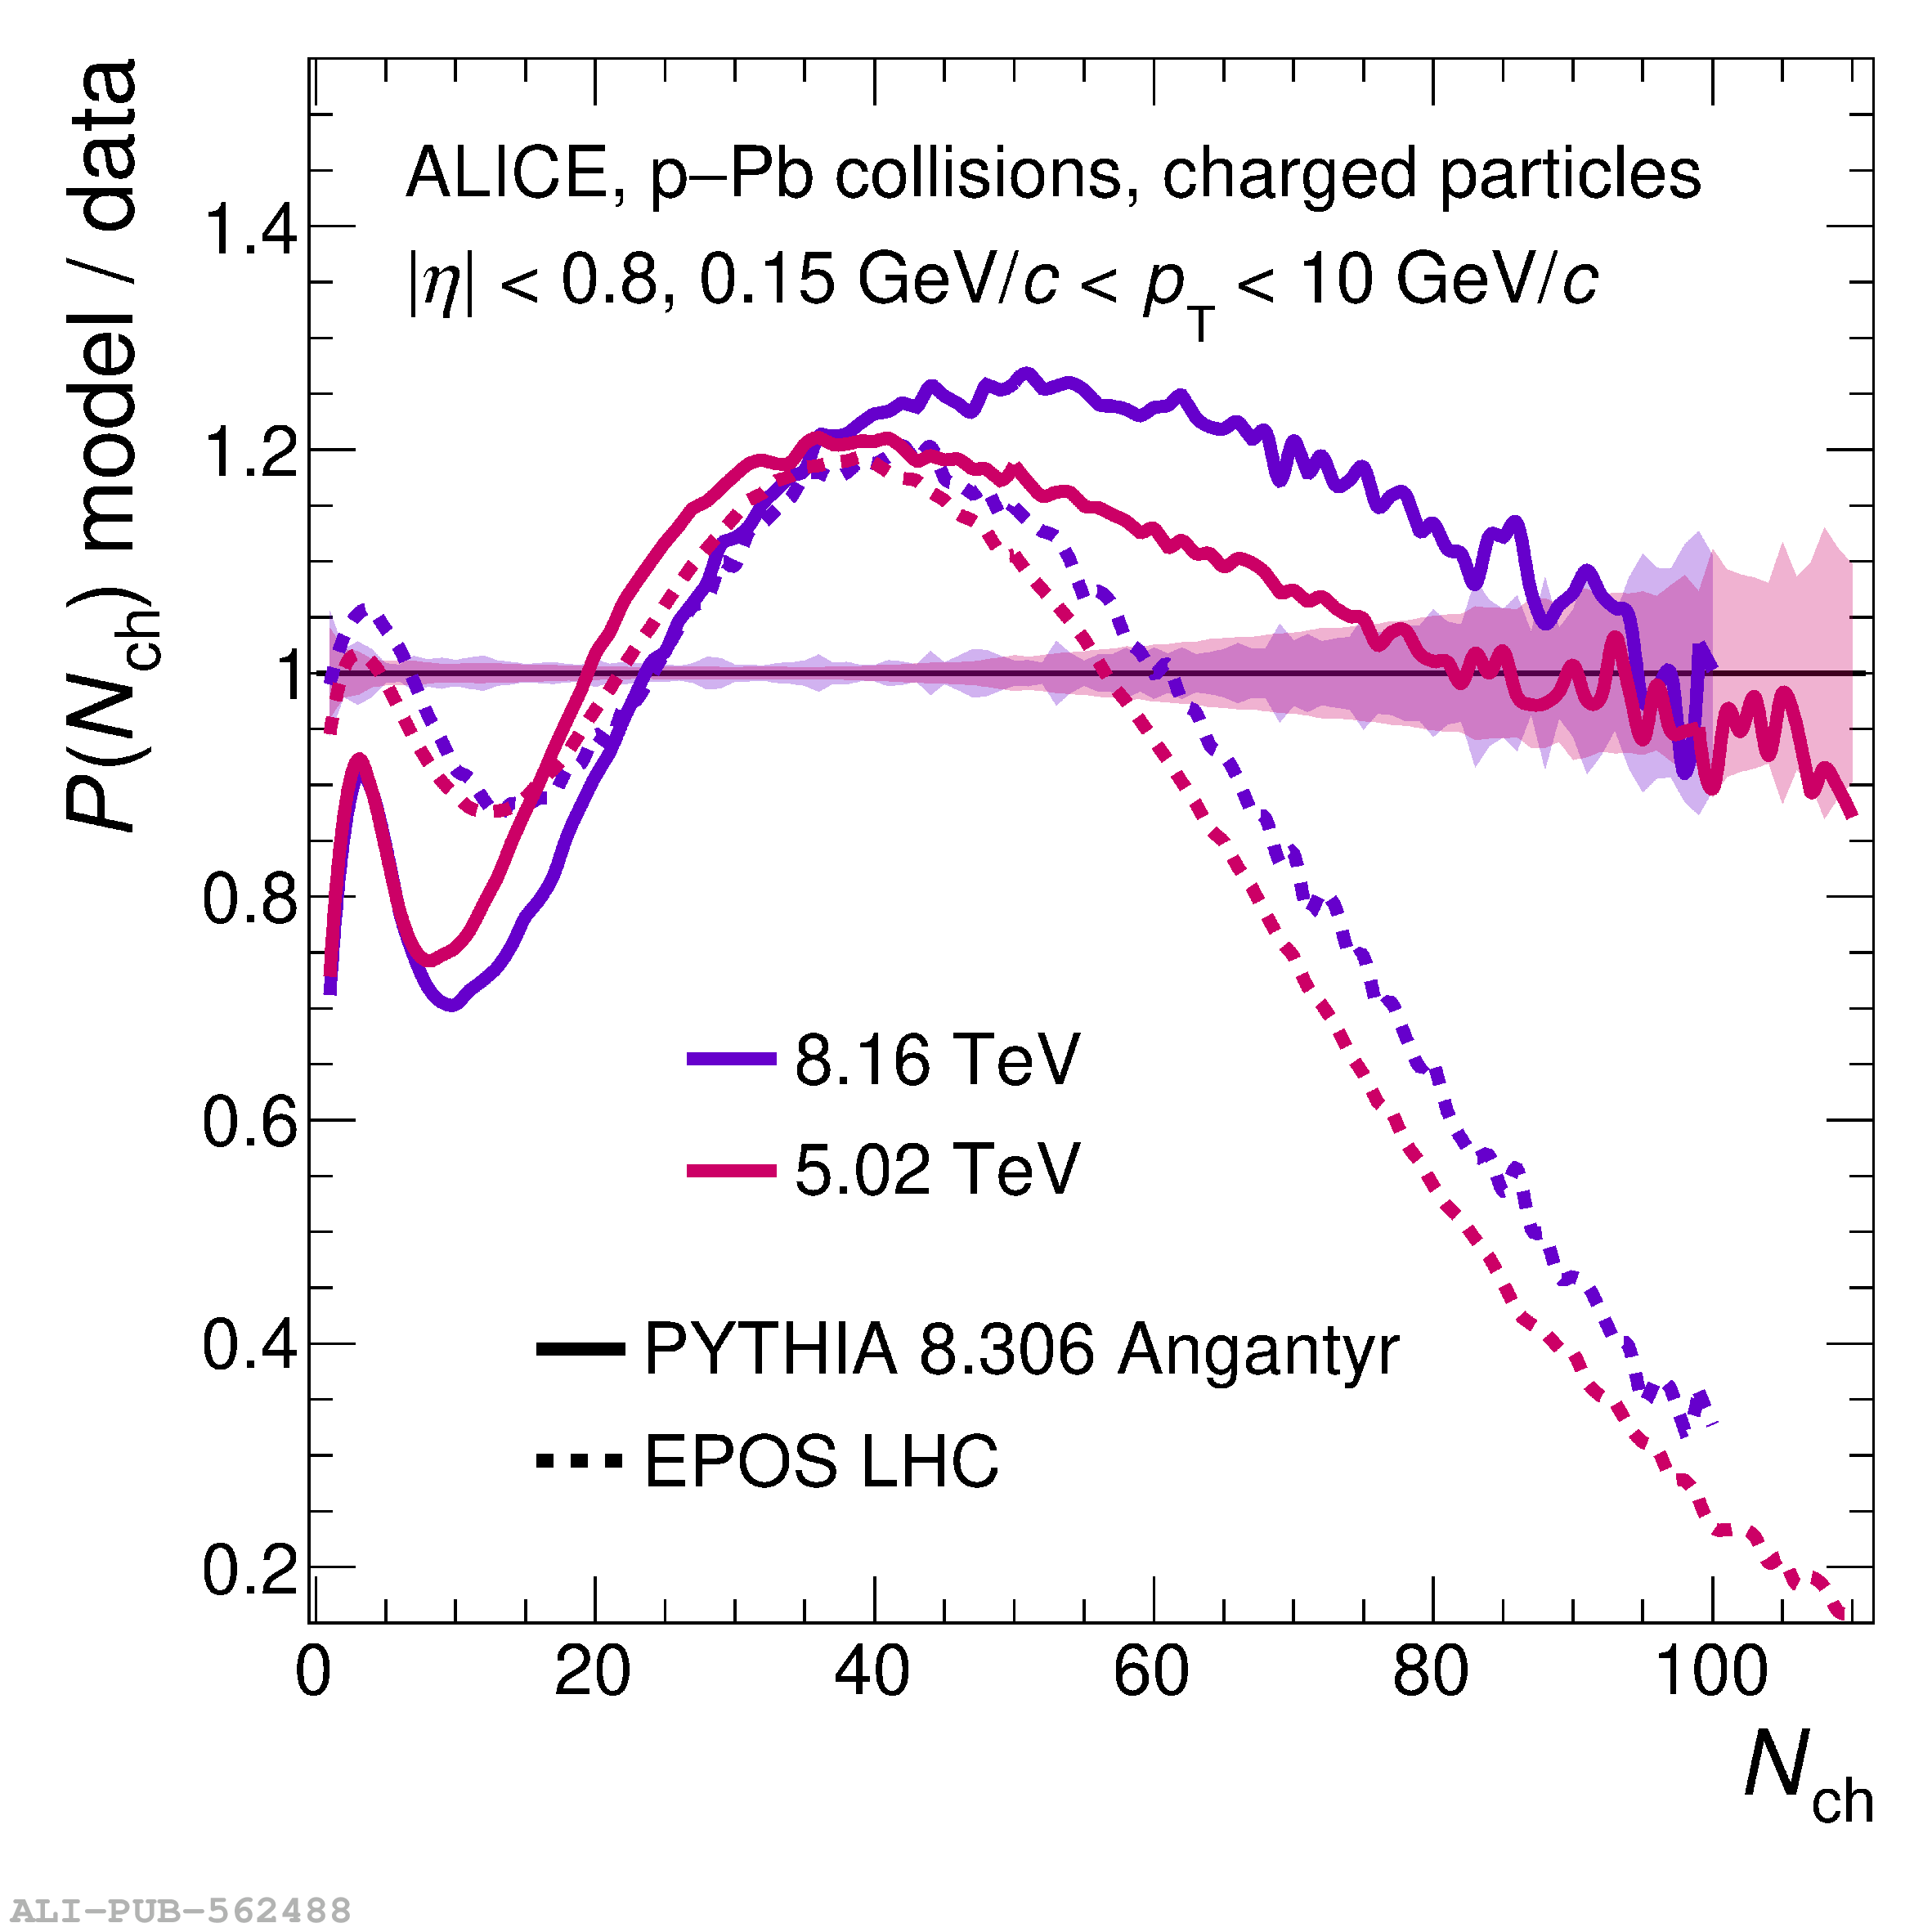 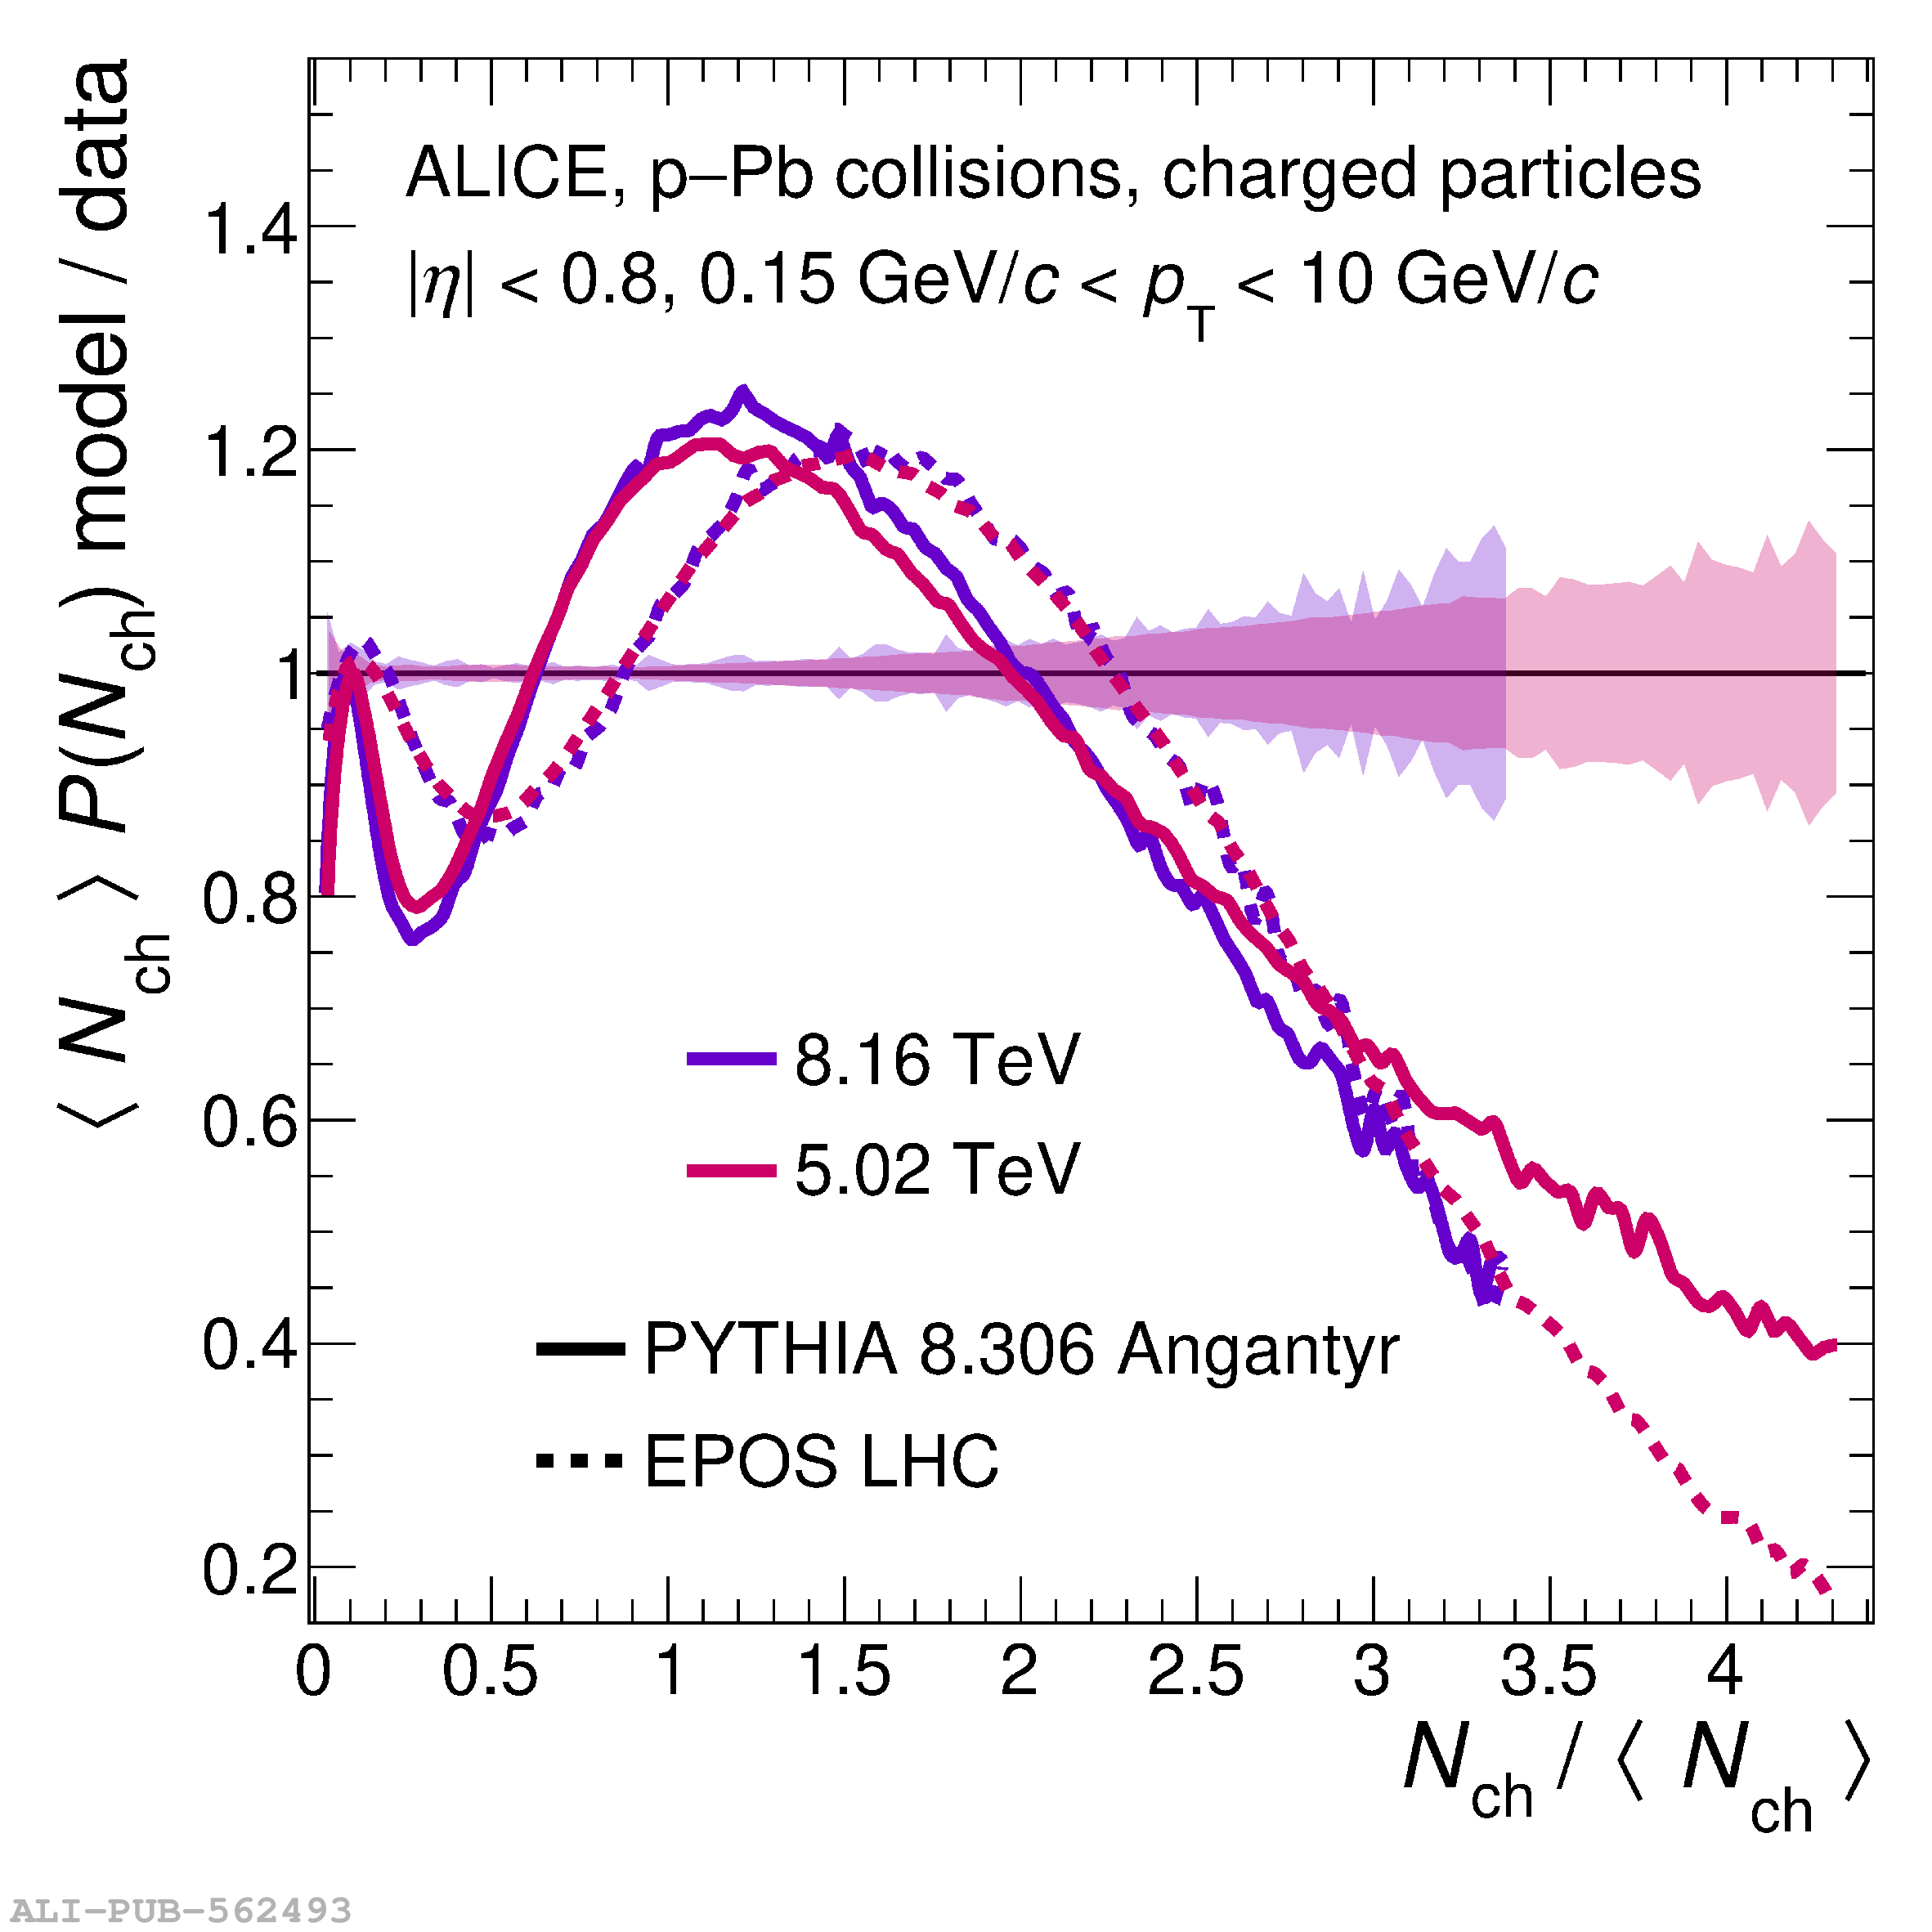  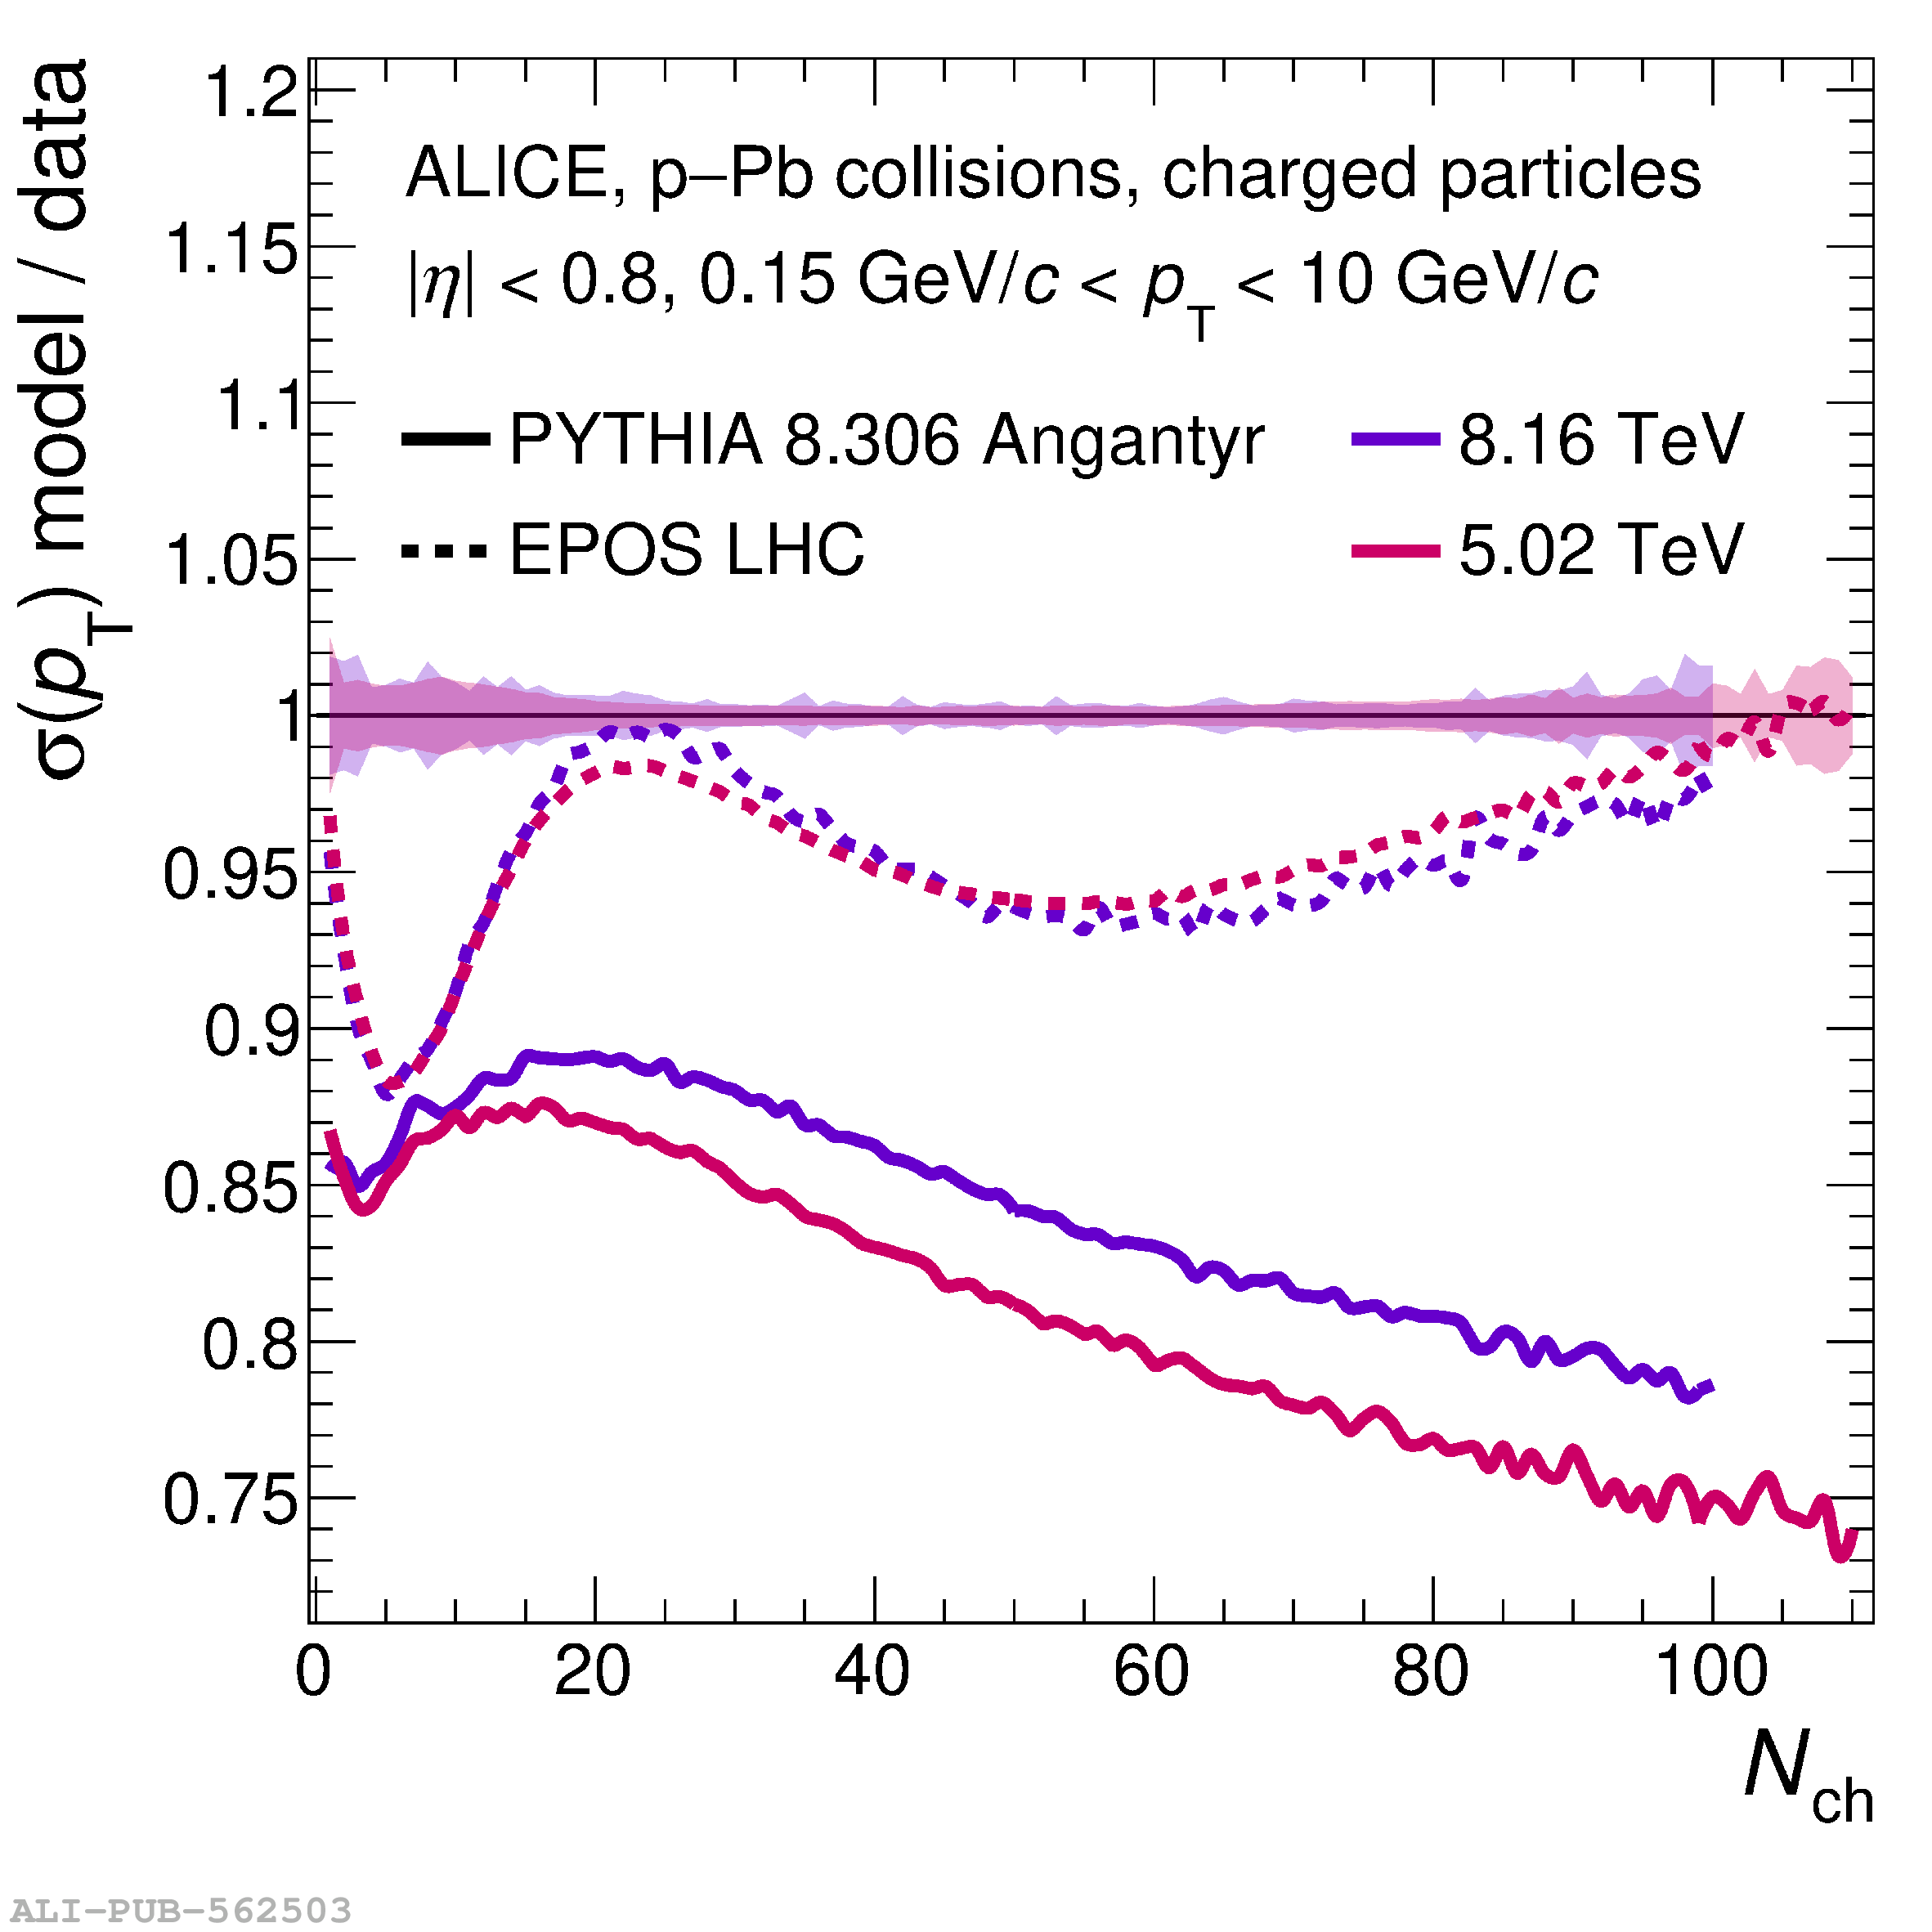 |