Top panel: the correlation of primary charged particle $p_{\rm T}$ spectra with multiplicity per $\nch > 0$ event for pp collisions at $\sqrt{s}$ = 5.02 TeV. Bottom panels: the corresponding relative change of $p_{\rm T}$ (left) and $N_{\rm ch}$ (right) distributions with respect to the inclusive ones. In the left panel, each of the curves represents a single $N_{\rm ch}$ value, ranging from $N_{\rm ch} = 1$ (blue) to $N_{\rm ch} = 55$ (red). In the right panel, the colours represent the $p_{\rm T}$ intervals used in this analysis from the lowest in blue to the highest one in red. | 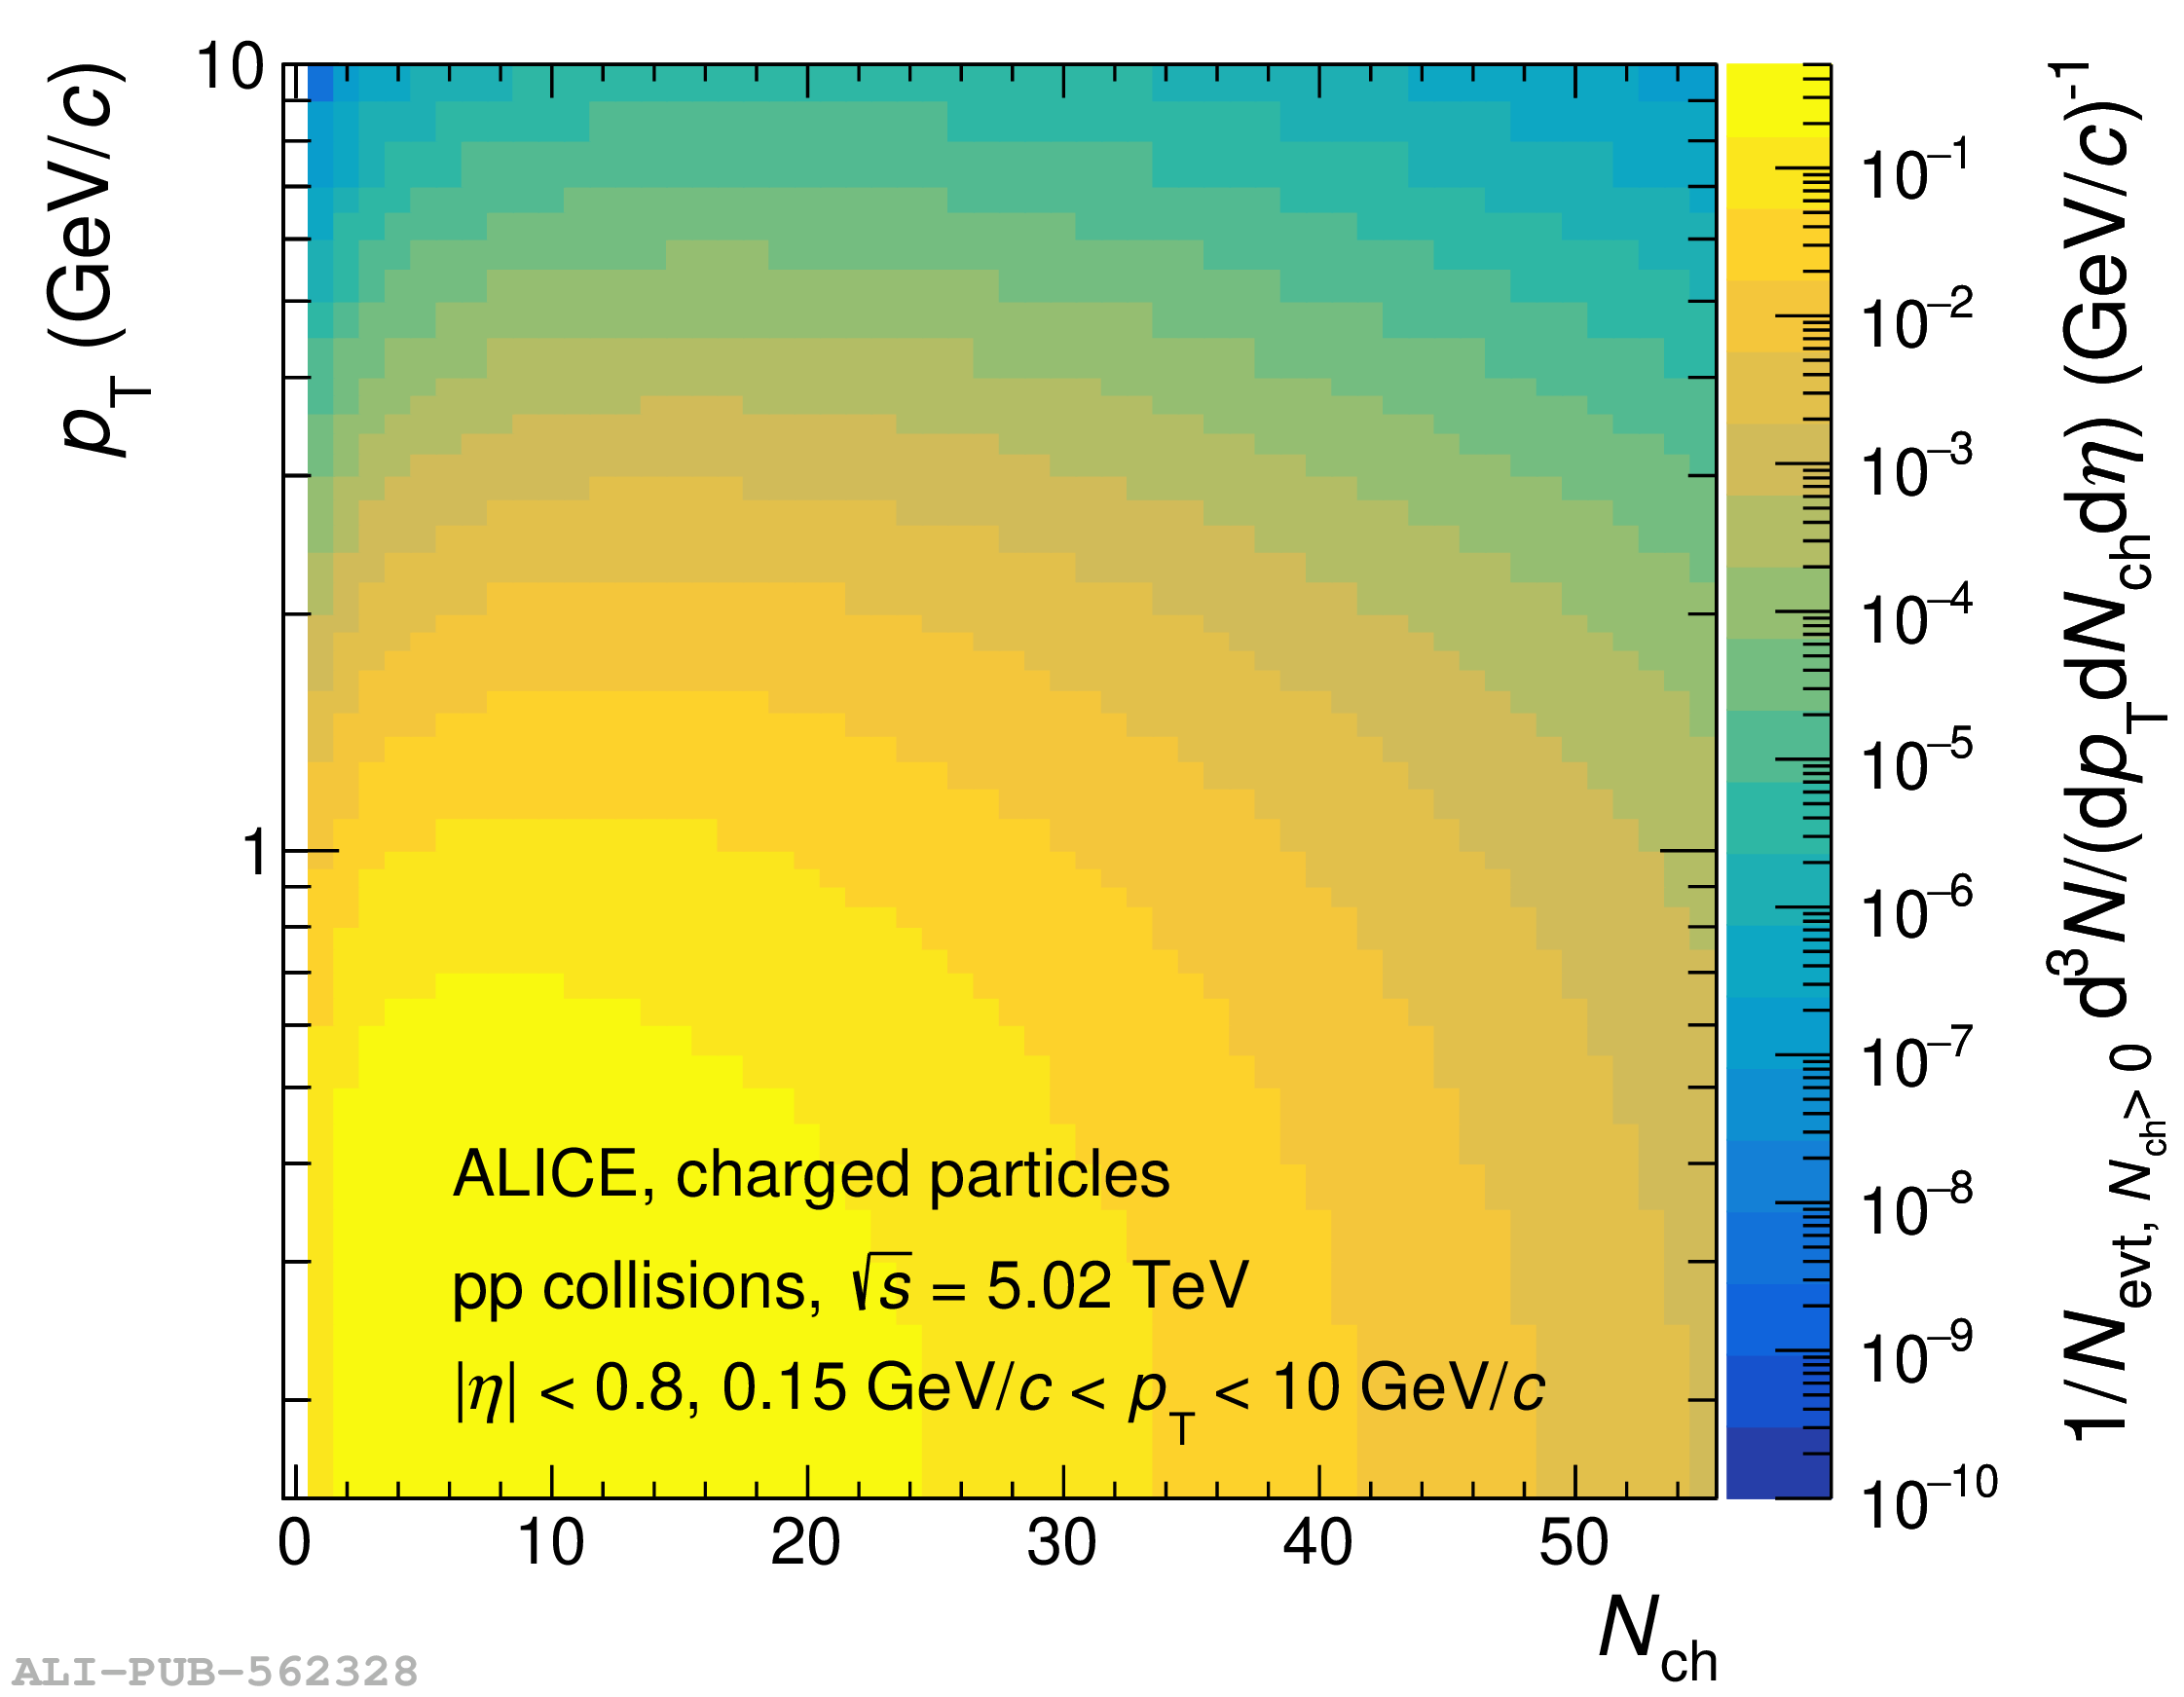 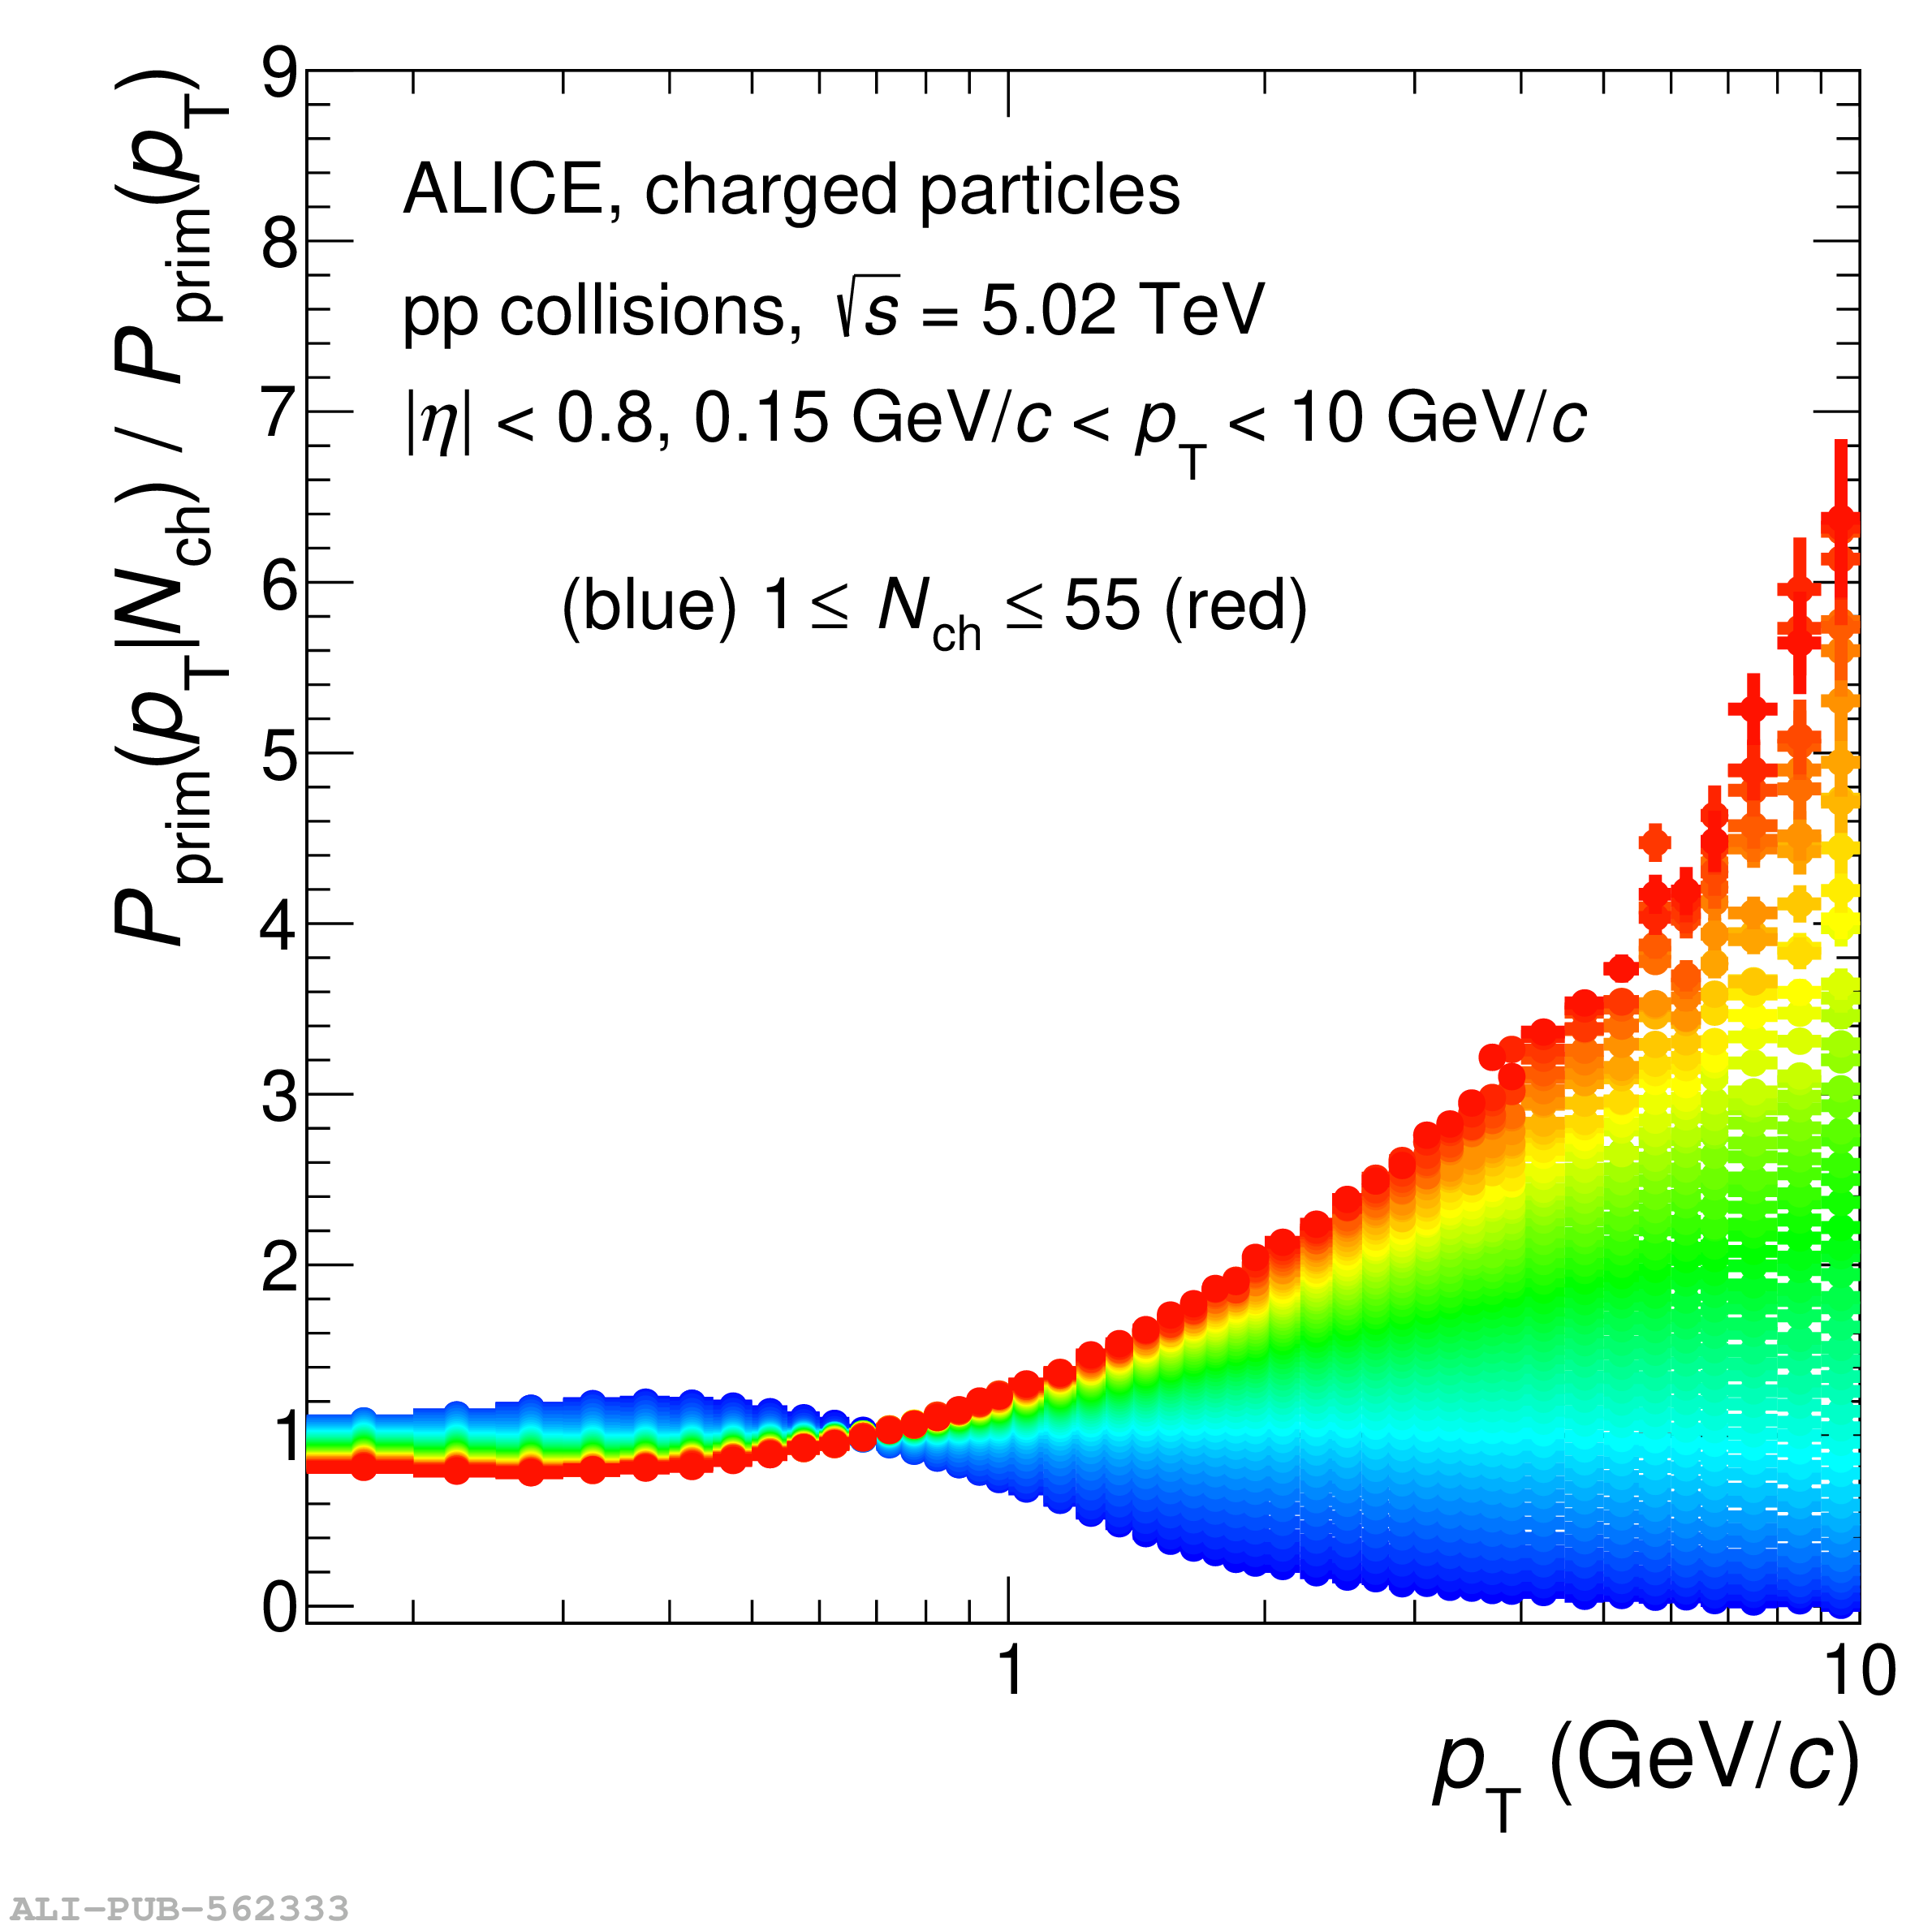  |