Measurements of the production cross sections of prompt ${\rm D^0}$, ${\rm D^+}$, ${\rm D^{\ast +}}$, ${\rm D_s^+}$, ${\rm \Lambda_{c}^{+}}$, and ${\rm \Xi_{c}^{+}}$ charm hadrons at midrapidity in proton$-$proton collisions at $\sqrt{s}=13$ TeV with the ALICE detector are presented. The D-meson cross sections as a function of transverse momentum ($p_{\rm T}$) are provided with improved precision and granularity. The ratios of $p_{\rm T}$-differential meson production cross sections based on this publication and on measurements at different rapidity and collision energy provide a constraint on gluon parton distribution functions at low values of Bjorken-$x$ ($10^{-5}-10^{-4}$). The measurements of ${\rm \Lambda_{c}^{+}}$ (${\rm \Xi_{c}^{+}}$) baryon production extend the measured $p_{\rm T}$ intervals down to $p_{\rm T}=0(3)$~GeV$/c$. These measurements are used to determine the charm-quark fragmentation fractions and the ${\rm c\overline{c}}$ production cross section at midrapidity ($|y|<~0.5$) based on the sum of the cross sections of the weakly-decaying ground-state charm hadrons ${\rm D^0}$, ${\rm D^+}$, ${\rm D_s^+}$, ${\rm \Lambda_{c}^{+}}$, ${\rm \Xi_{c}^{0}}$ and, for the first time, ${\rm \Xi_{c}^{+}}$, and of the strongly-decaying J/$psi$ mesons. The first measurements of ${\rm \Xi_{c}^{+}}$ and ${\rm \Sigma_{c}^{0,++}}$ fragmentation fractions at midrapidity are also reported. A significantly larger fraction of charm quarks hadronising to baryons is found compared to e$^+$e$^-$ and ep collisions. The ${\rm c\overline{c}}$ production cross section at midrapidity is found to be at the upper bound of state-of-the-art perturbative QCD calculations.
JHEP 12 (2023) 086
HEP Data
e-Print: arXiv:2308.04877 | PDF | inSPIRE
CERN-EP-2023-162
Figure group
Figure 1
Invariant mass or mass-difference distributions of $\Dzero$-meson candidates (top-left), $\Dplus$-meson candidates (top-right), $\Dstar$-meson candidates (bottom-left), $\Ds$-meson candidates (bottom-right), and charge conjugates in $0< \pt < 0.5$ GeV$/c$, $0< \pt < 1$ GeV$/c$, $1.5< \pt < 2.0$ GeV$/c$, and $1< \pt < 2$ GeV$/c$, respectively. The blue solid lines show the total fit functions as described in the text and the red dashed lines represent the background. In the case of $\Dzero$, the combinatorial background estimated with the track-rotation technique was subtracted, the red-dashed line is the residual background, and the green line represents the contribution of the reflections. In the case of $\Ds$, the peak at lower invariant mass represents the reconstructed $\Dplus\rightarrow {\rm K^+ K^-} \pip$ signal. The values of the mean ($\mu$) and the peak width ($\sigma$) of the signal peak are reported together with the signal counts (S). The reported uncertainties are only the statistical uncertainties from the fit. | 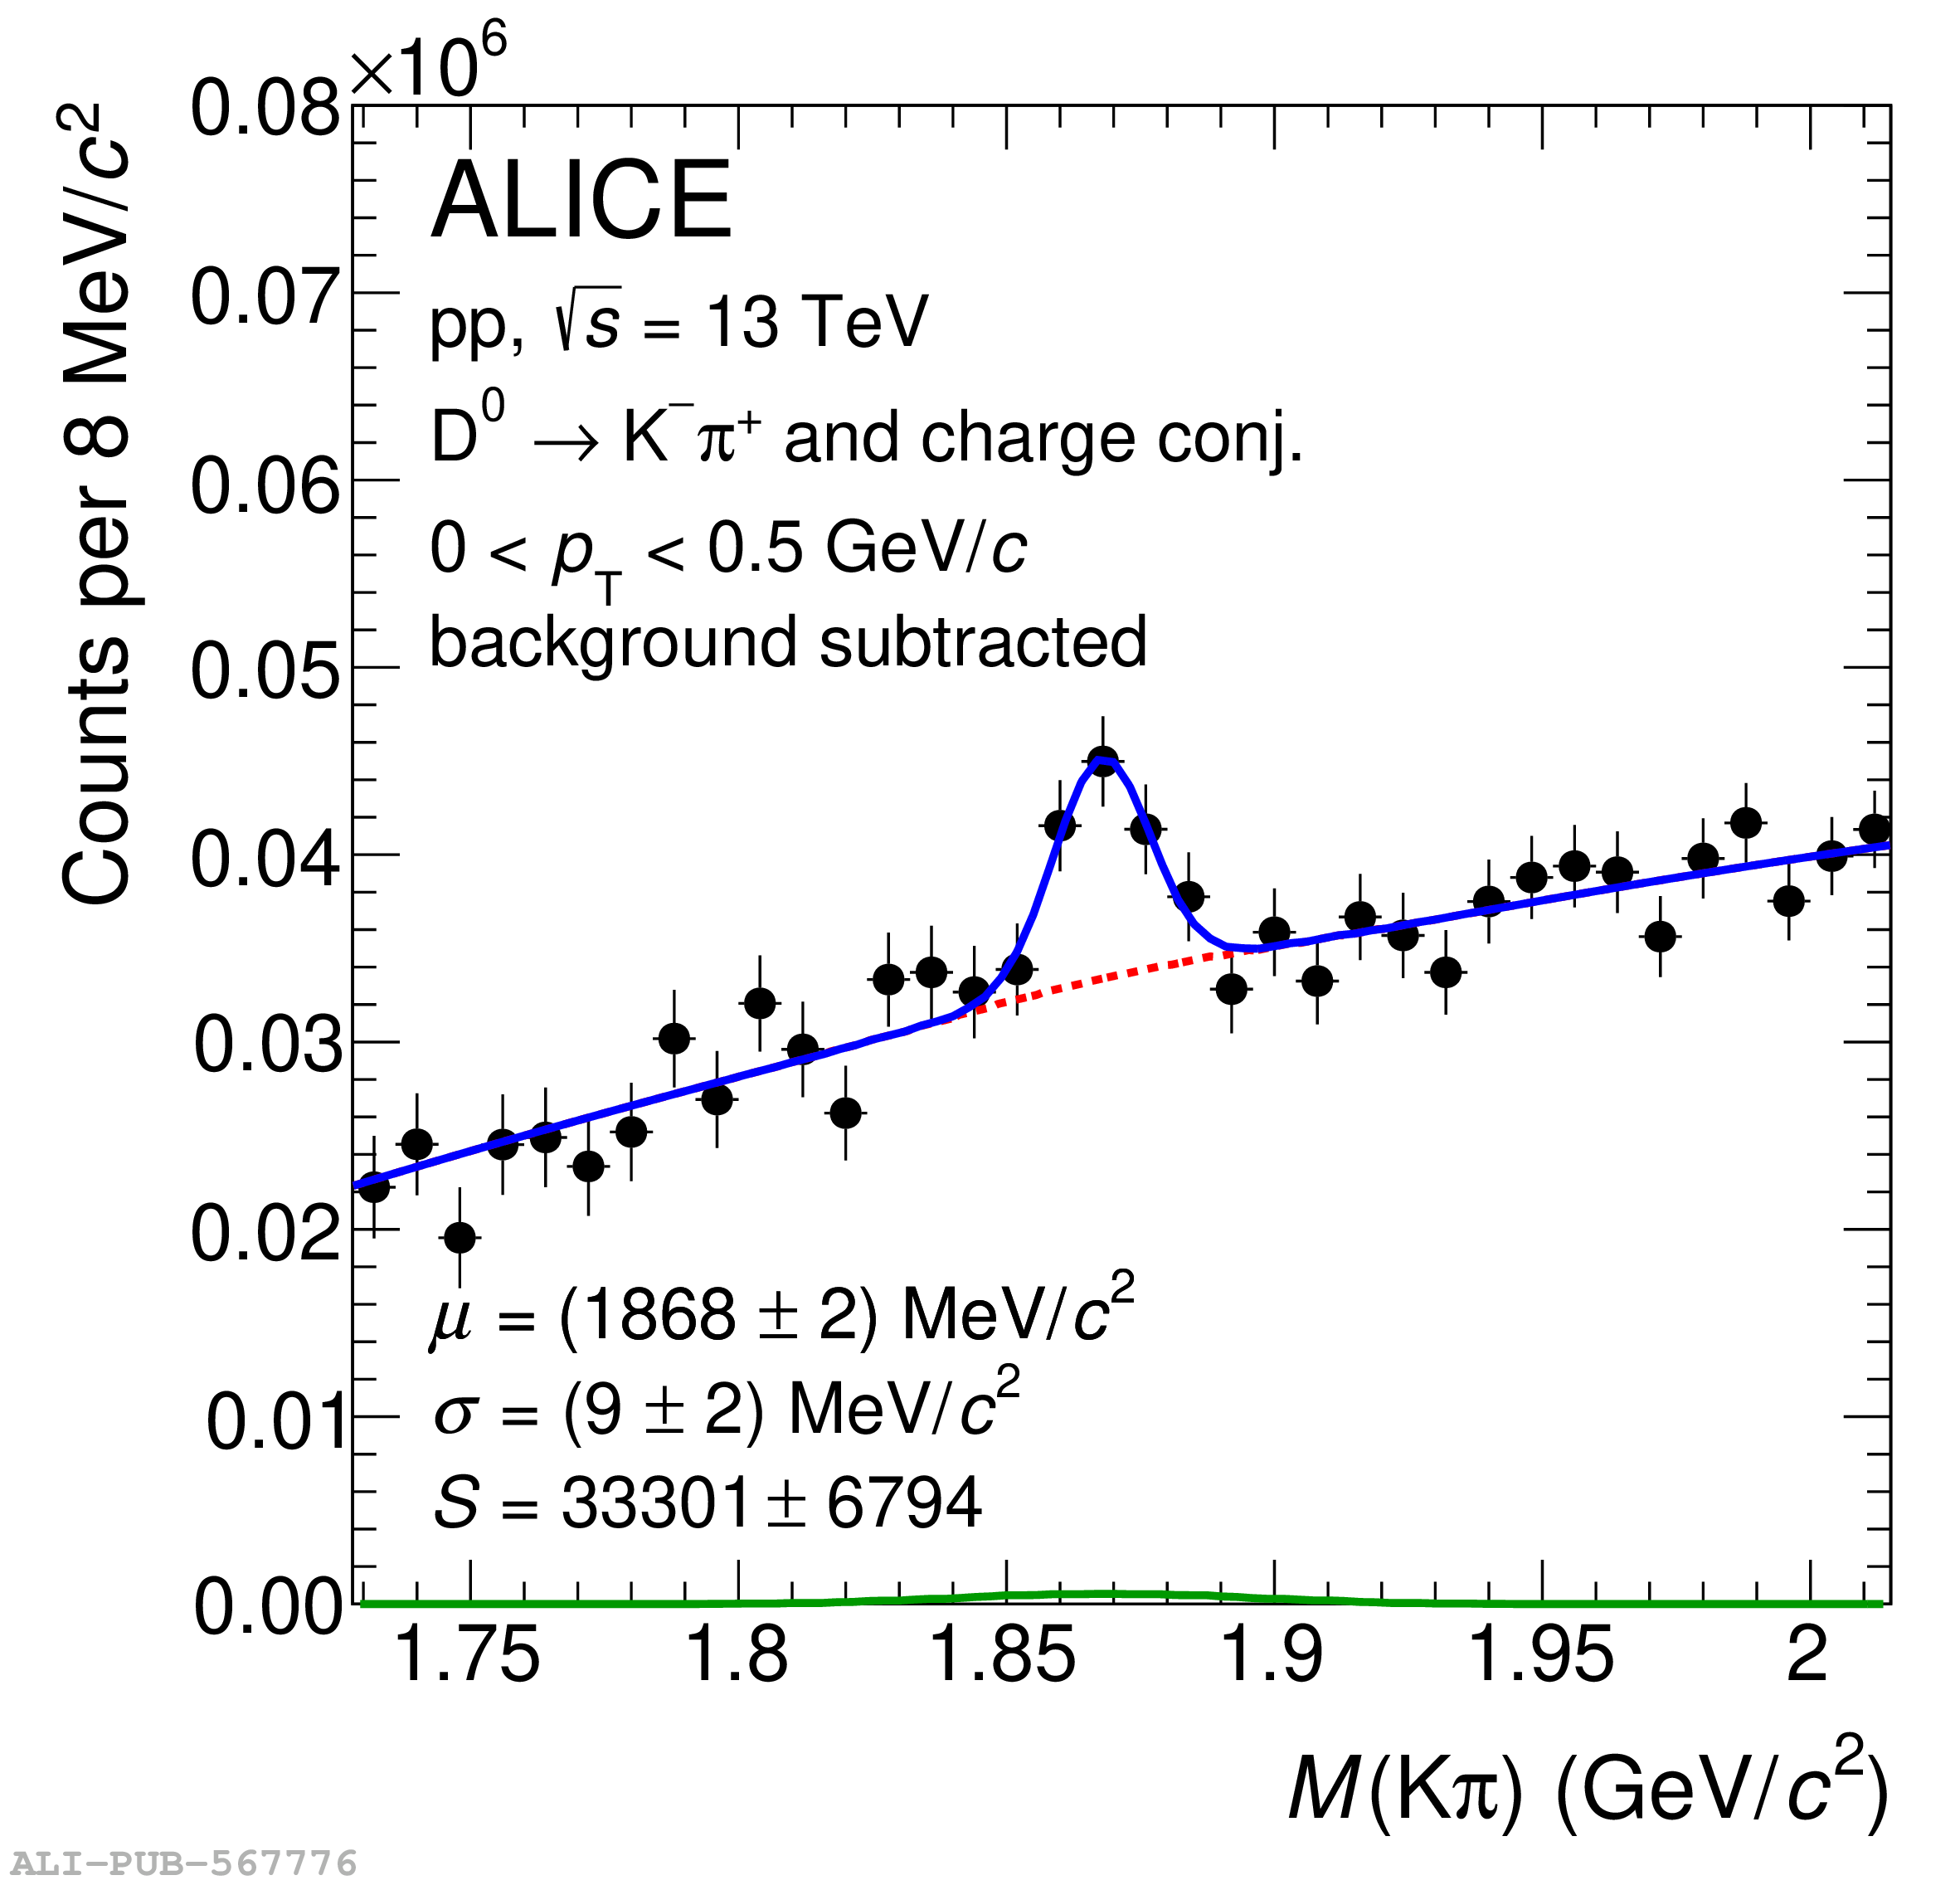 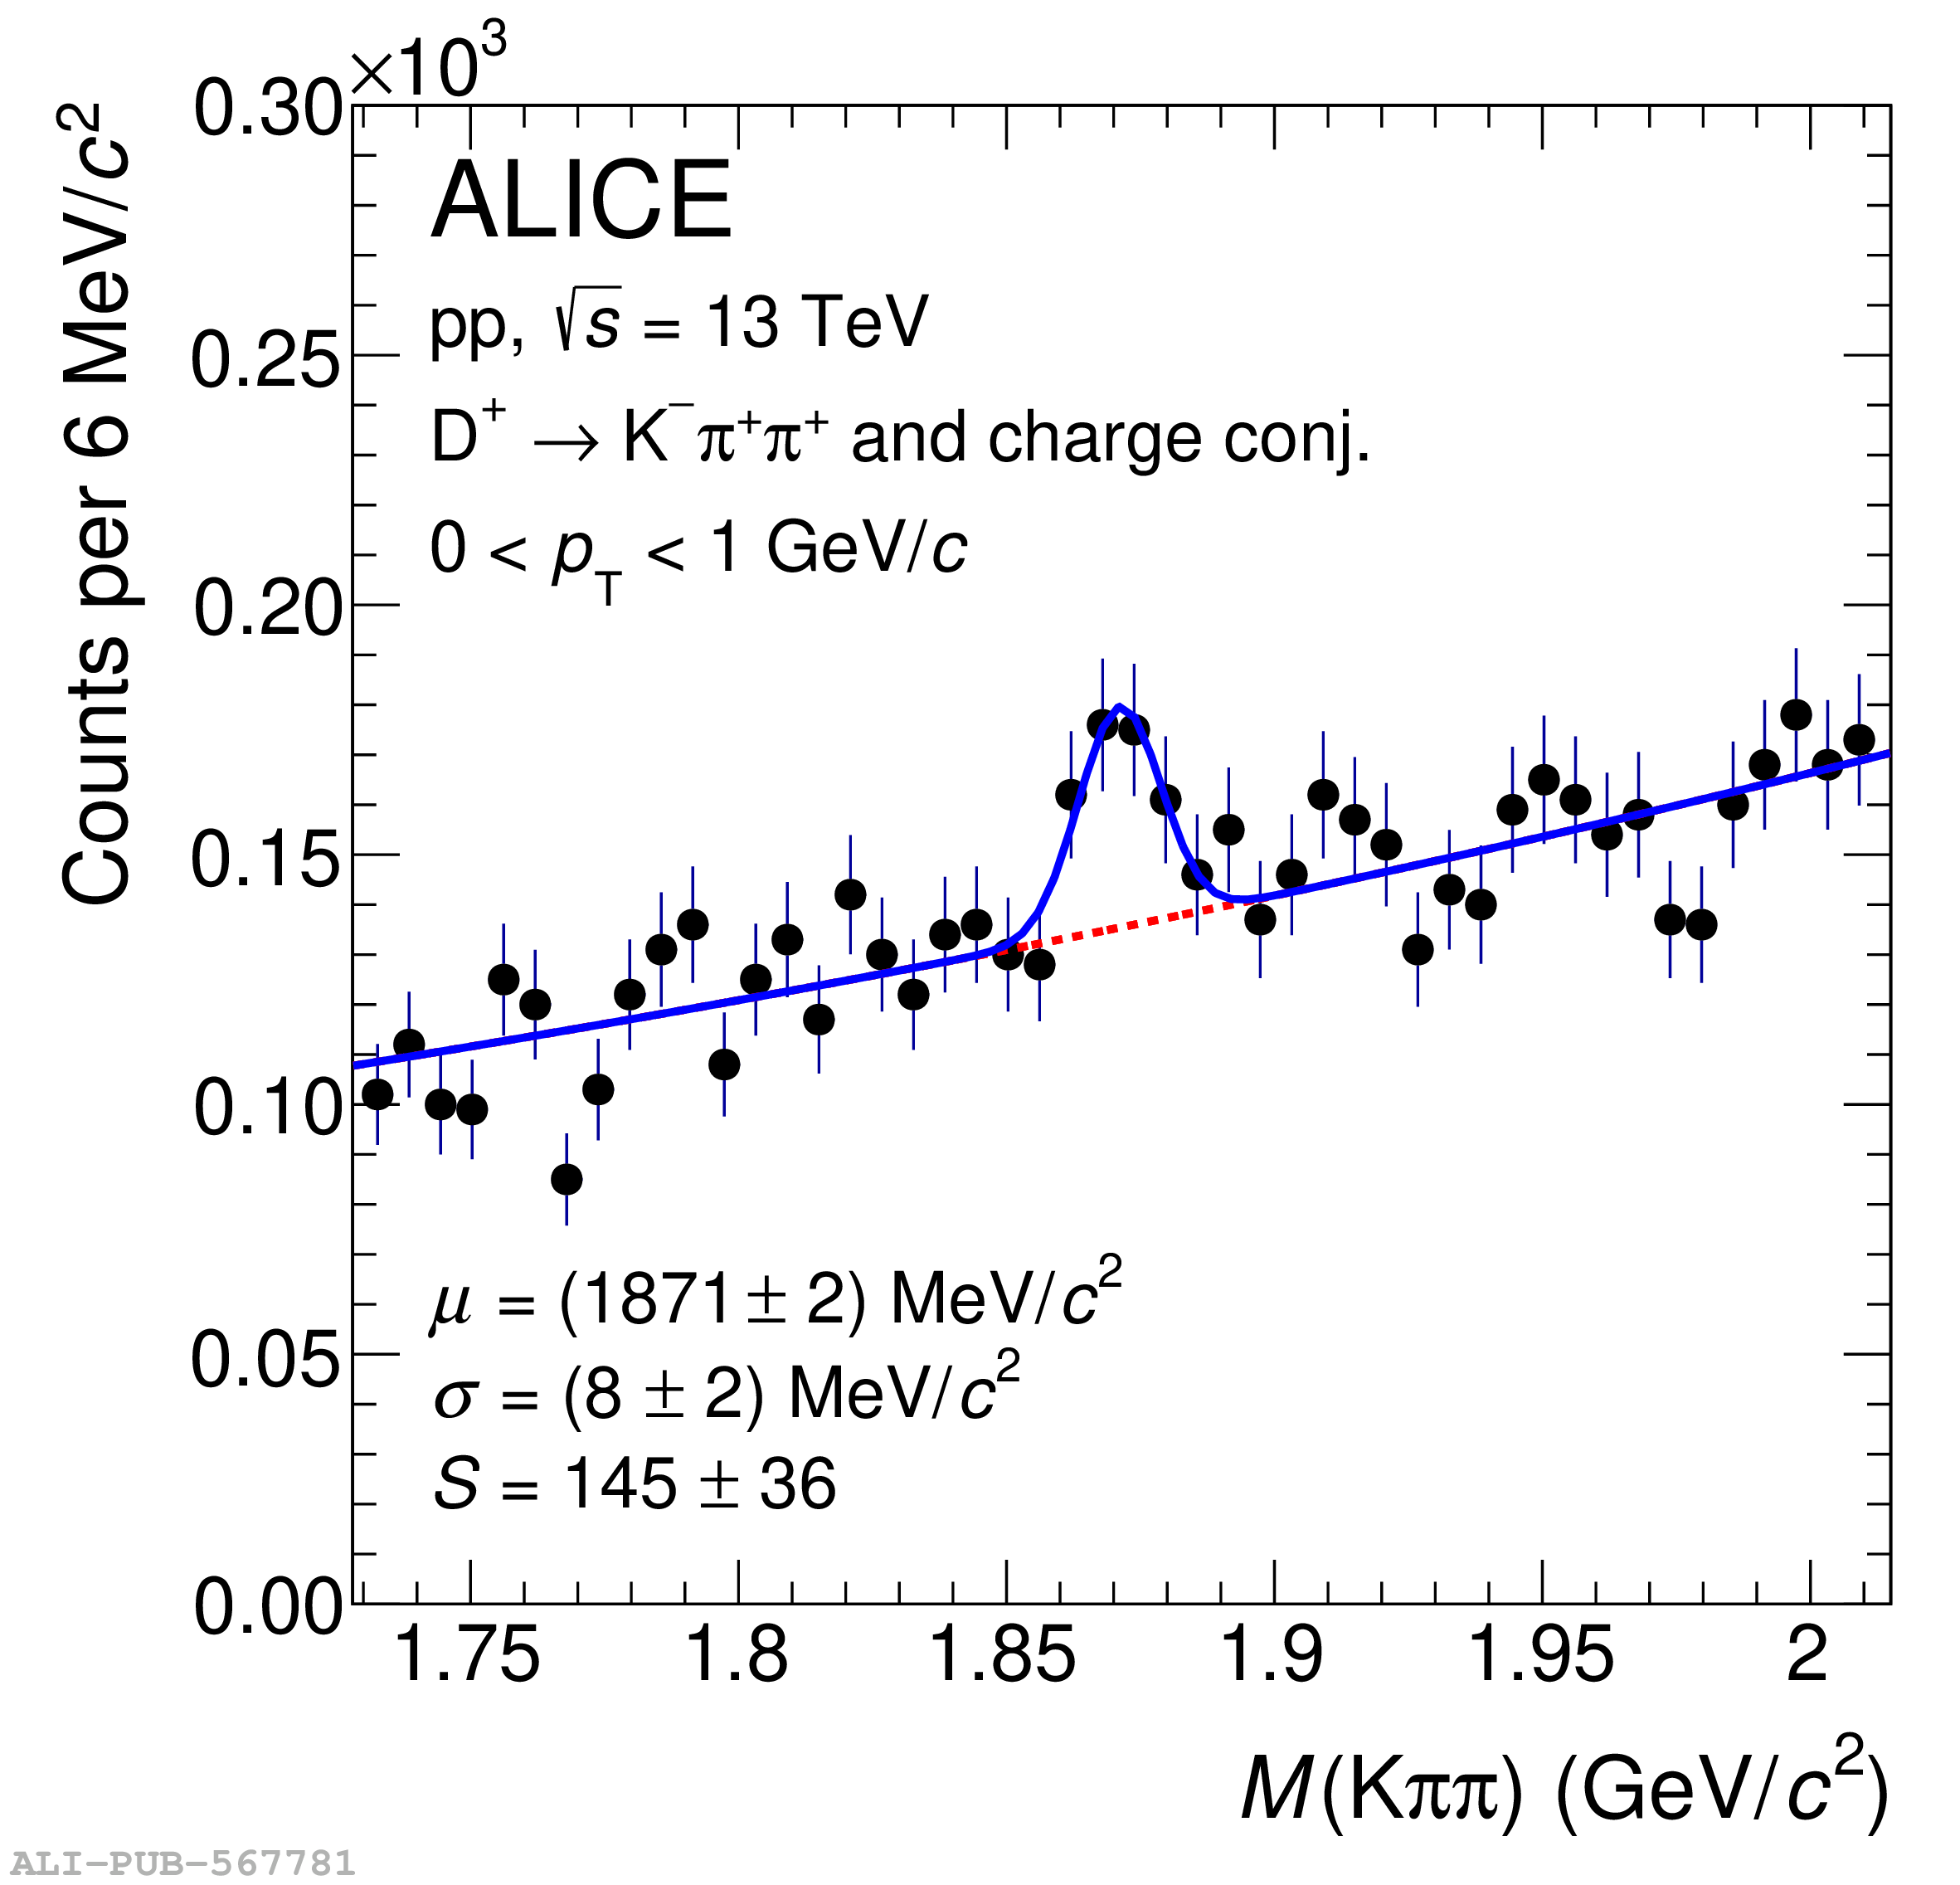 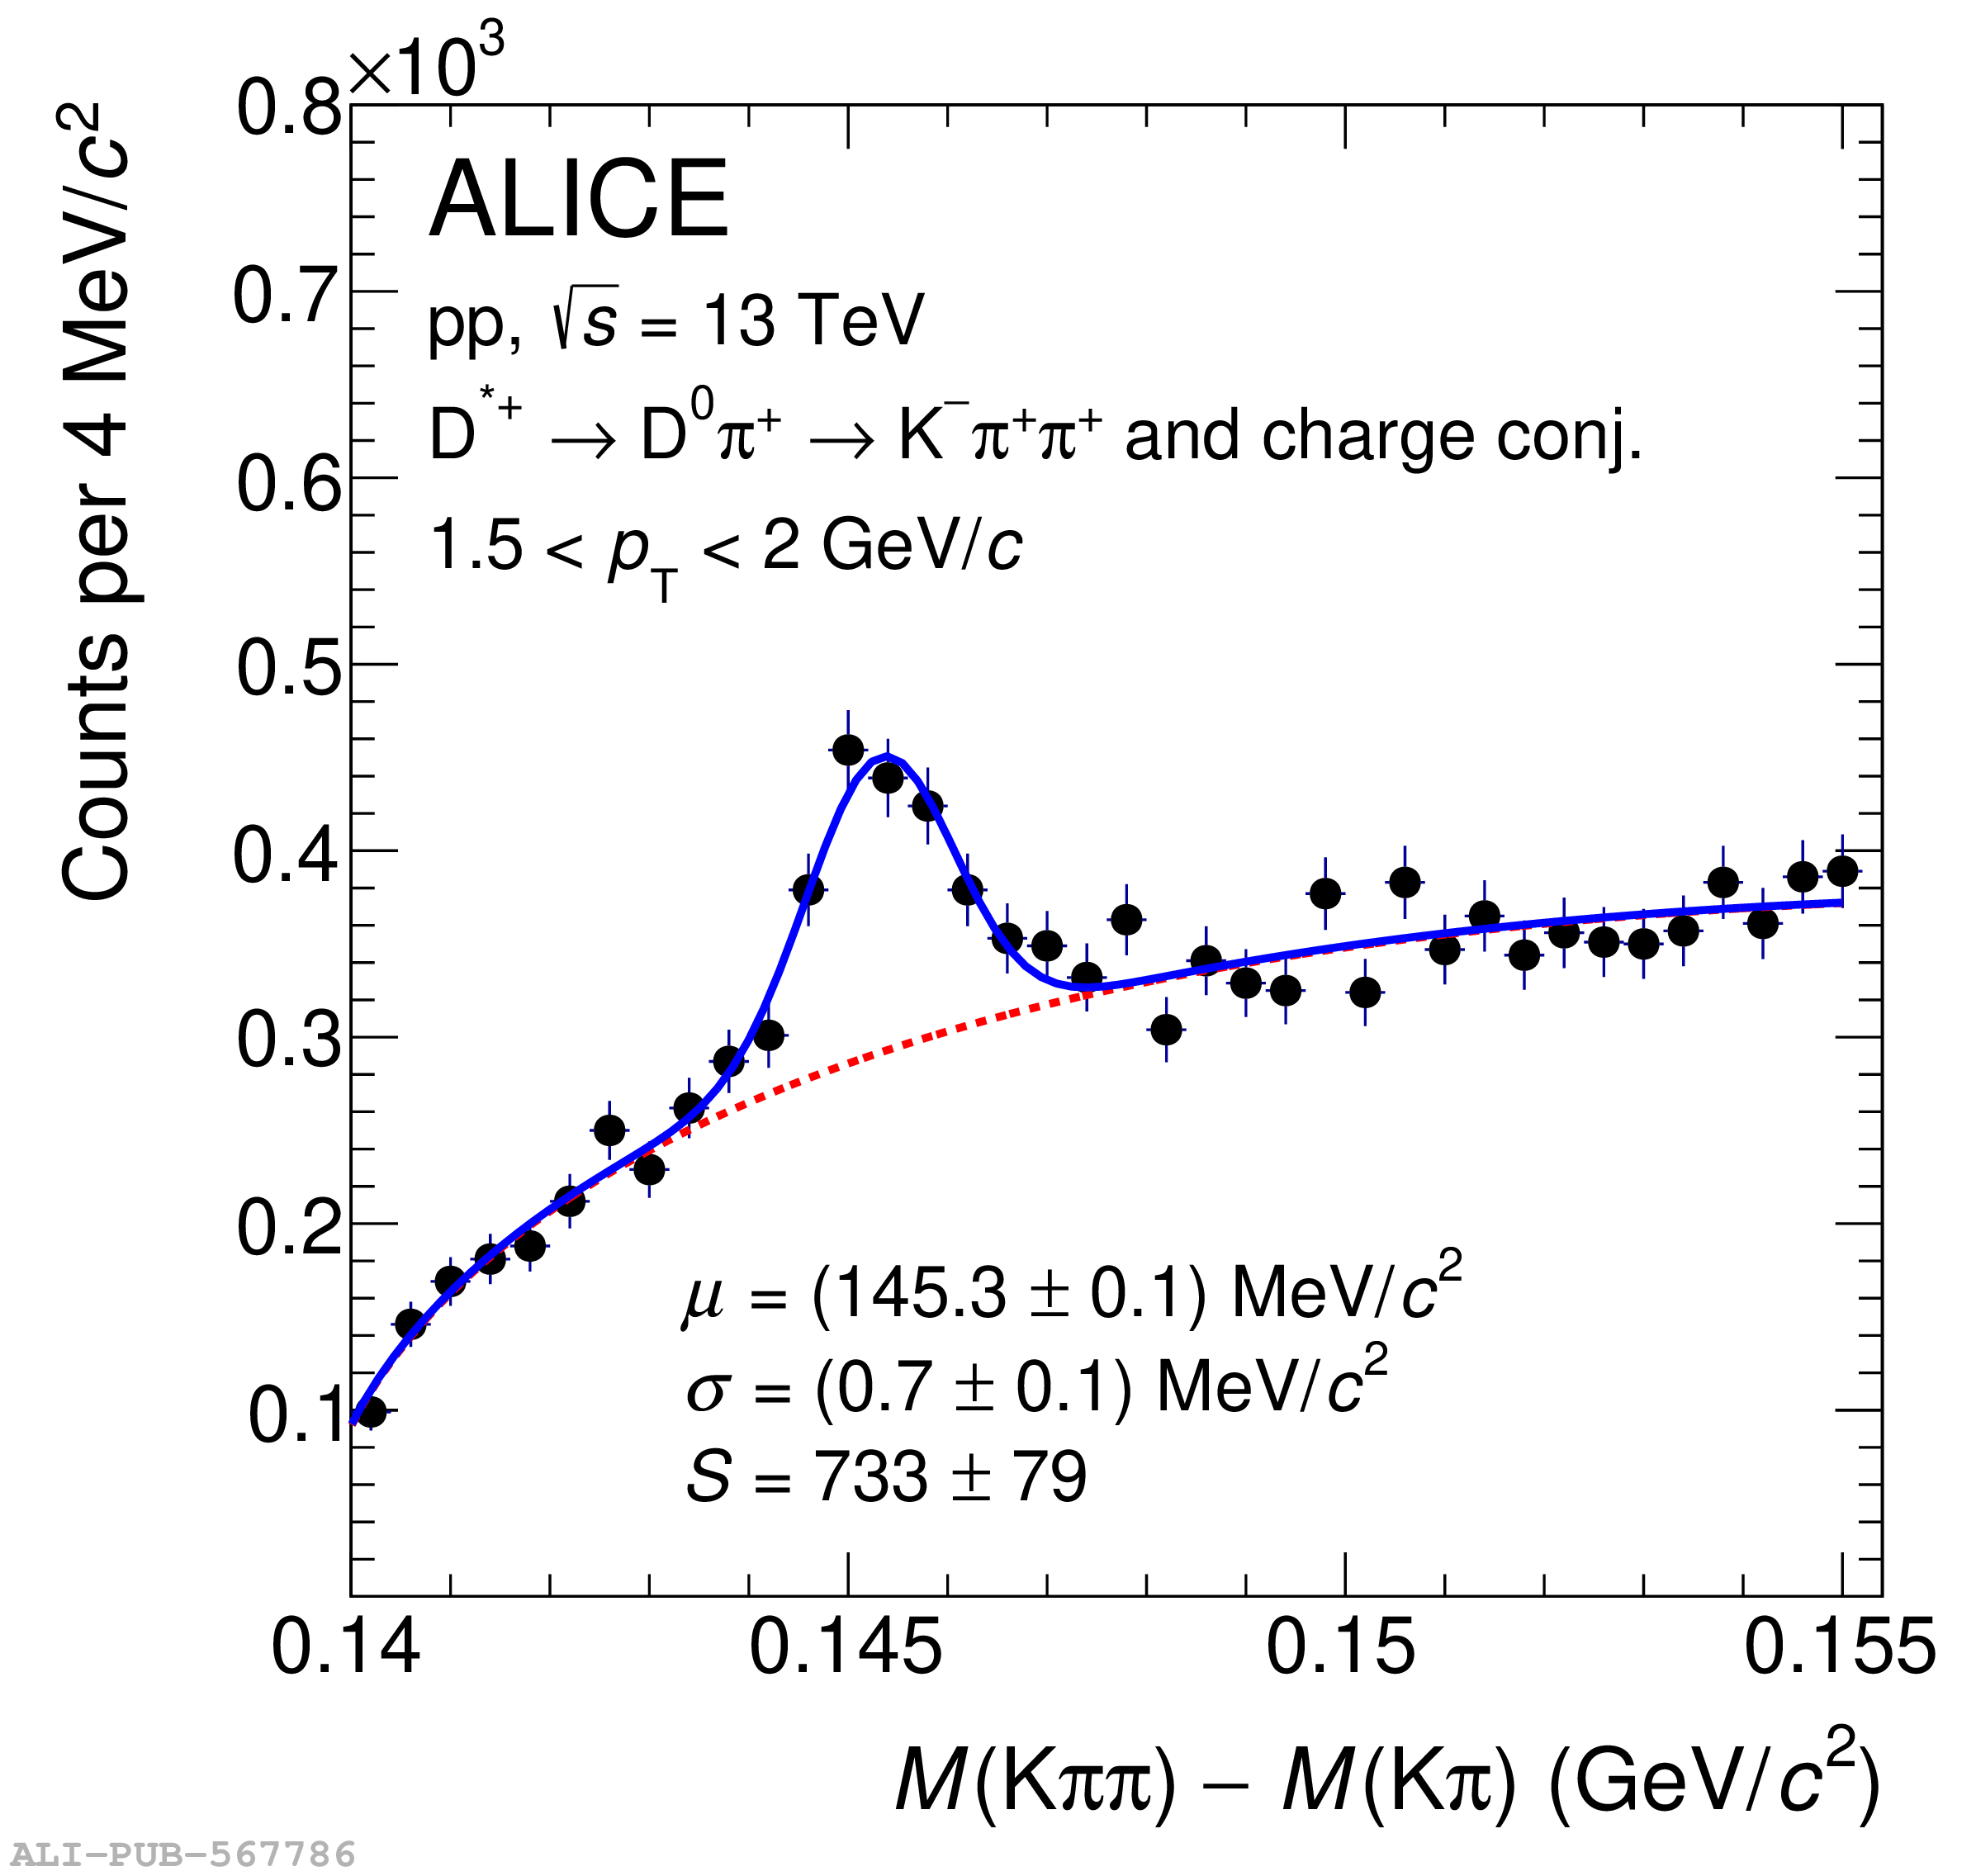 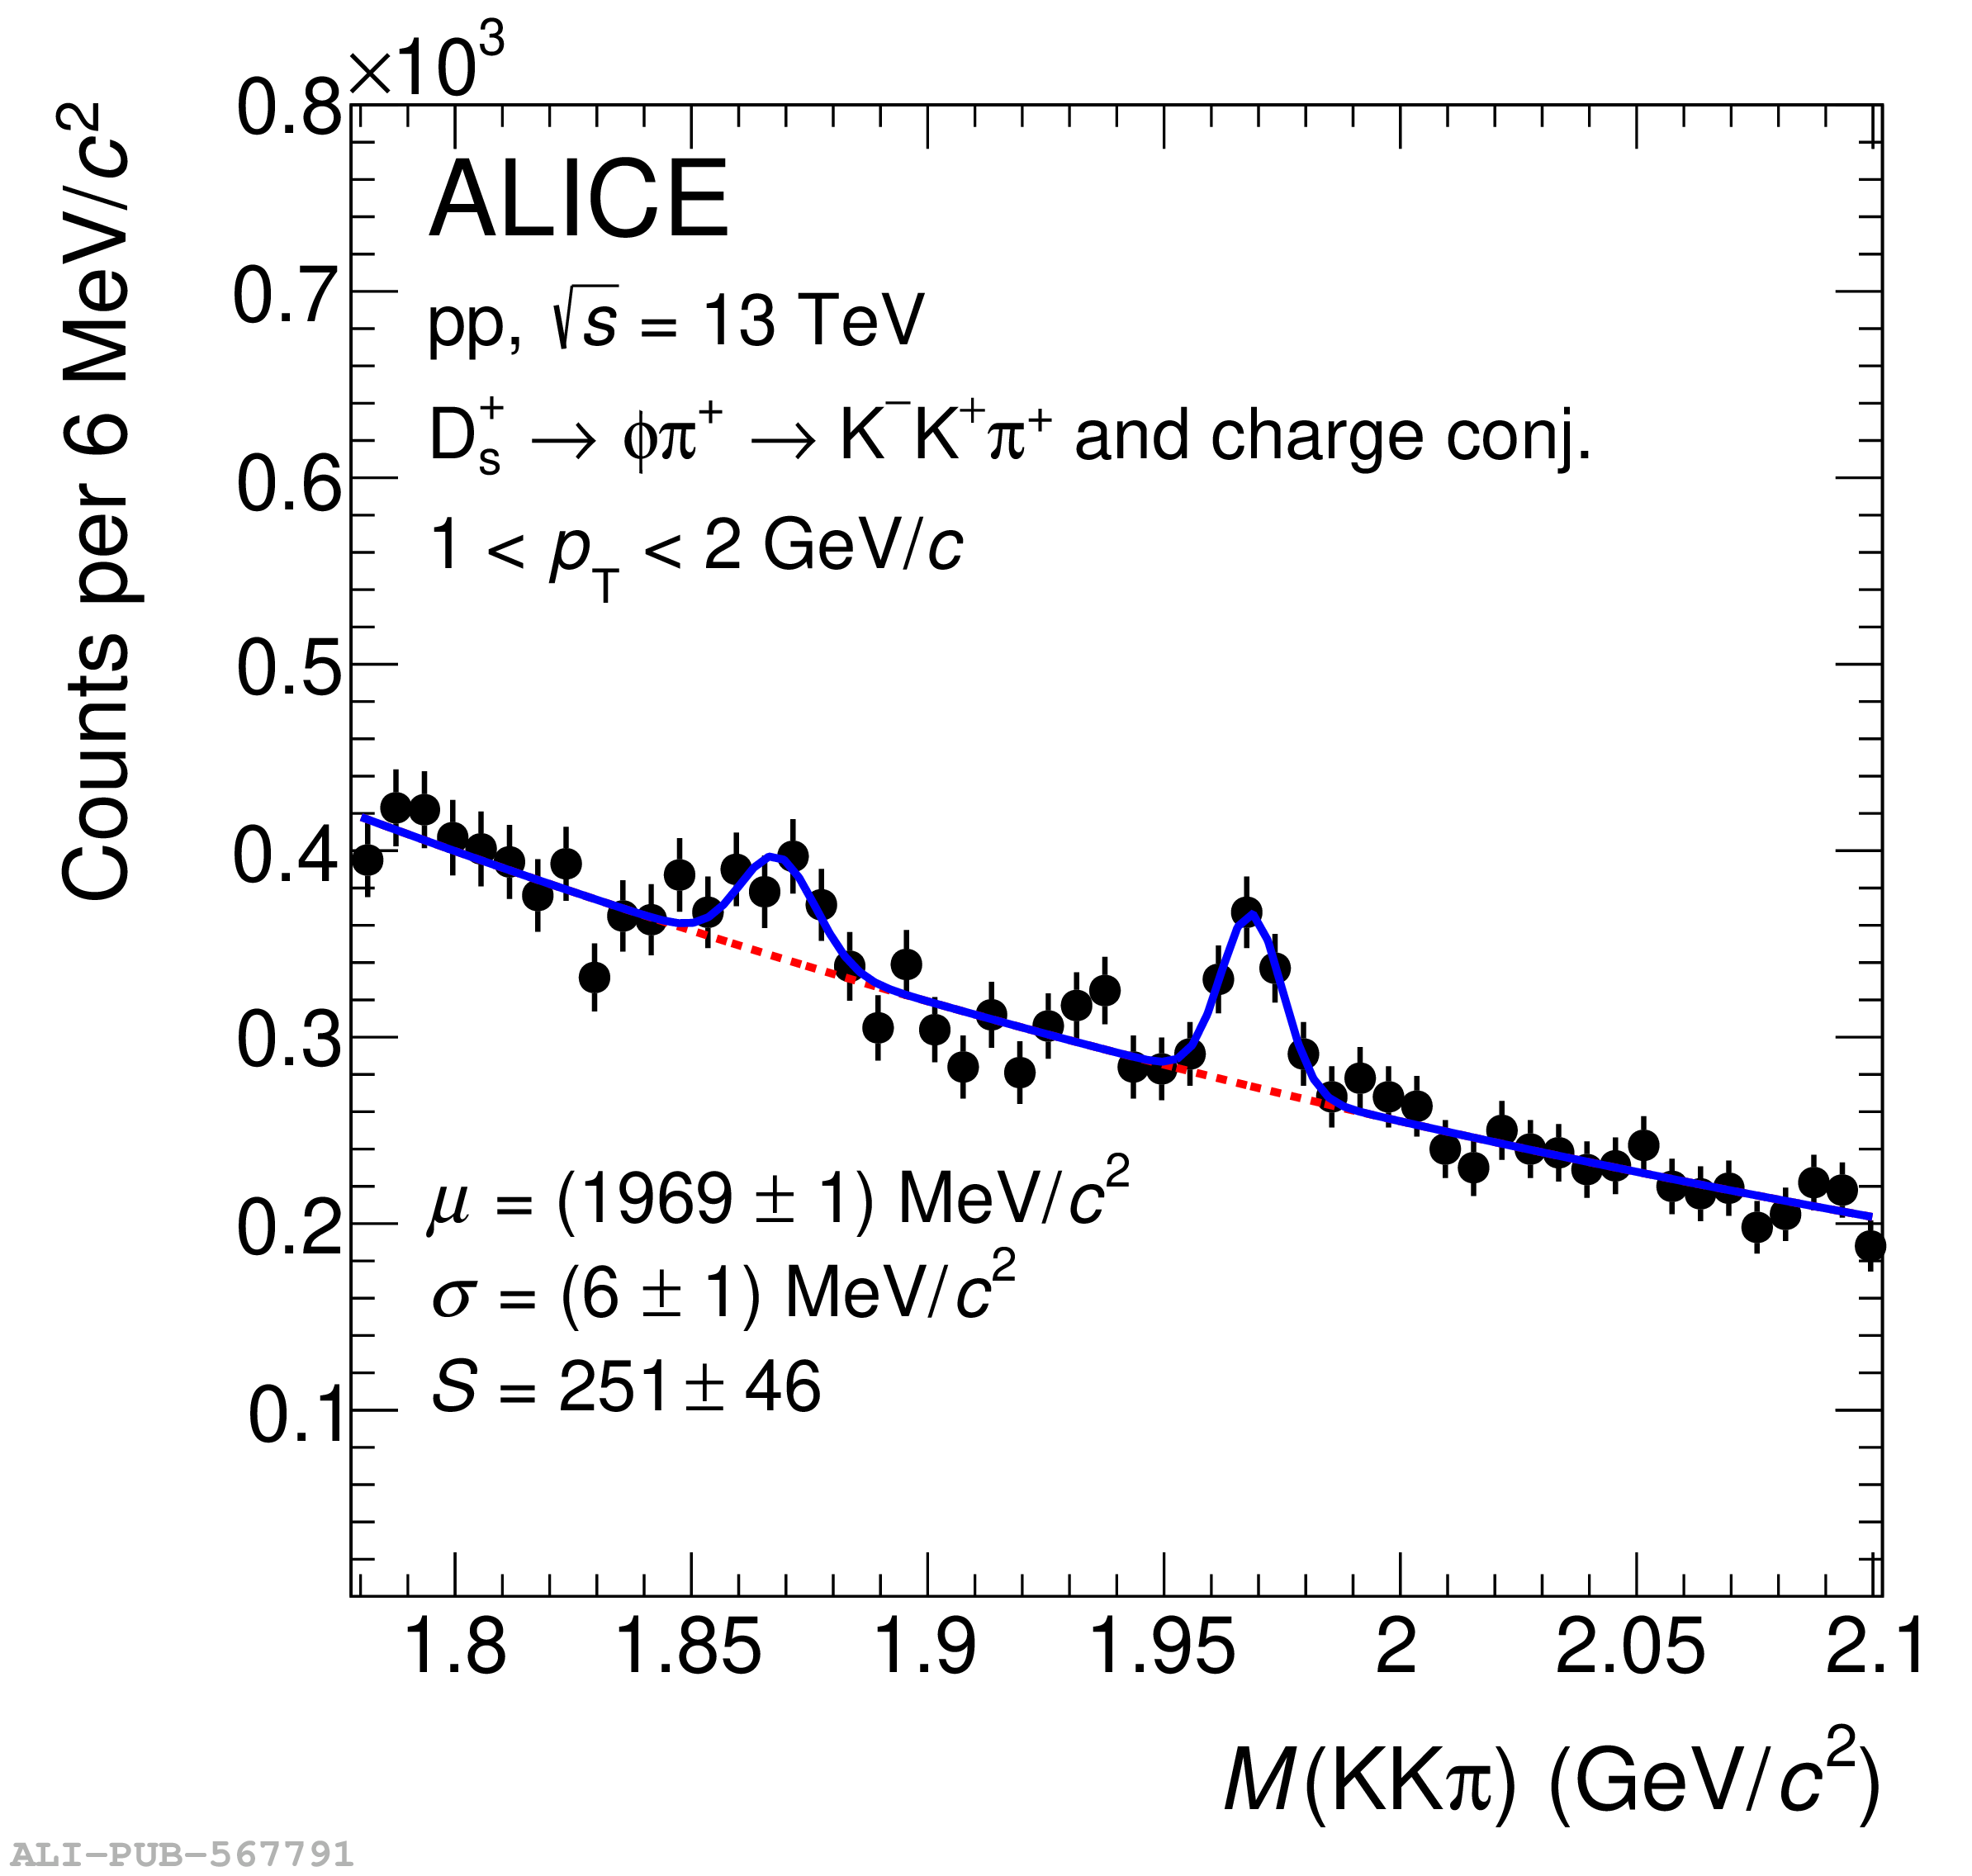 |
Figure 2
Invariant mass distributions of $\Lambda_{\rm c}^+$- and $\Xi_{\rm c}^+$-baryon candidates and charge conjugates at low transverse momentum in \pp collisions at $\s=13$ TeV. The blue solid lines show the total fit functions as described in the text and the red dashed lines represent the background The values of the mean ($\mu$) and the peak width ($\sigma$) of the signal peak are reported together with the signal counts (S). The bottom panels report the charm-baryon invariant mass distribution after the subtraction of the background candidates parametrised as detailed in the main text ($S-B$). The Gaussian $\sigma$ are fixed to values from MC simulations. The reported uncertainties are only the statistical uncertainties from the fit. | 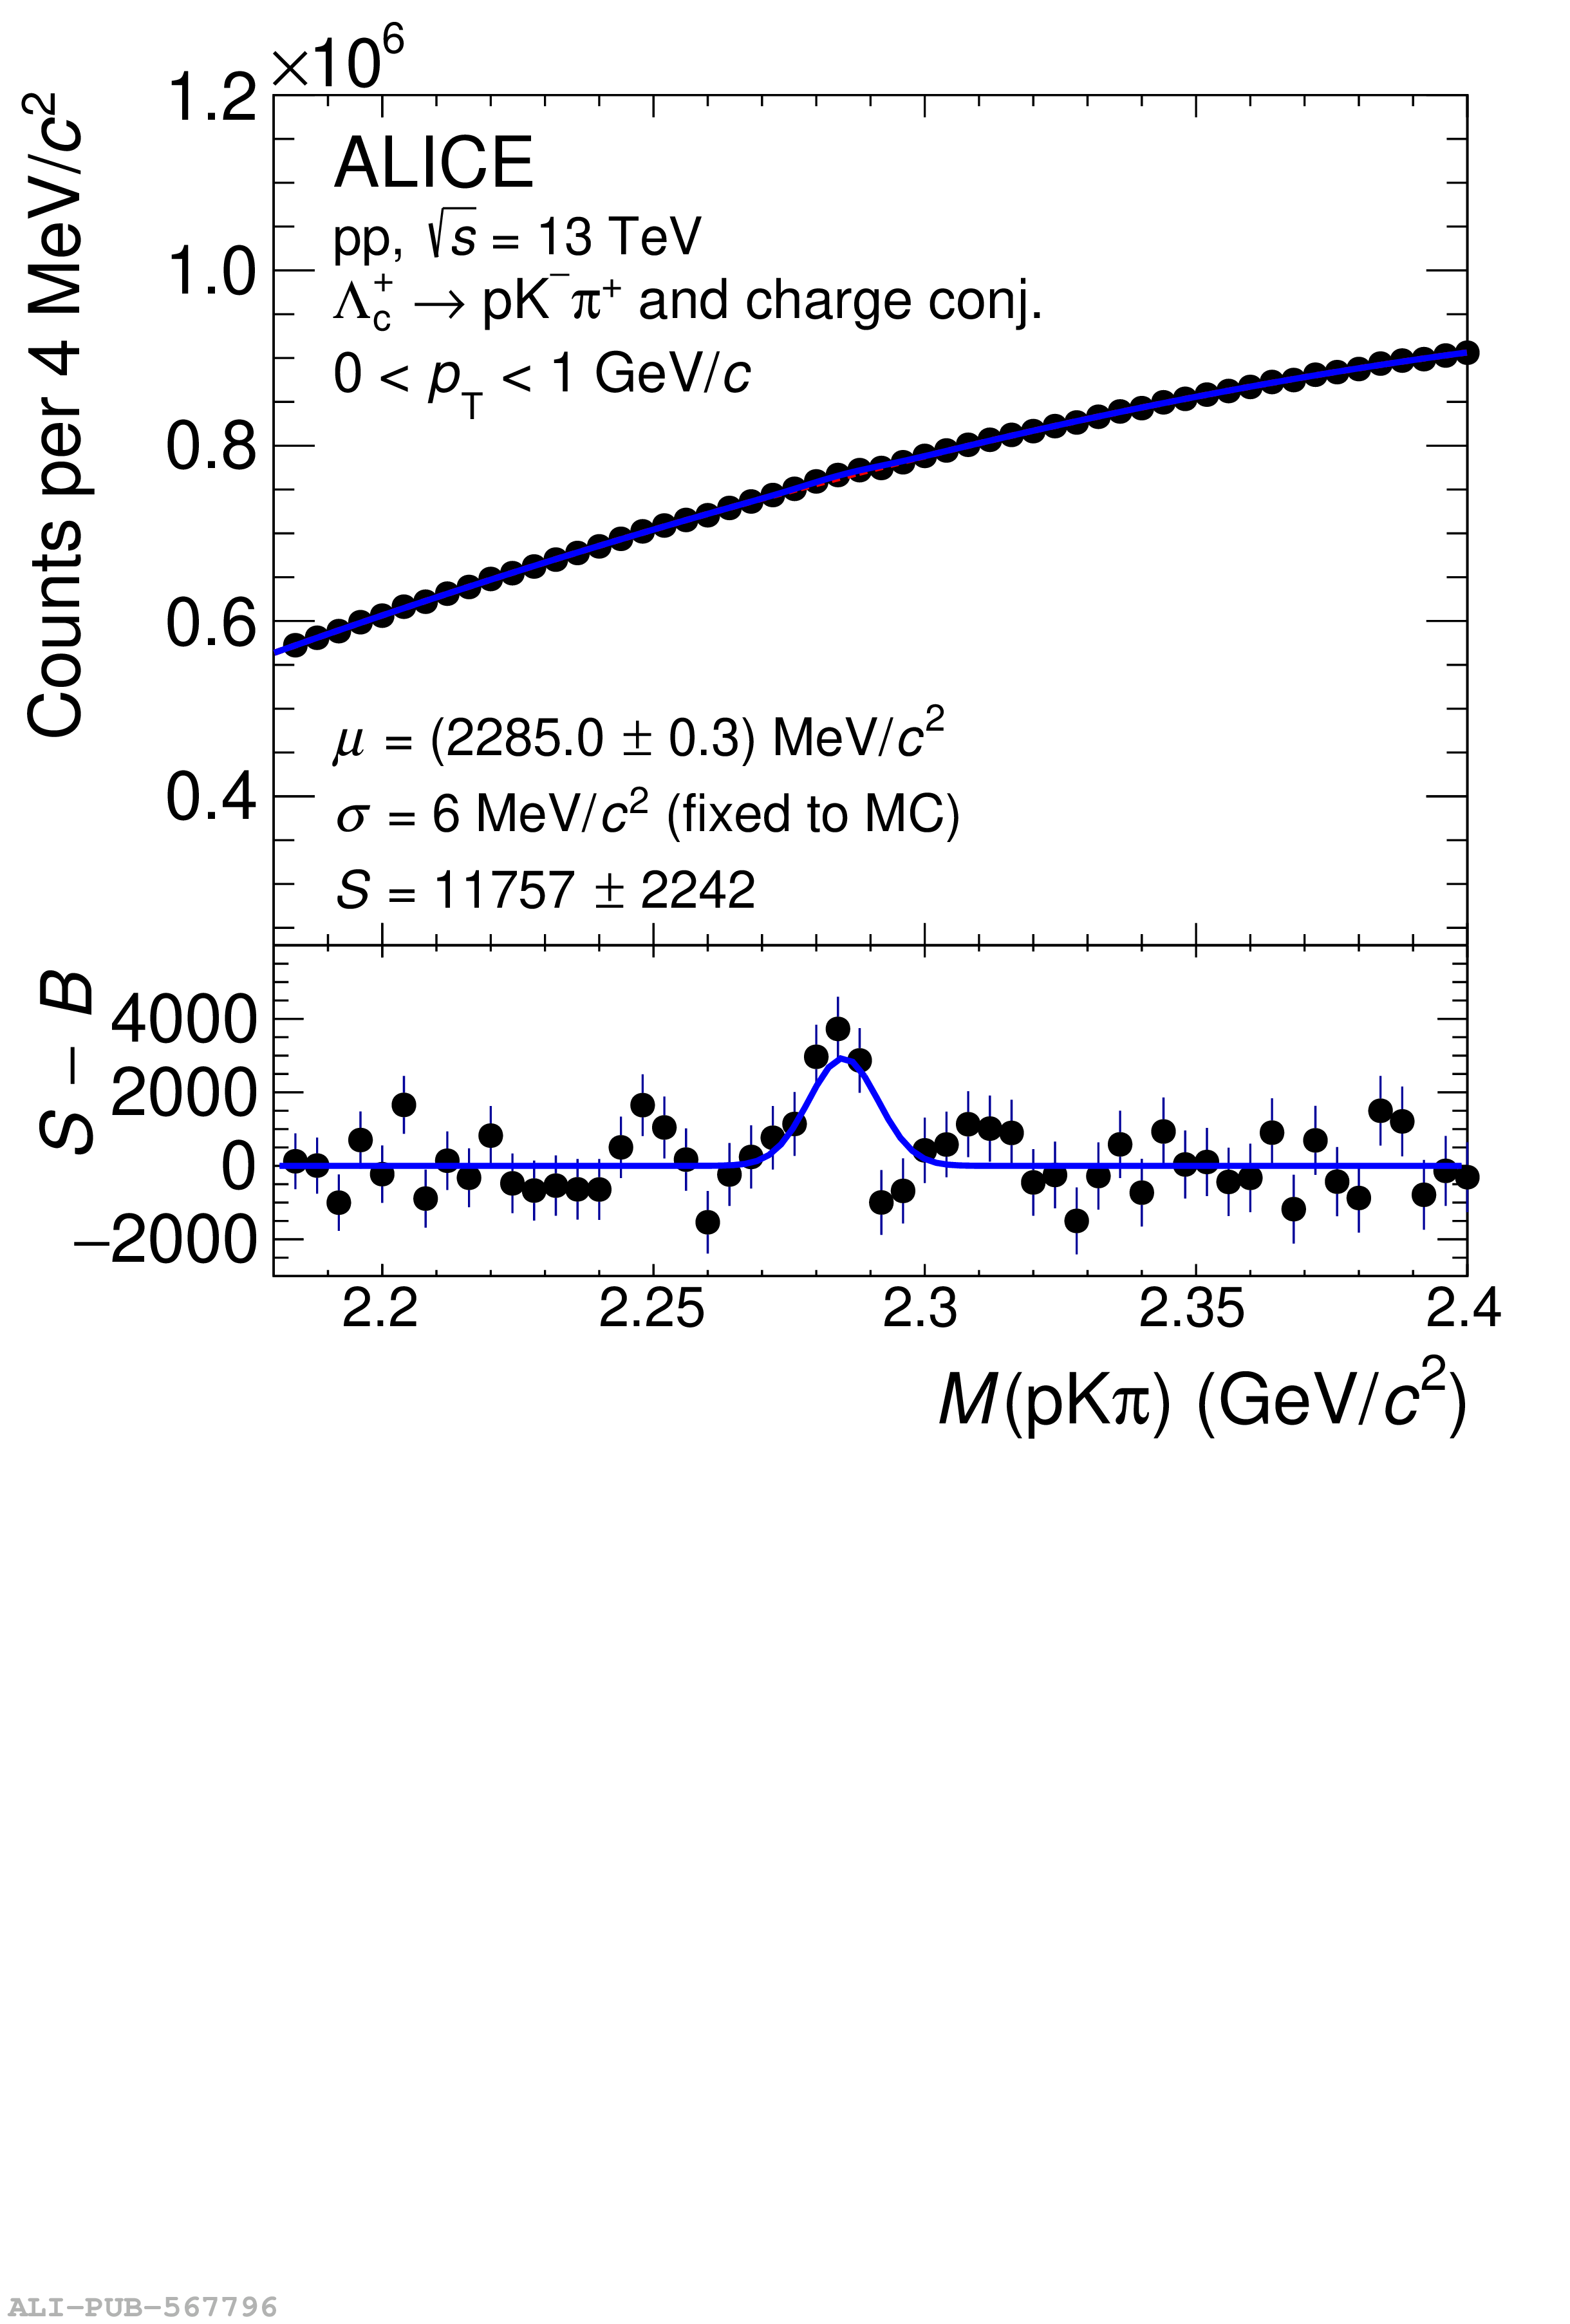 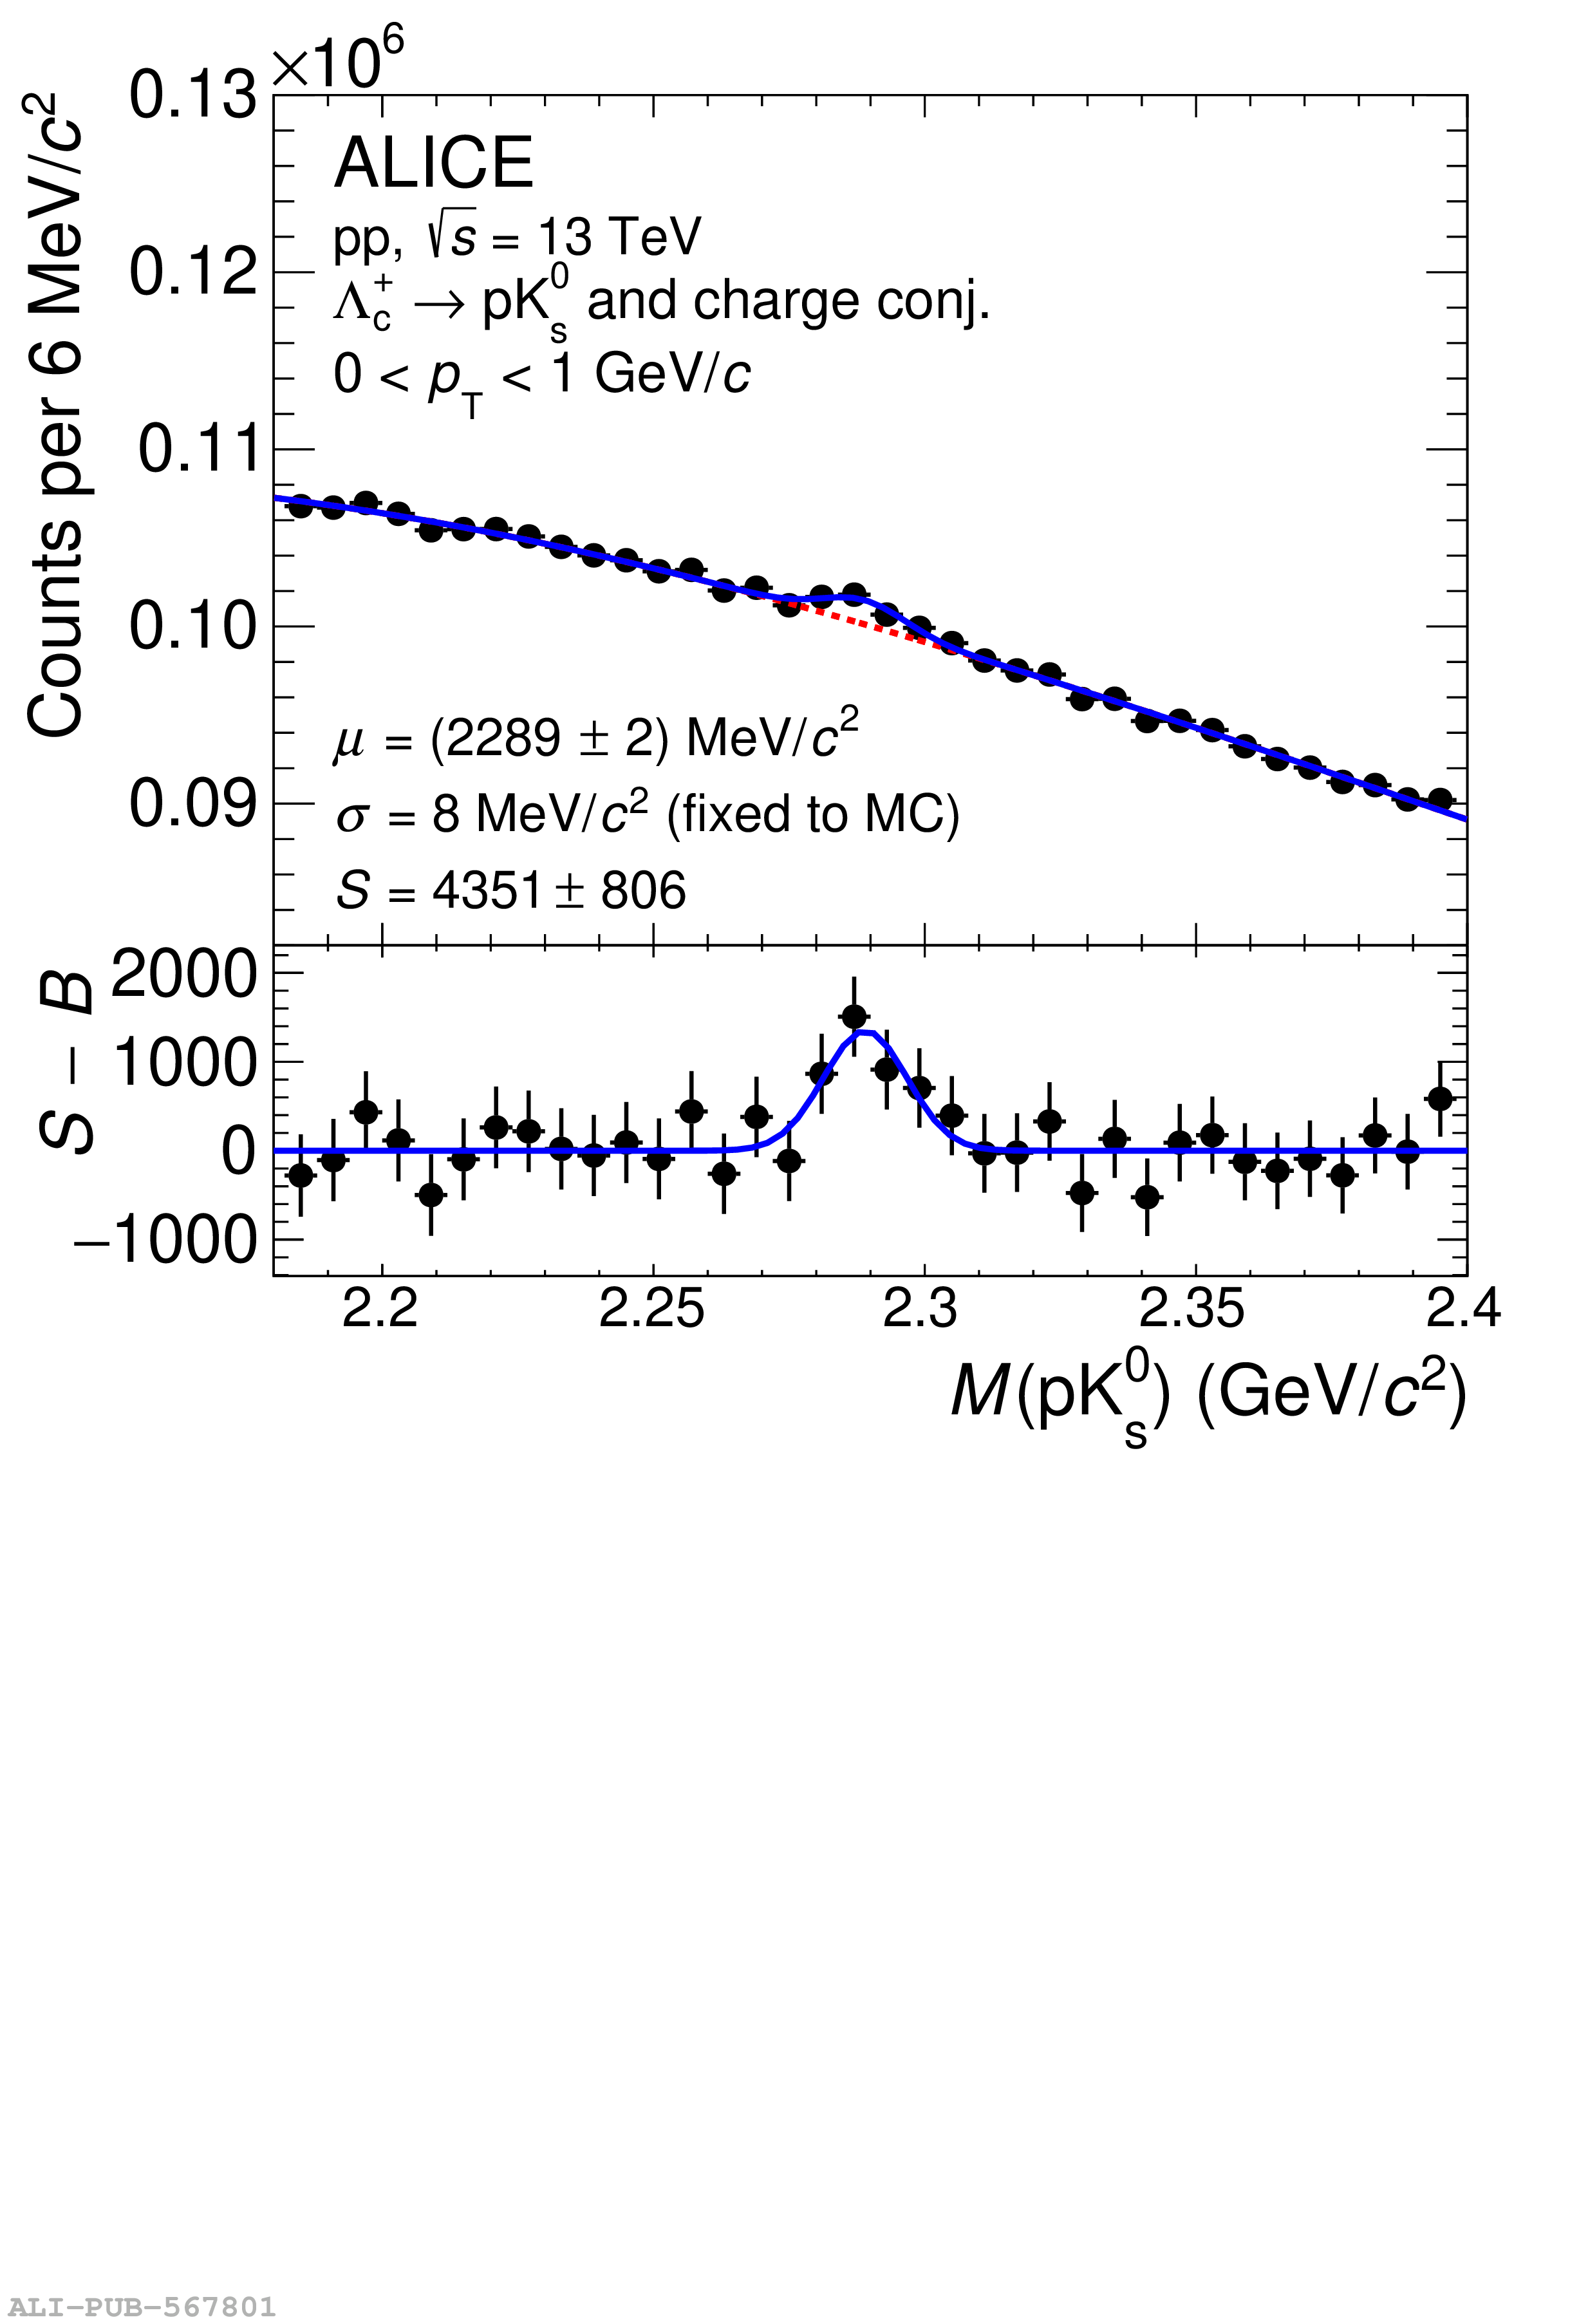 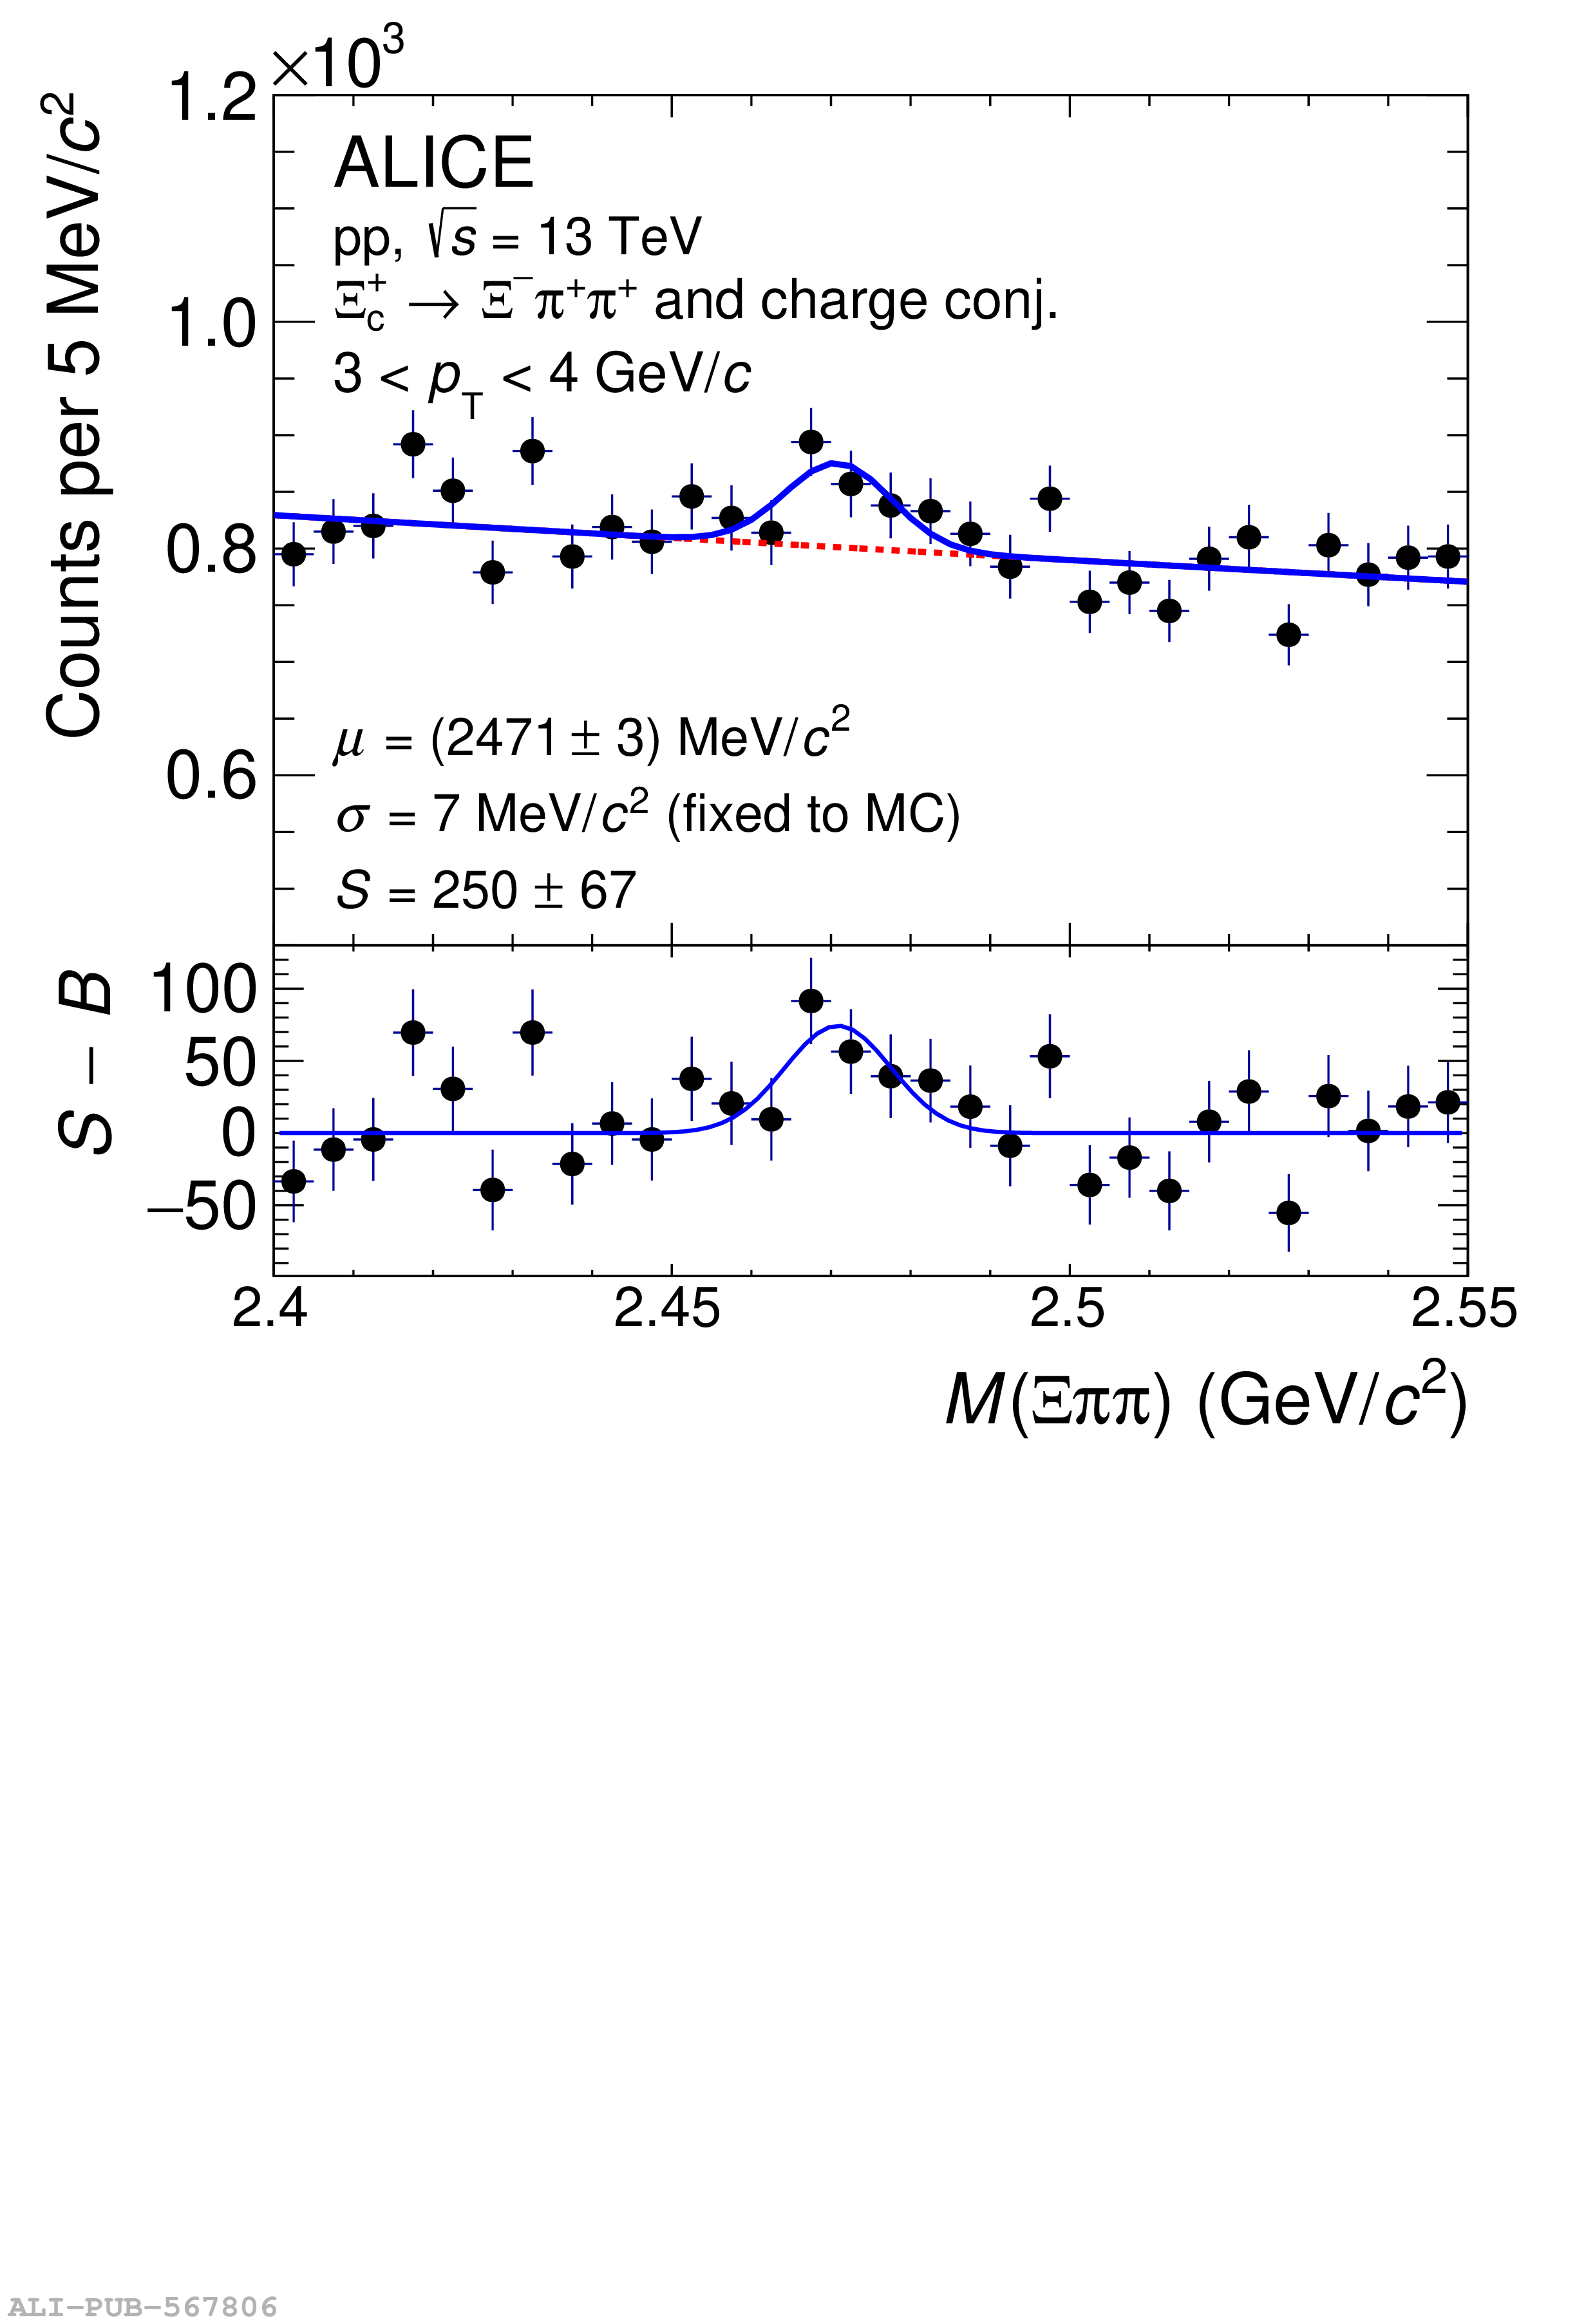 |
Figure 3
Correction factors $c_{\Delta y}({\rm Acc}\times \varepsilon)$ for the prompt and non-prompt $\Dzero$-meson (top-left), the $\Dplus$-meson (top-right), the $\Dstar$-meson (bottom-left), and the $\Ds$-meson (bottom-right) as a function of $\pt$. | 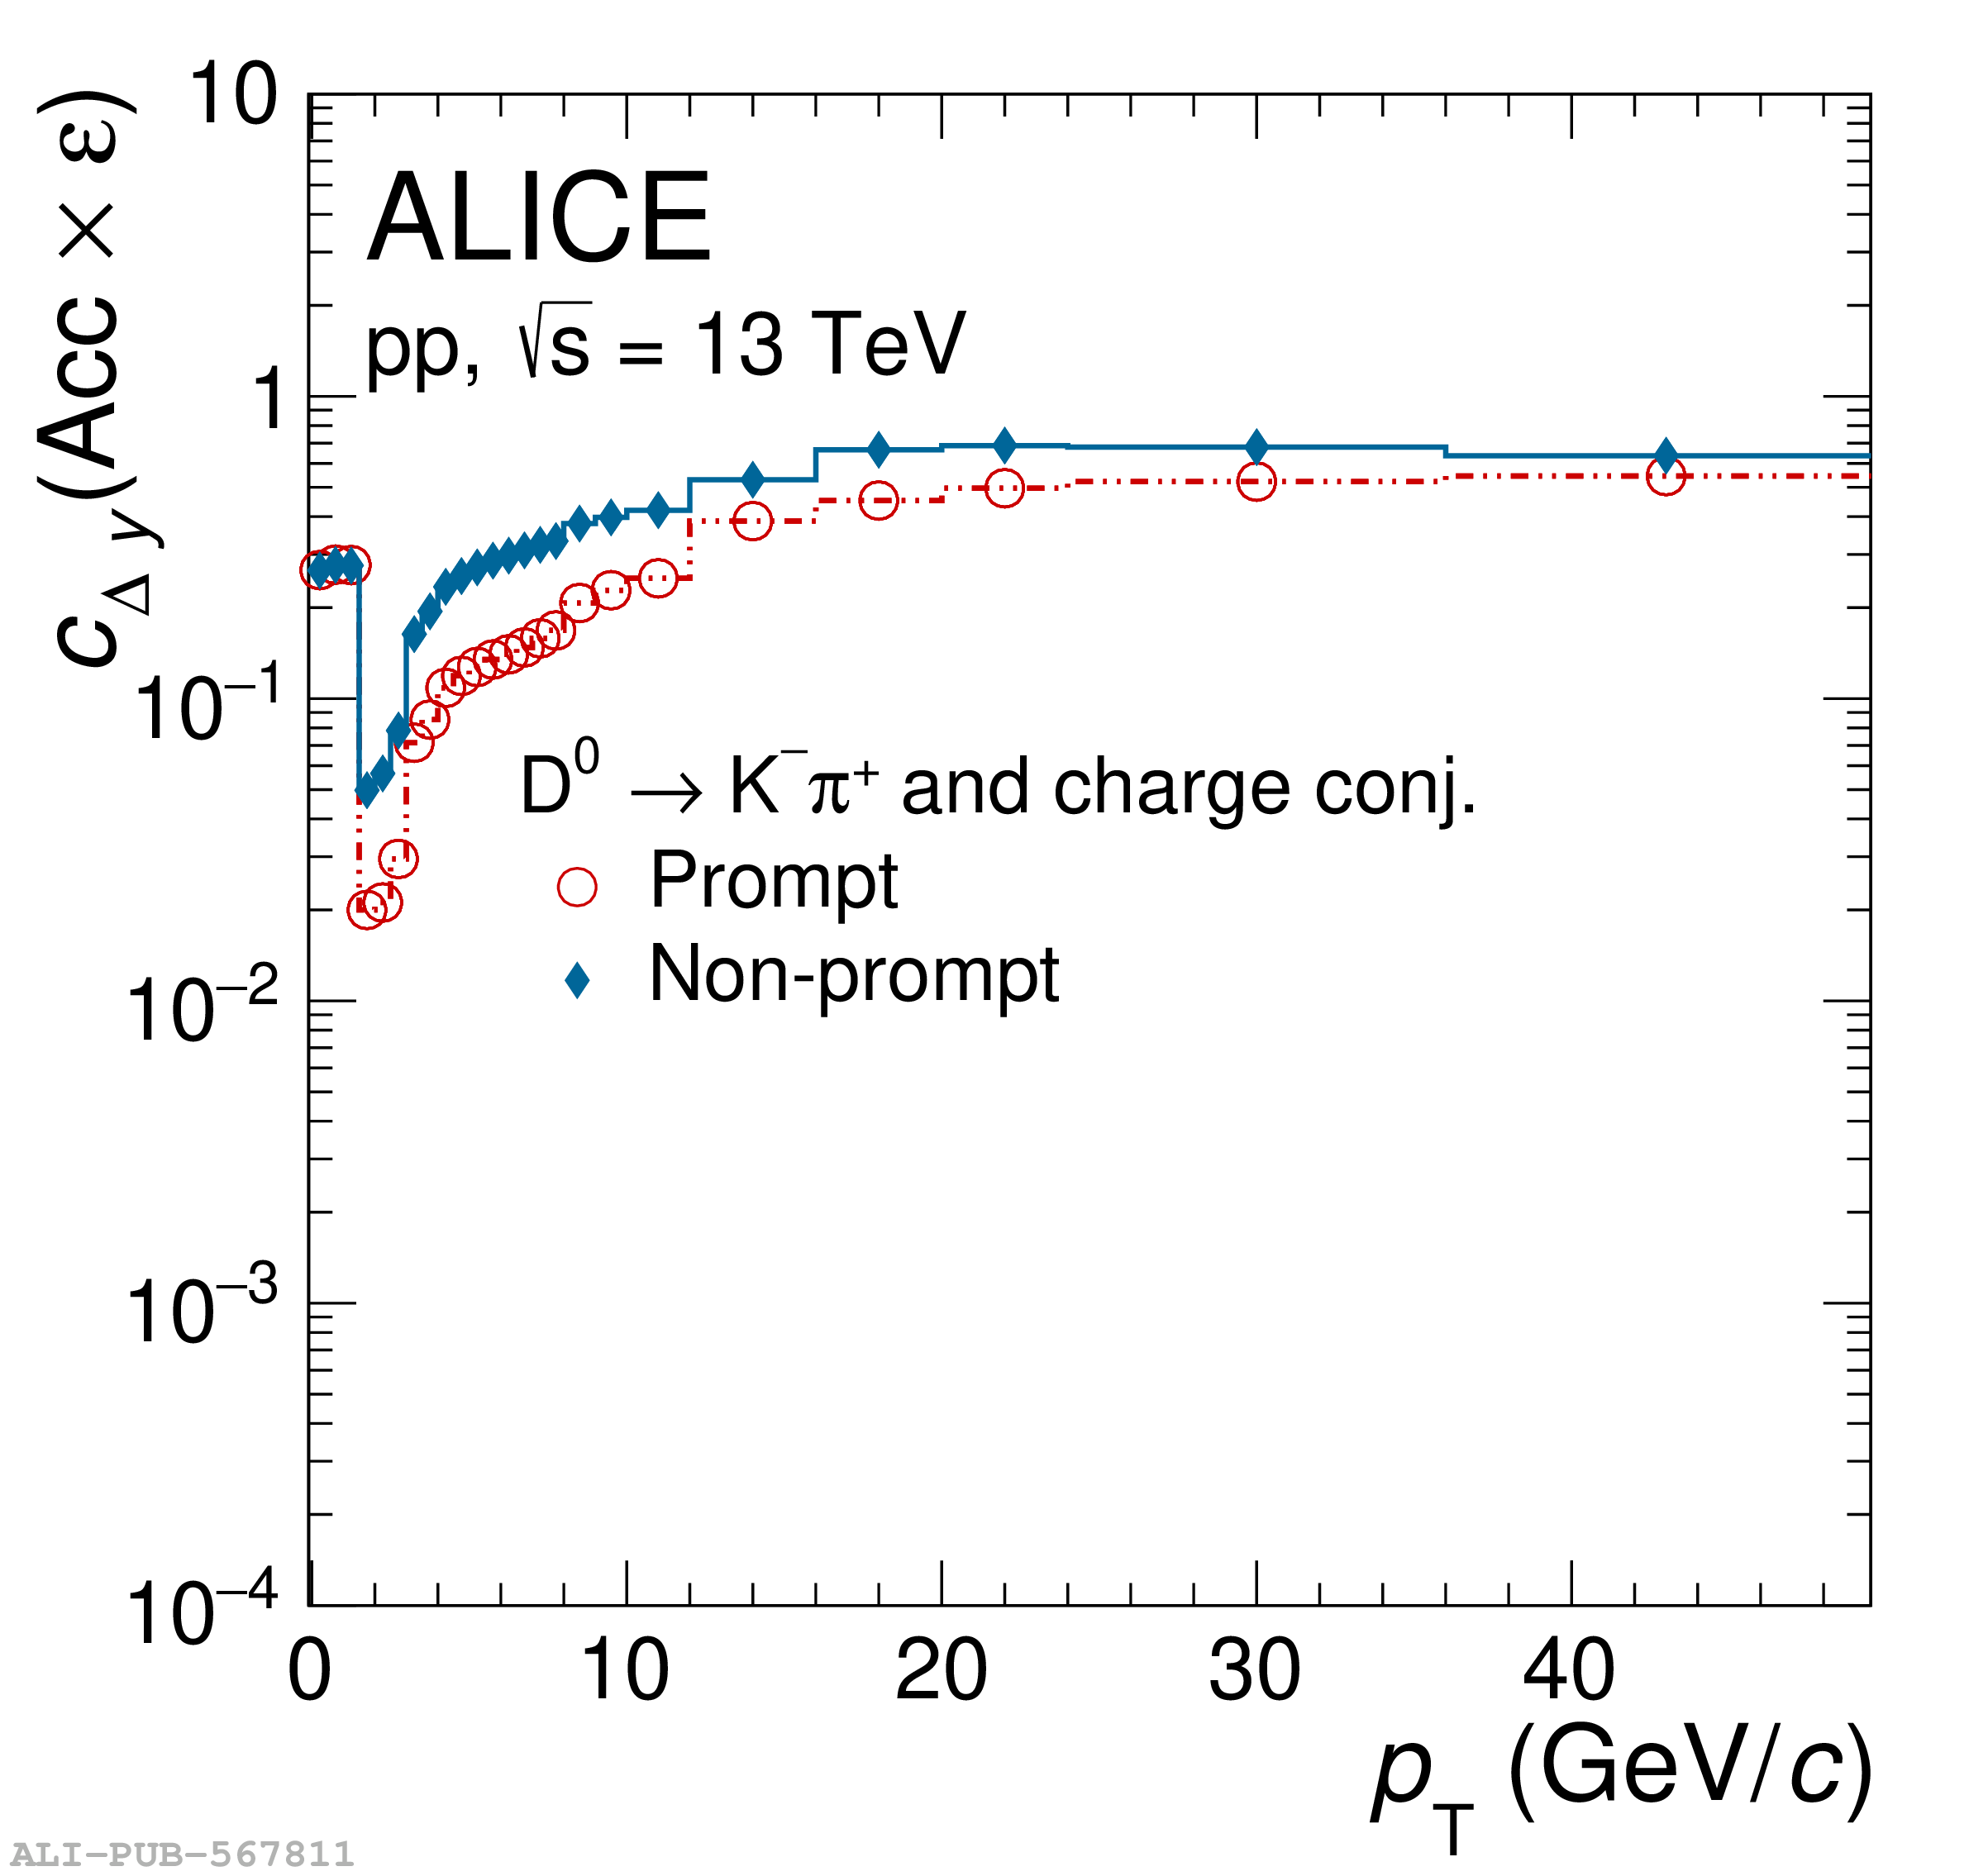 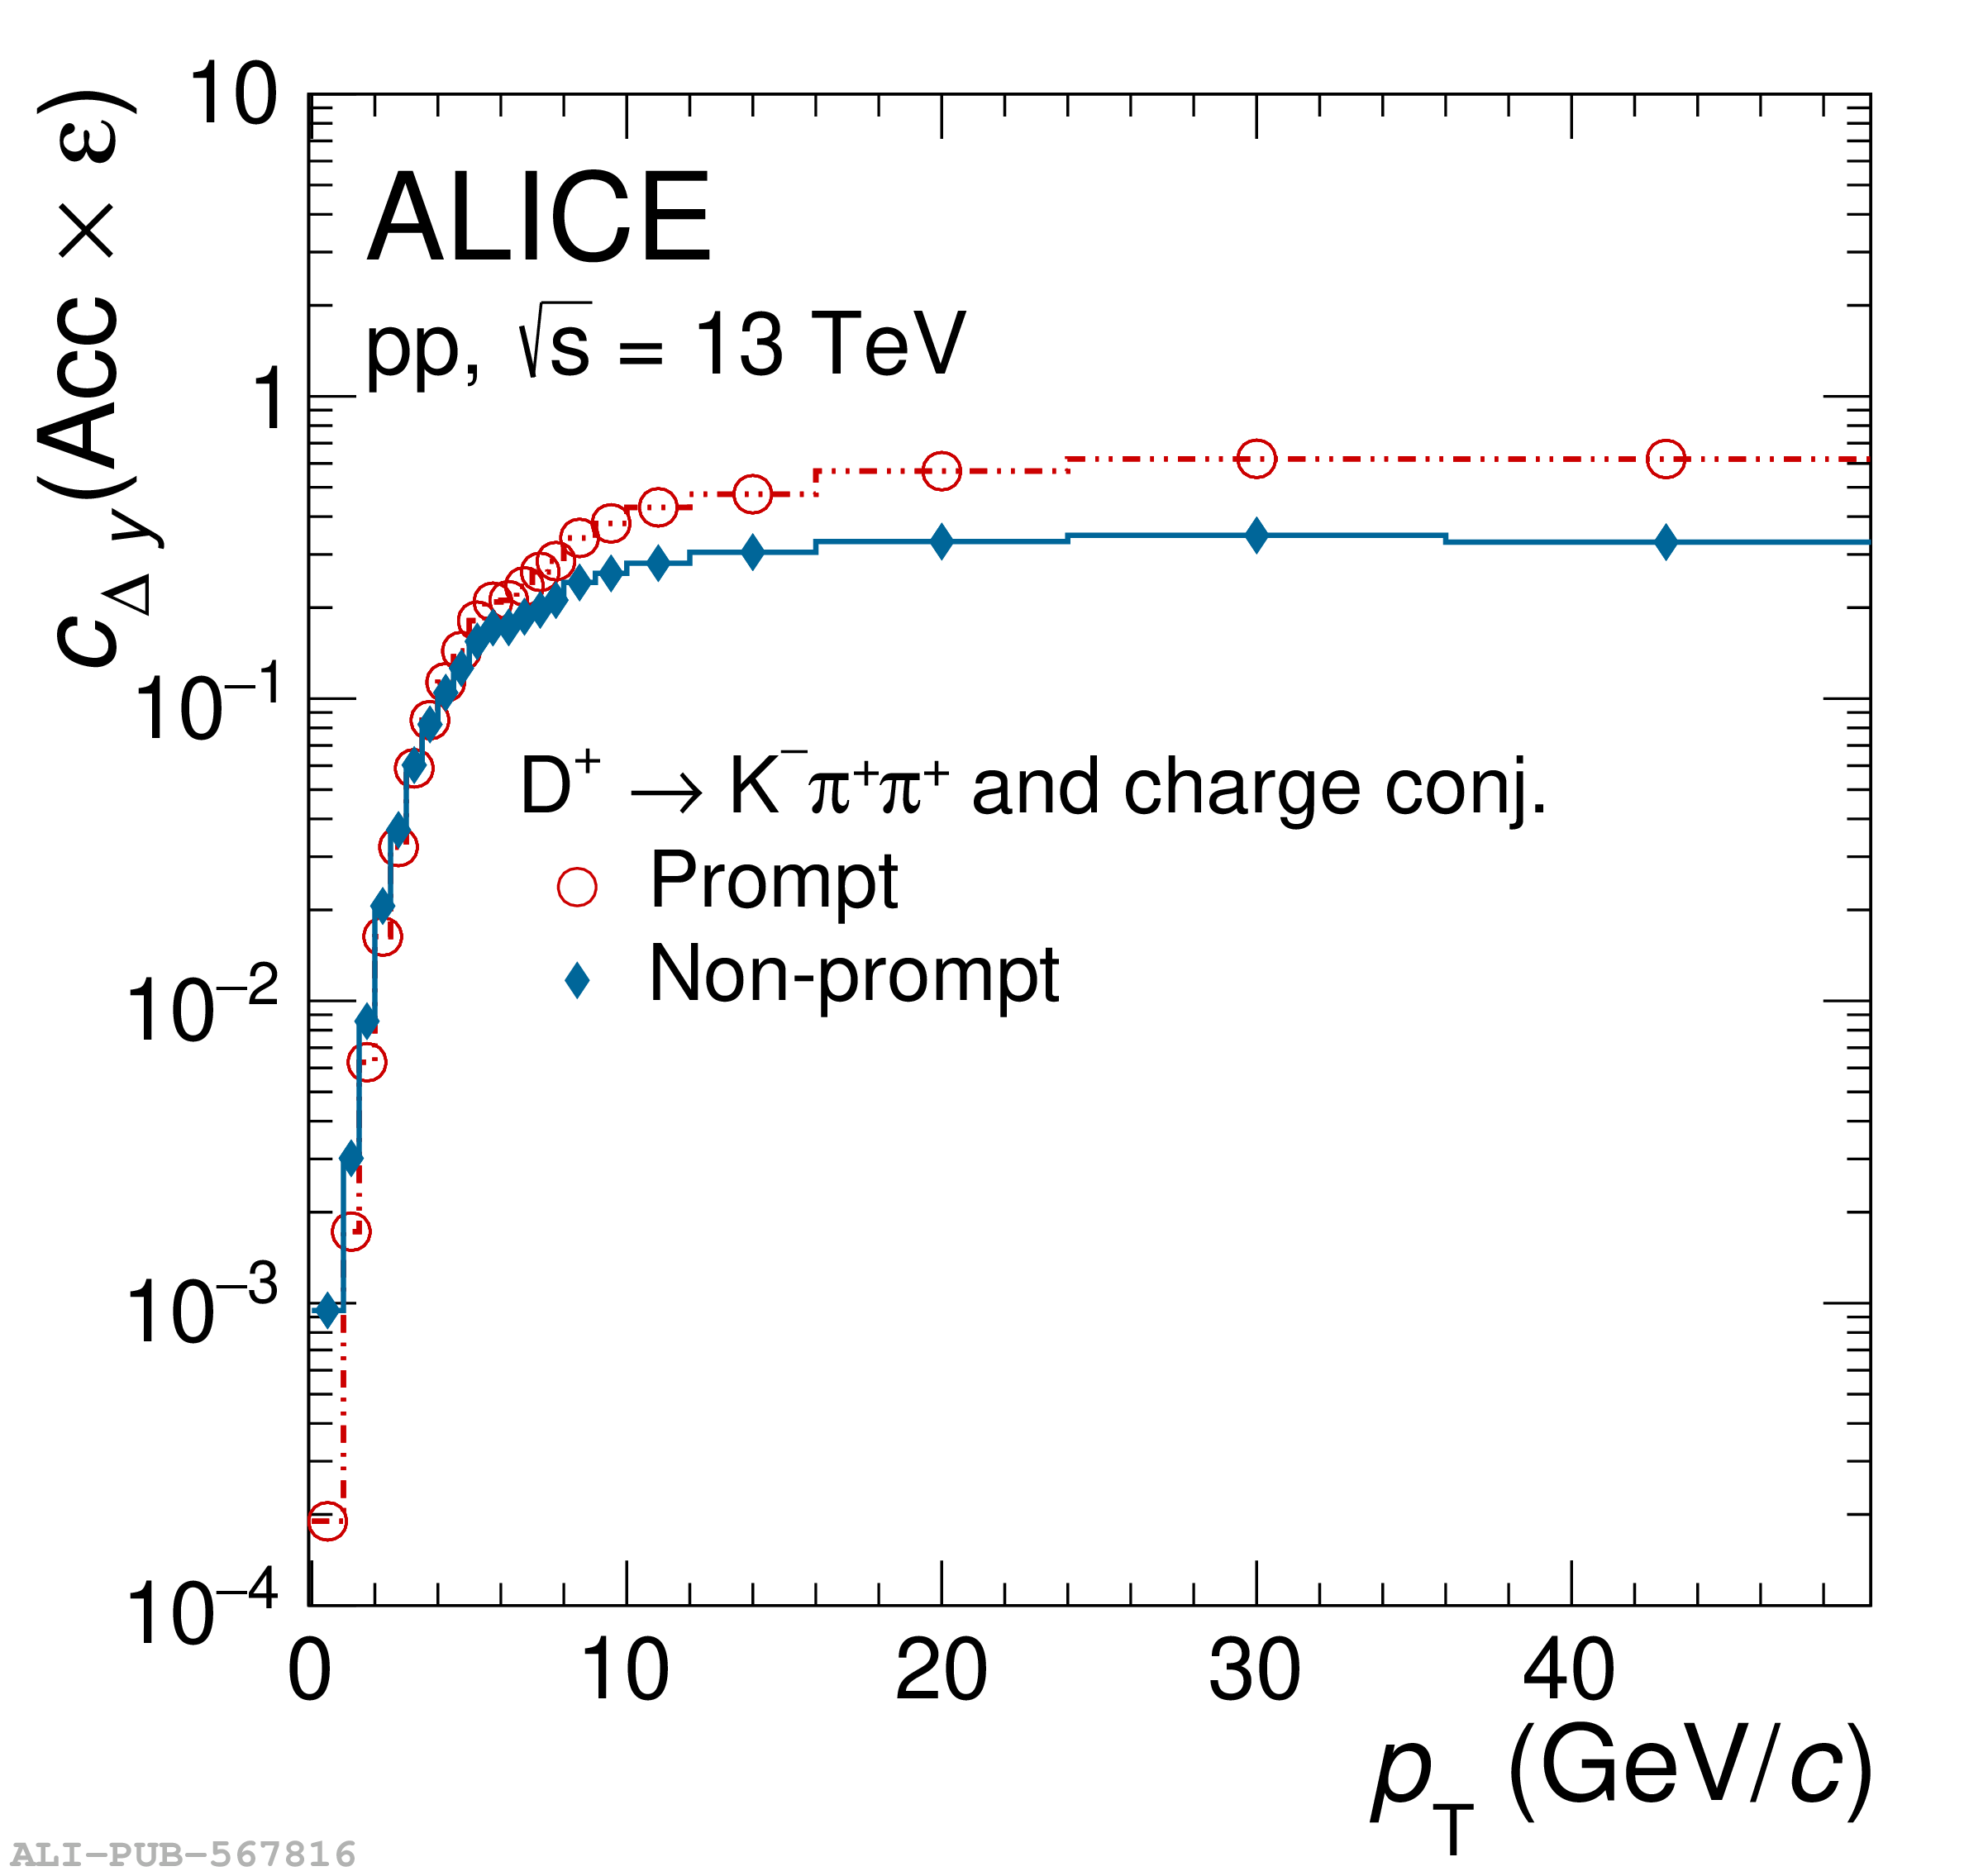 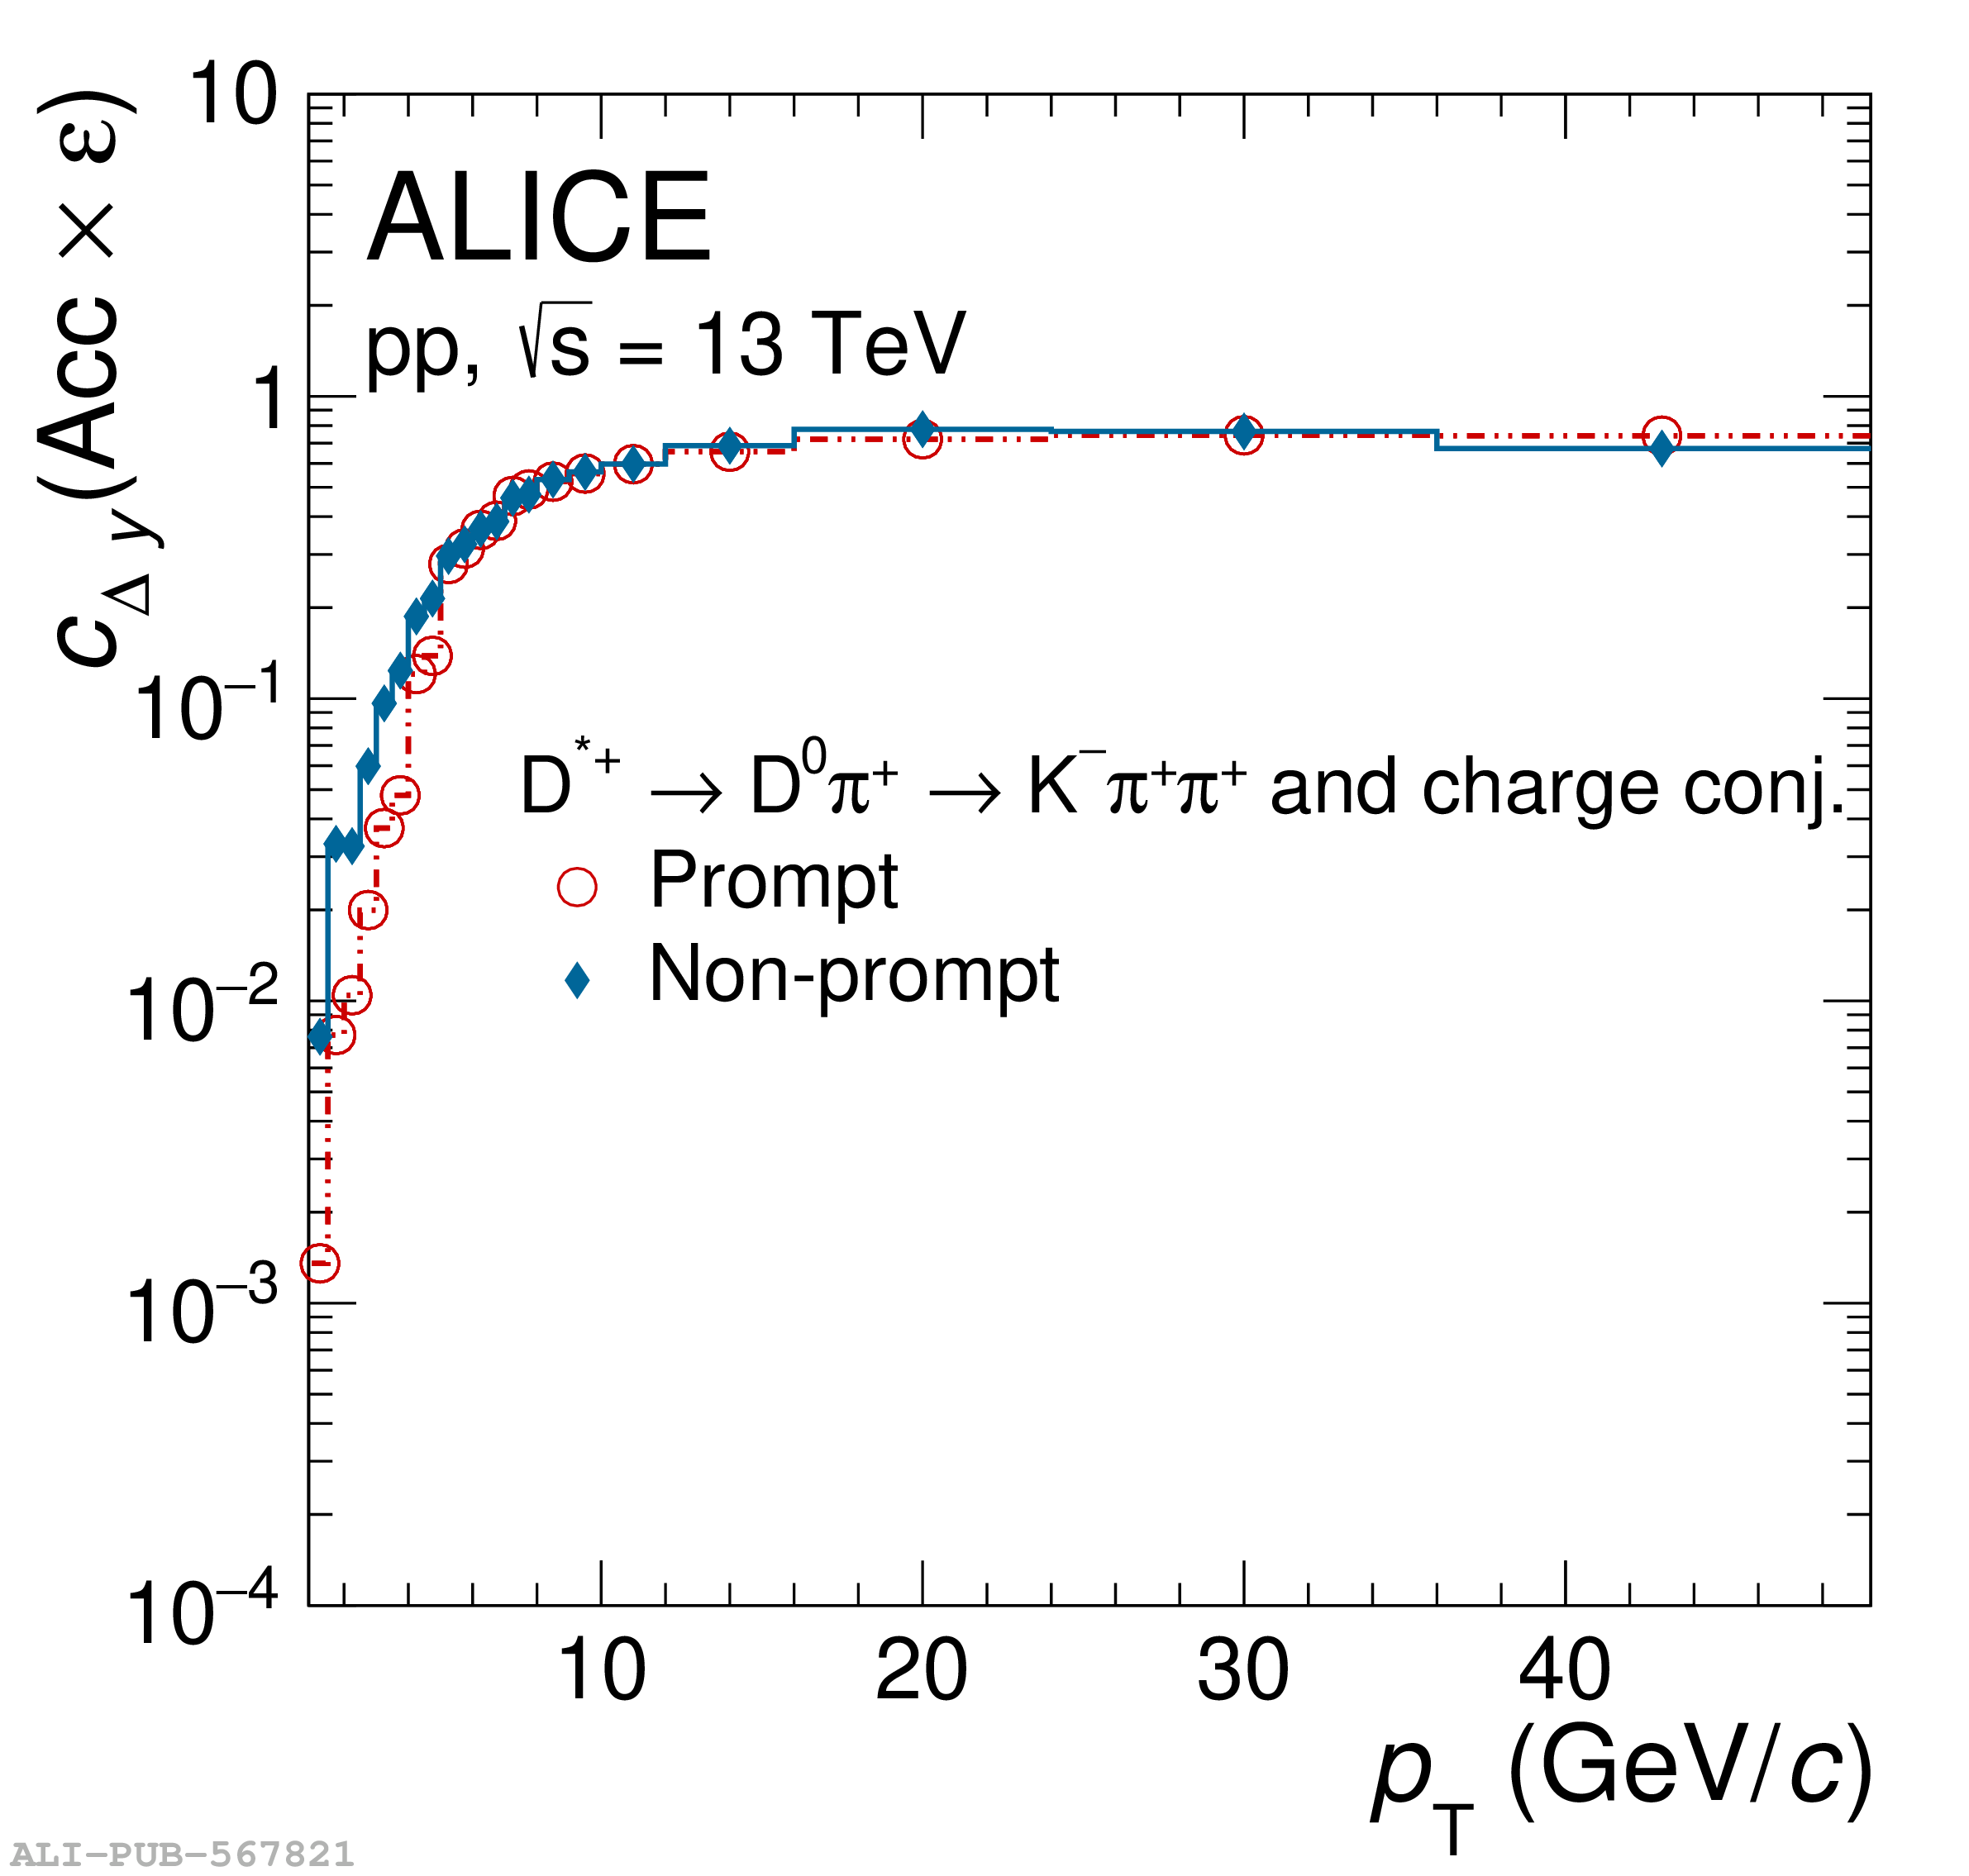 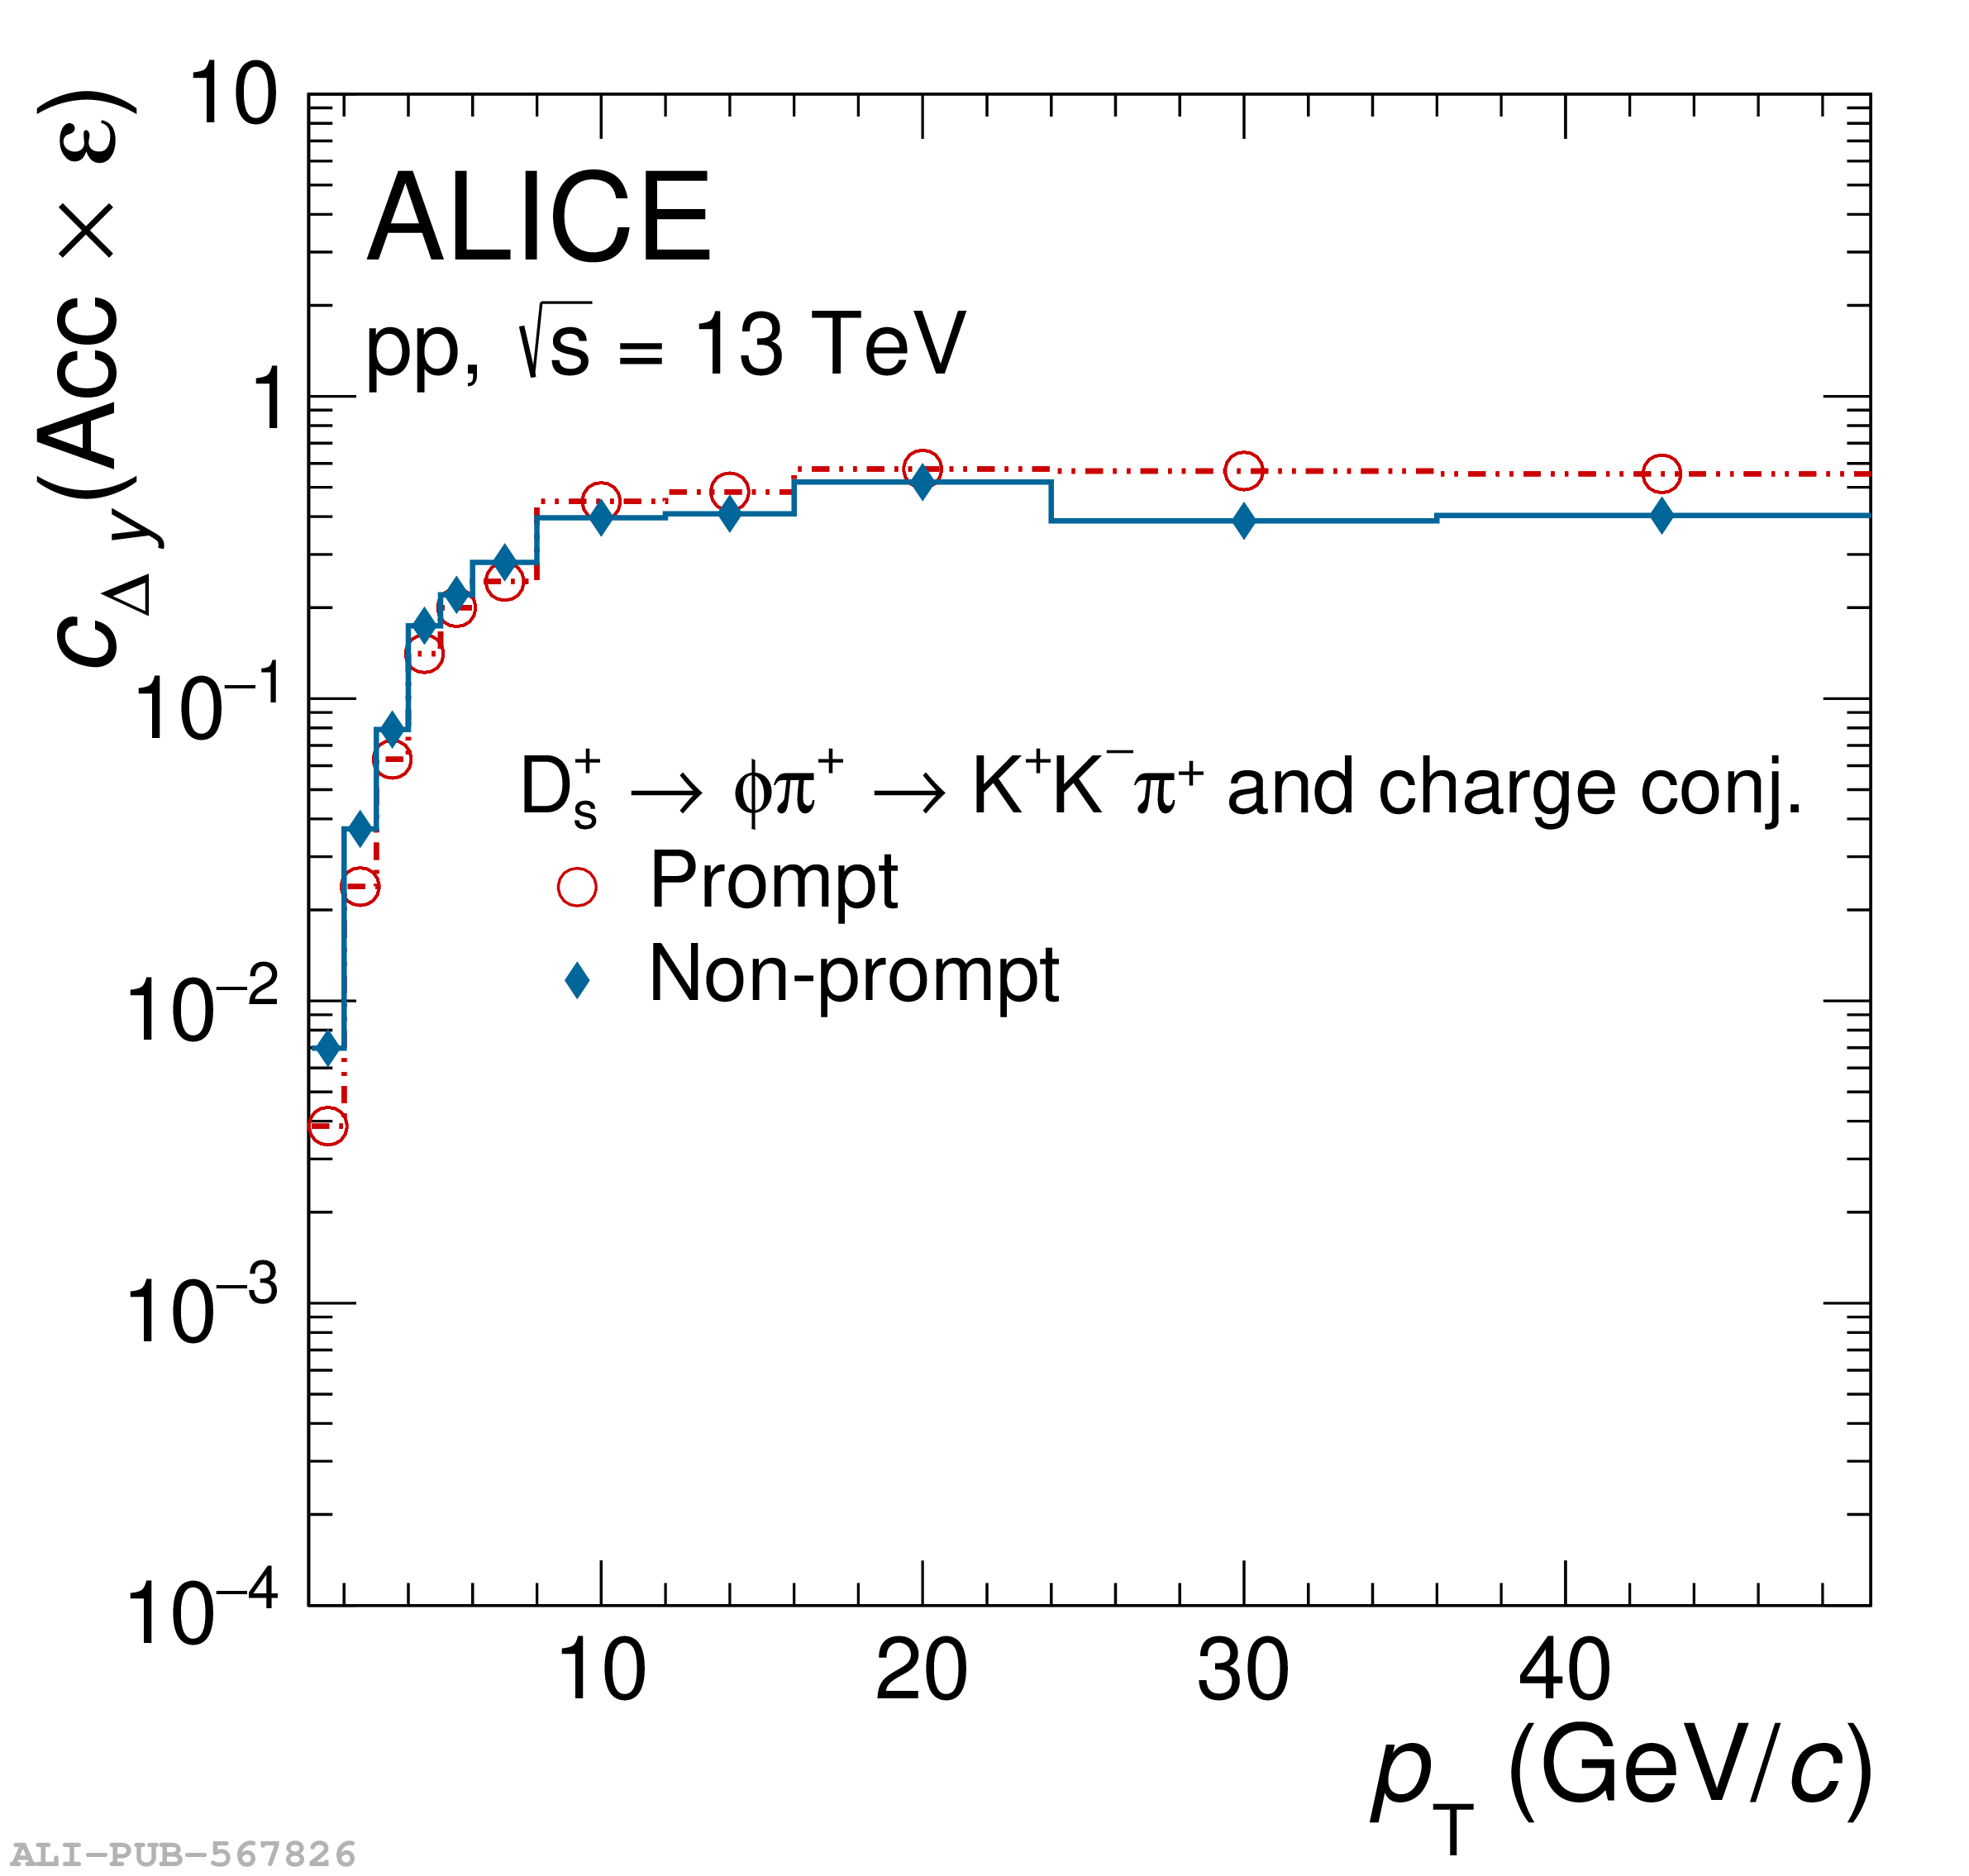 |
Figure 4
$\pt$-differential production cross sections of prompt $\Dzero$, $\Dplus$, $\Dstar$, and $\Ds$ mesons at midrapidity ($|y|<0.5$) in pp collisions at $\s=13$ TeV The vertical bars and boxes report the statistical and systematic uncertainties, respectively. The total systematic uncertainties reported in the plots do not include the contributions of the luminosity and the branching ratio, which are reported separately. The measured prompt $\Dstar$-meson production cross section was scaled by a factor of $1/5$ for better visibility reasons. | 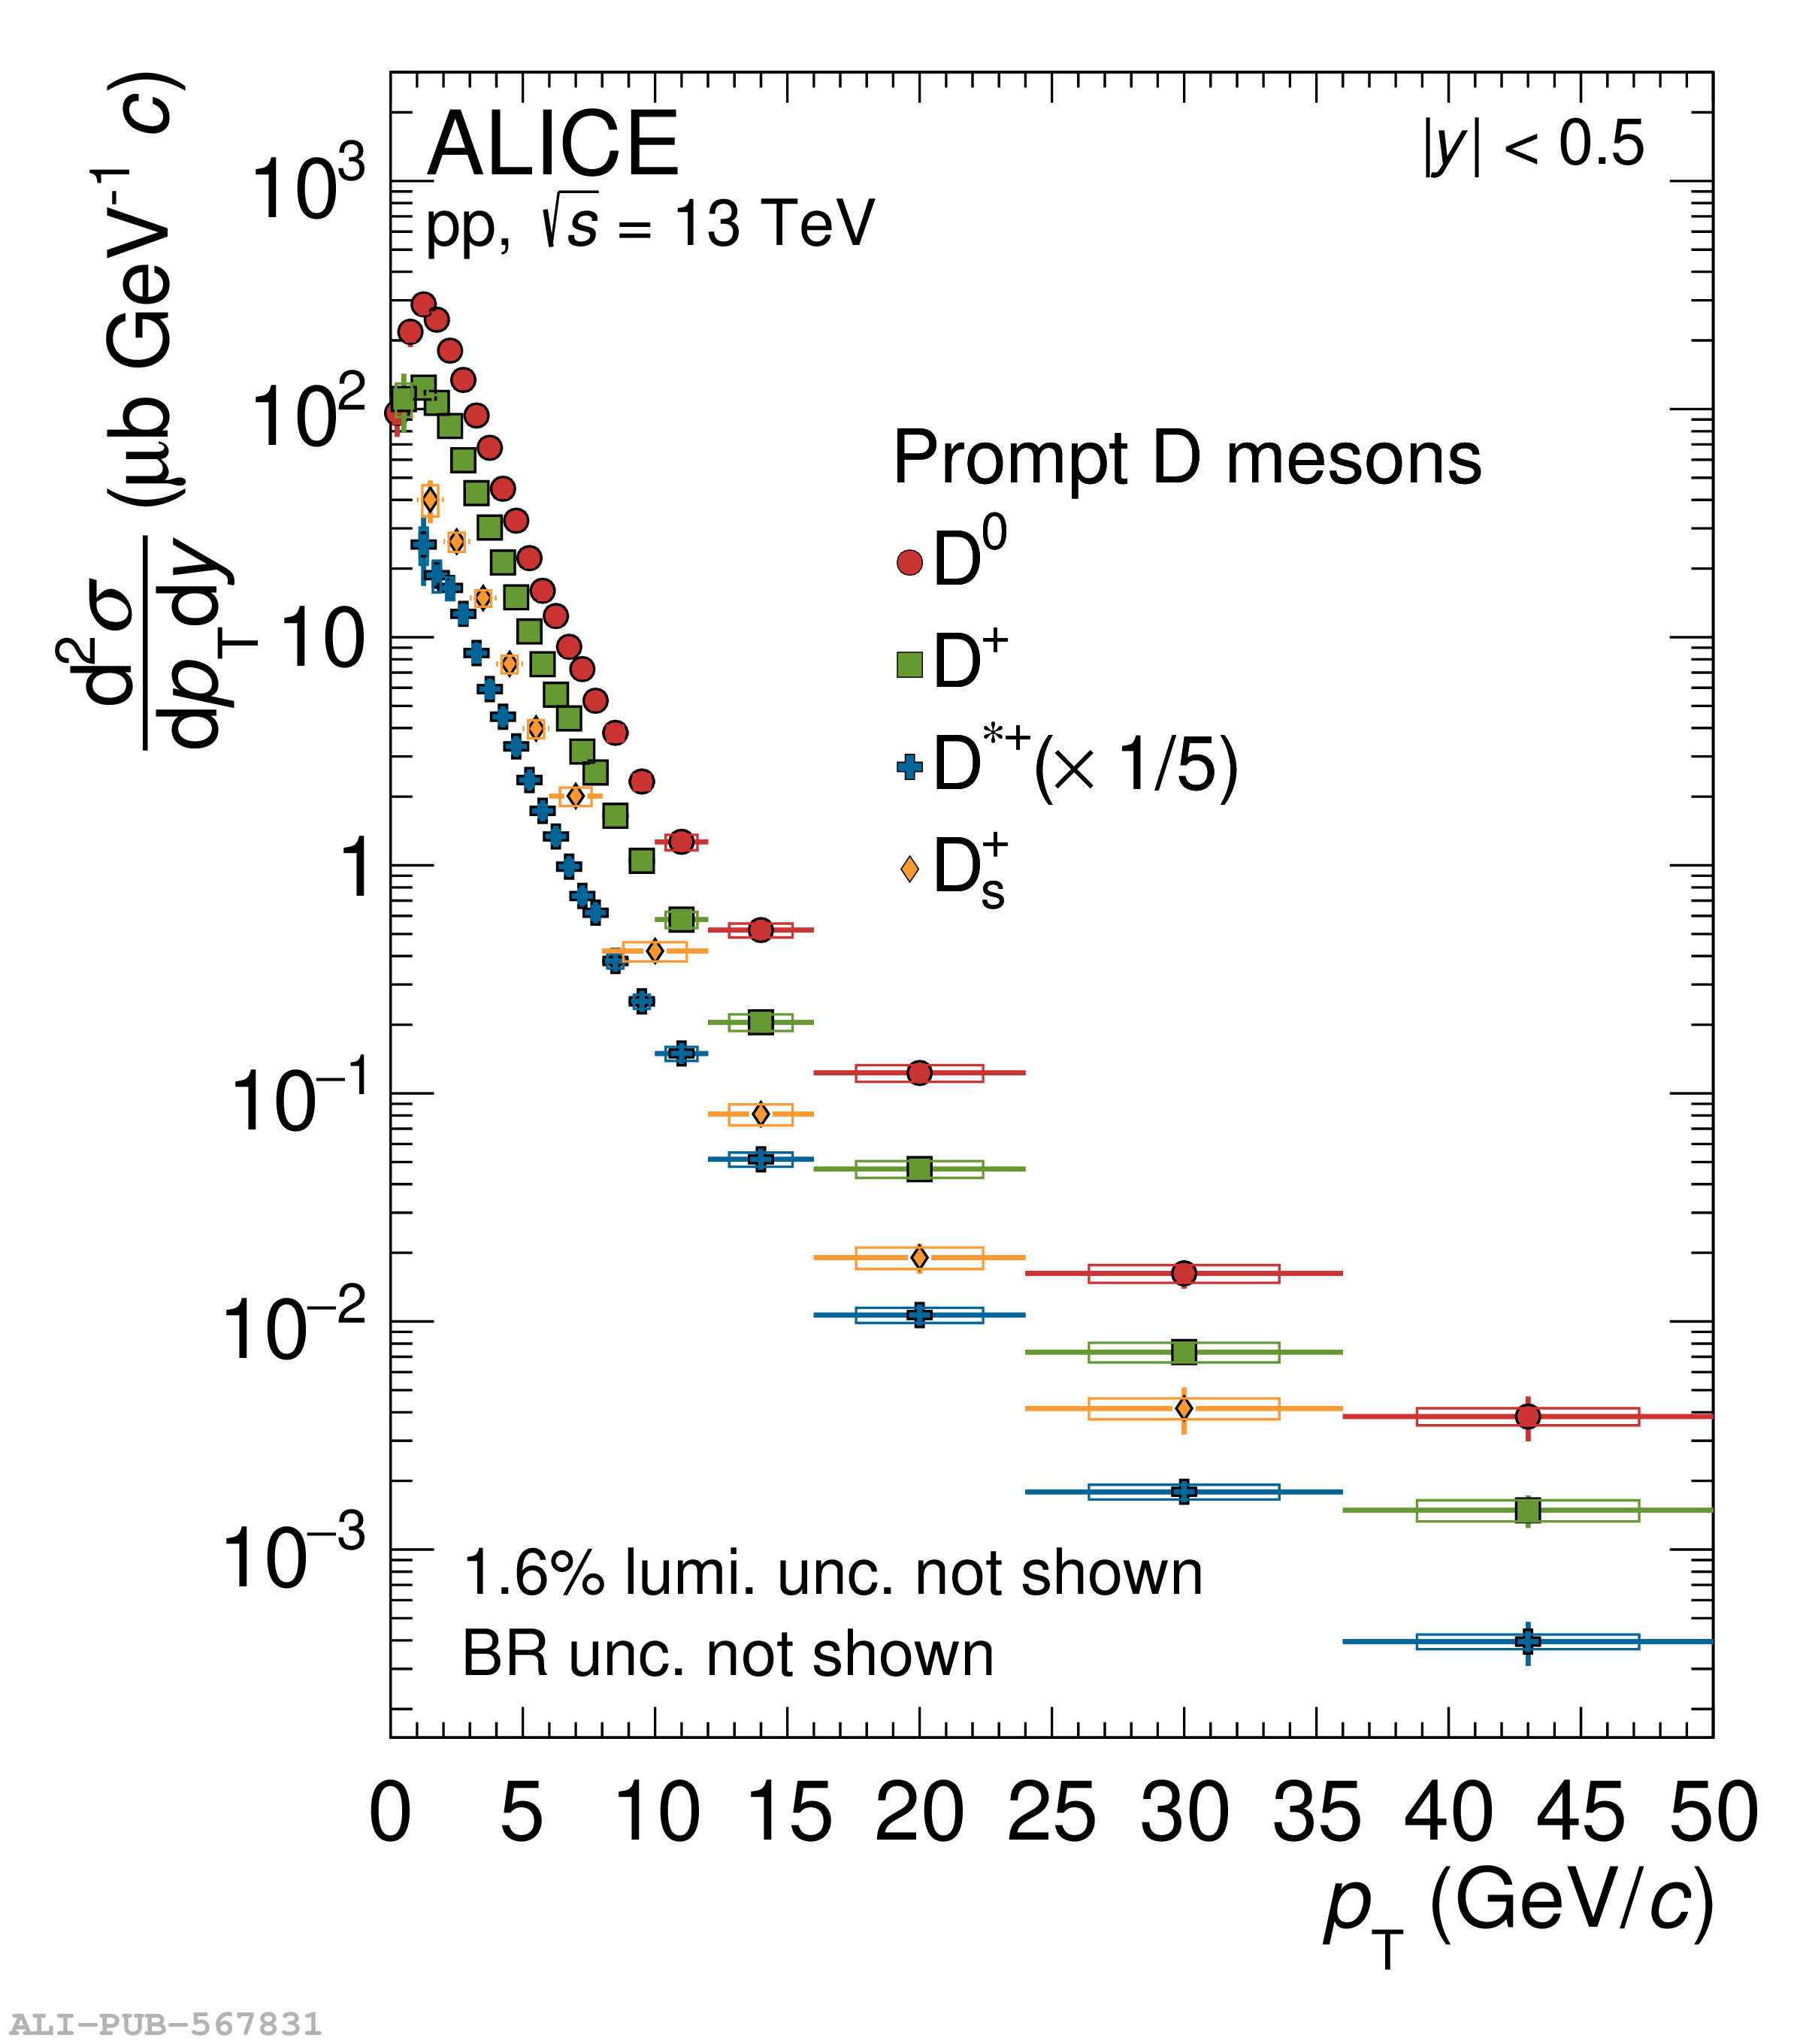 |
Figure 5
$\pt$-differential production cross sections for prompt D mesons in comparison with pQCD calculations: FONLL , GM-VFNS , and $k_{\mathrm{T}}$-factorisation . The uncertainty on the predictions is depicted as coloured boxes The ratios of the data to the theoretical predictions are shown in the lower part of each panel. The statistical (systematic) uncertainties are depicted as vertical bars (boxes). | 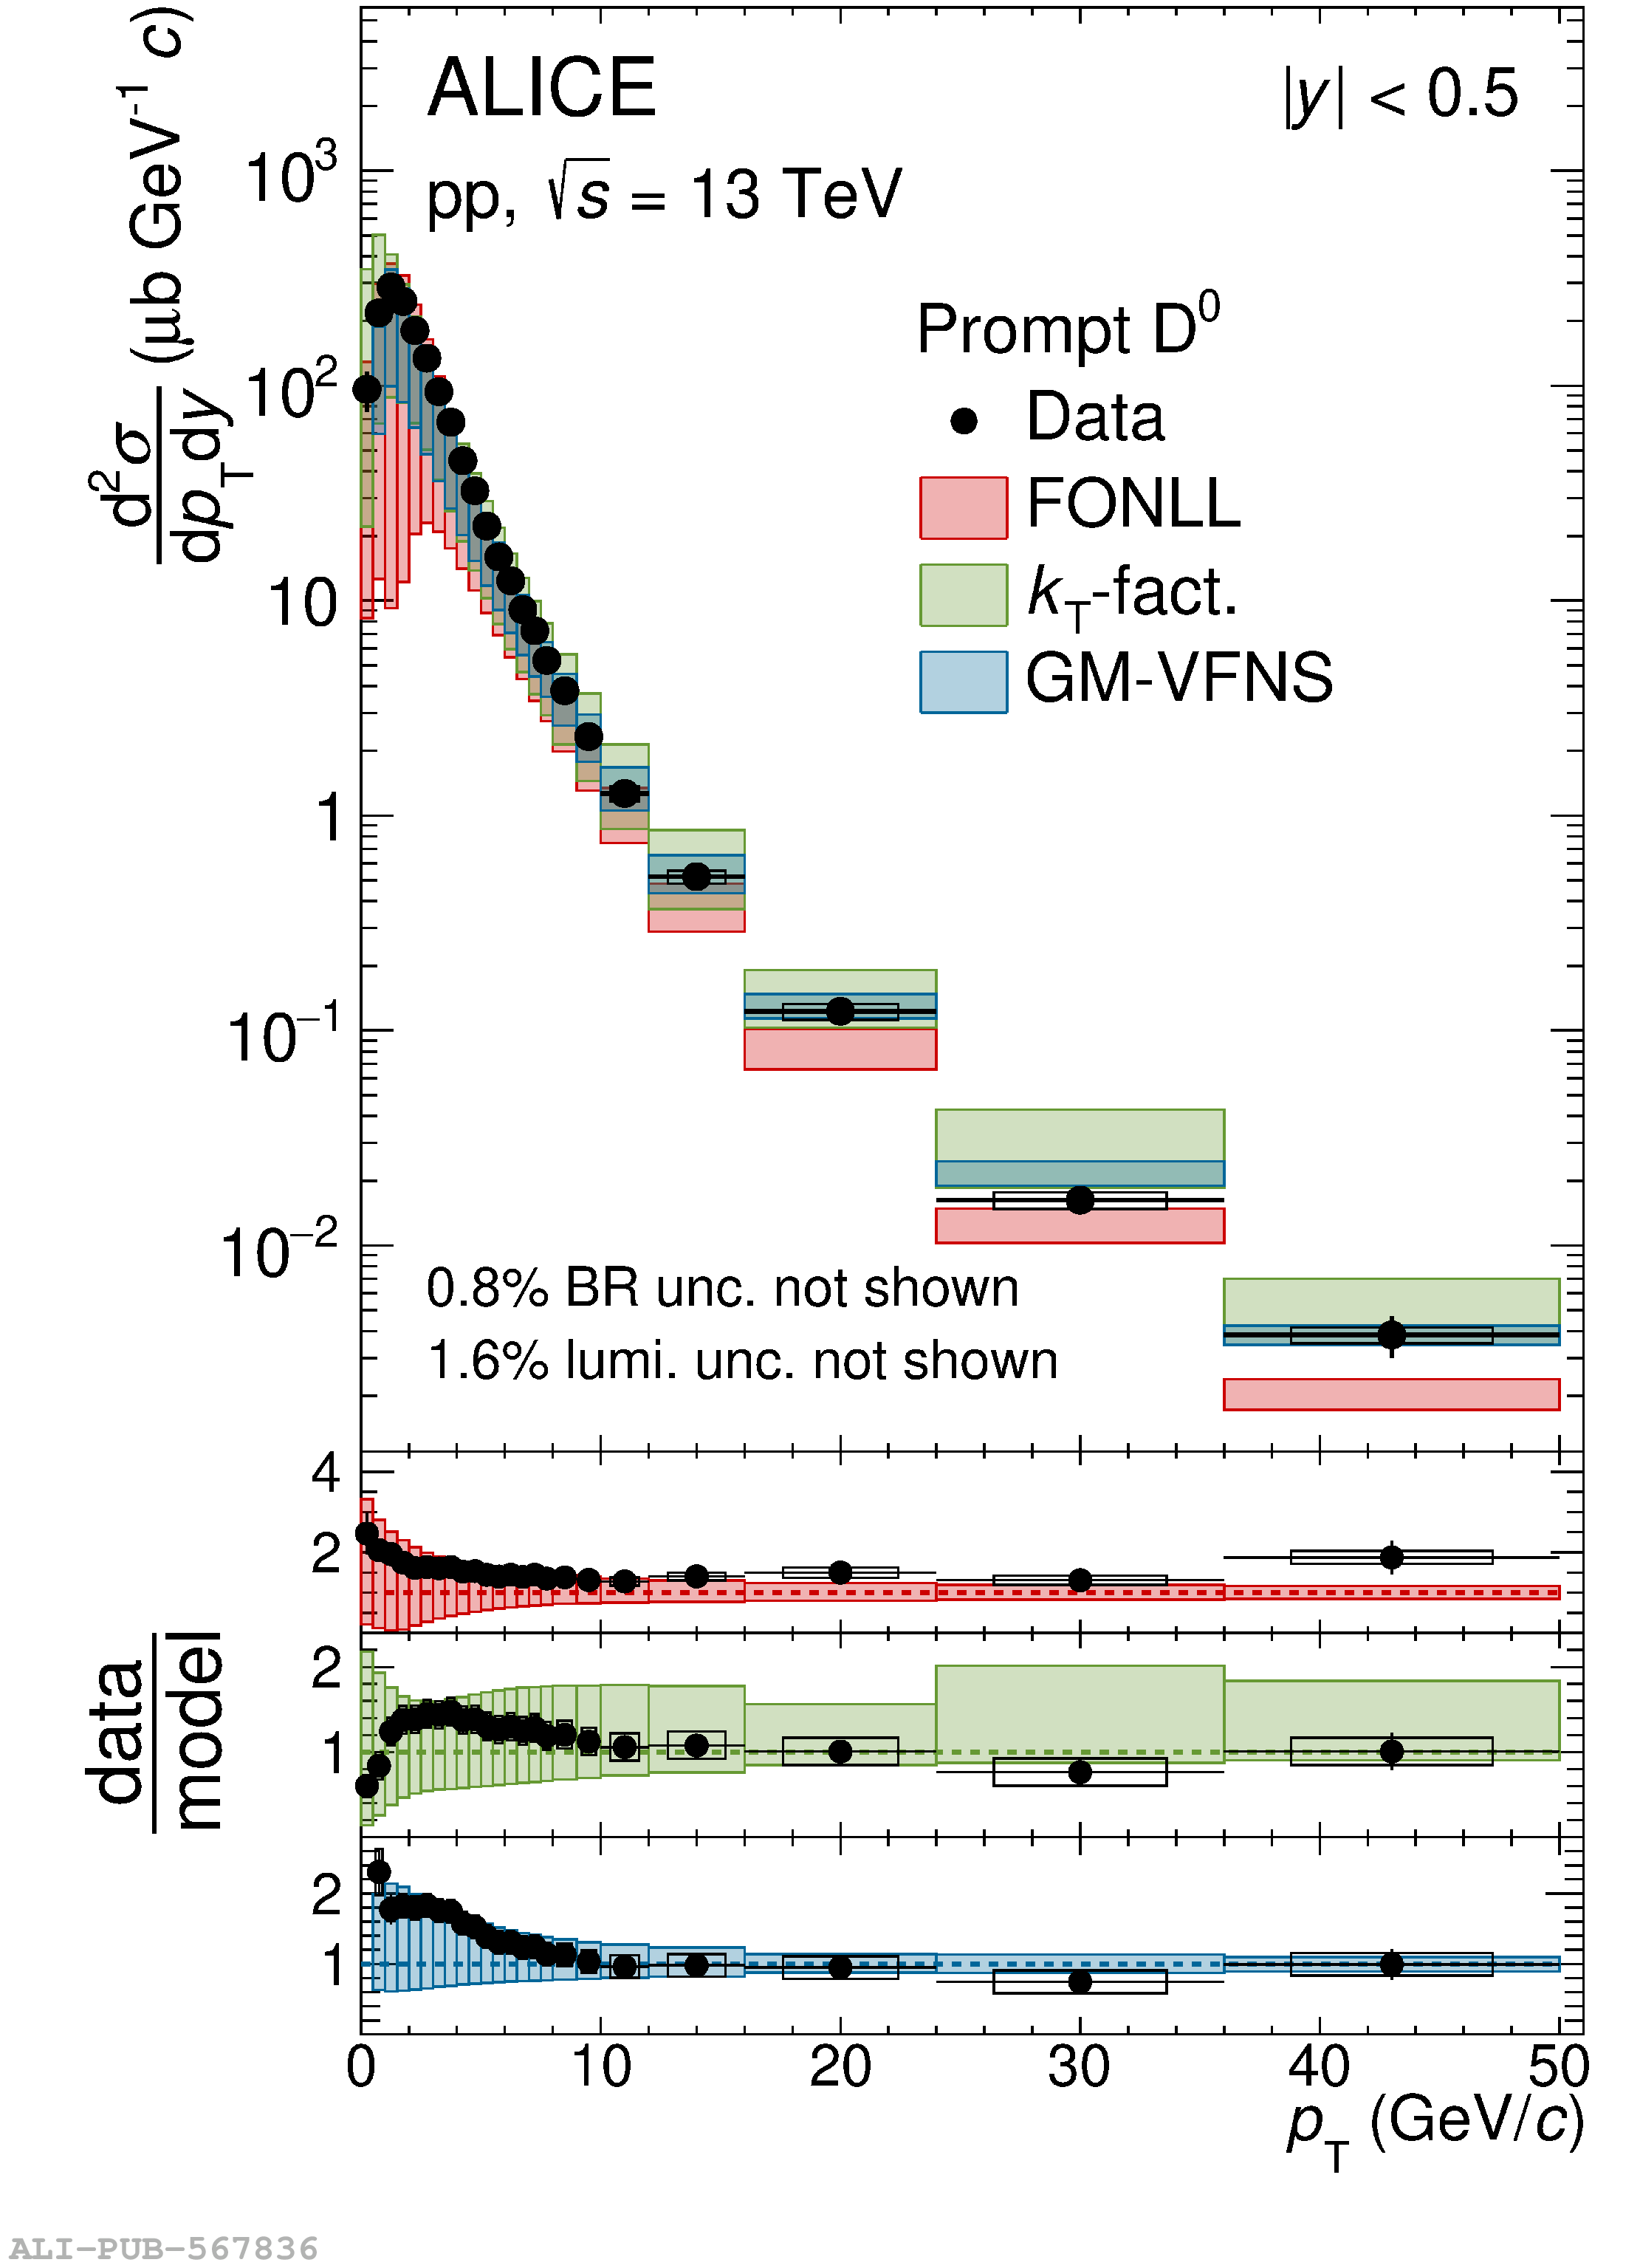 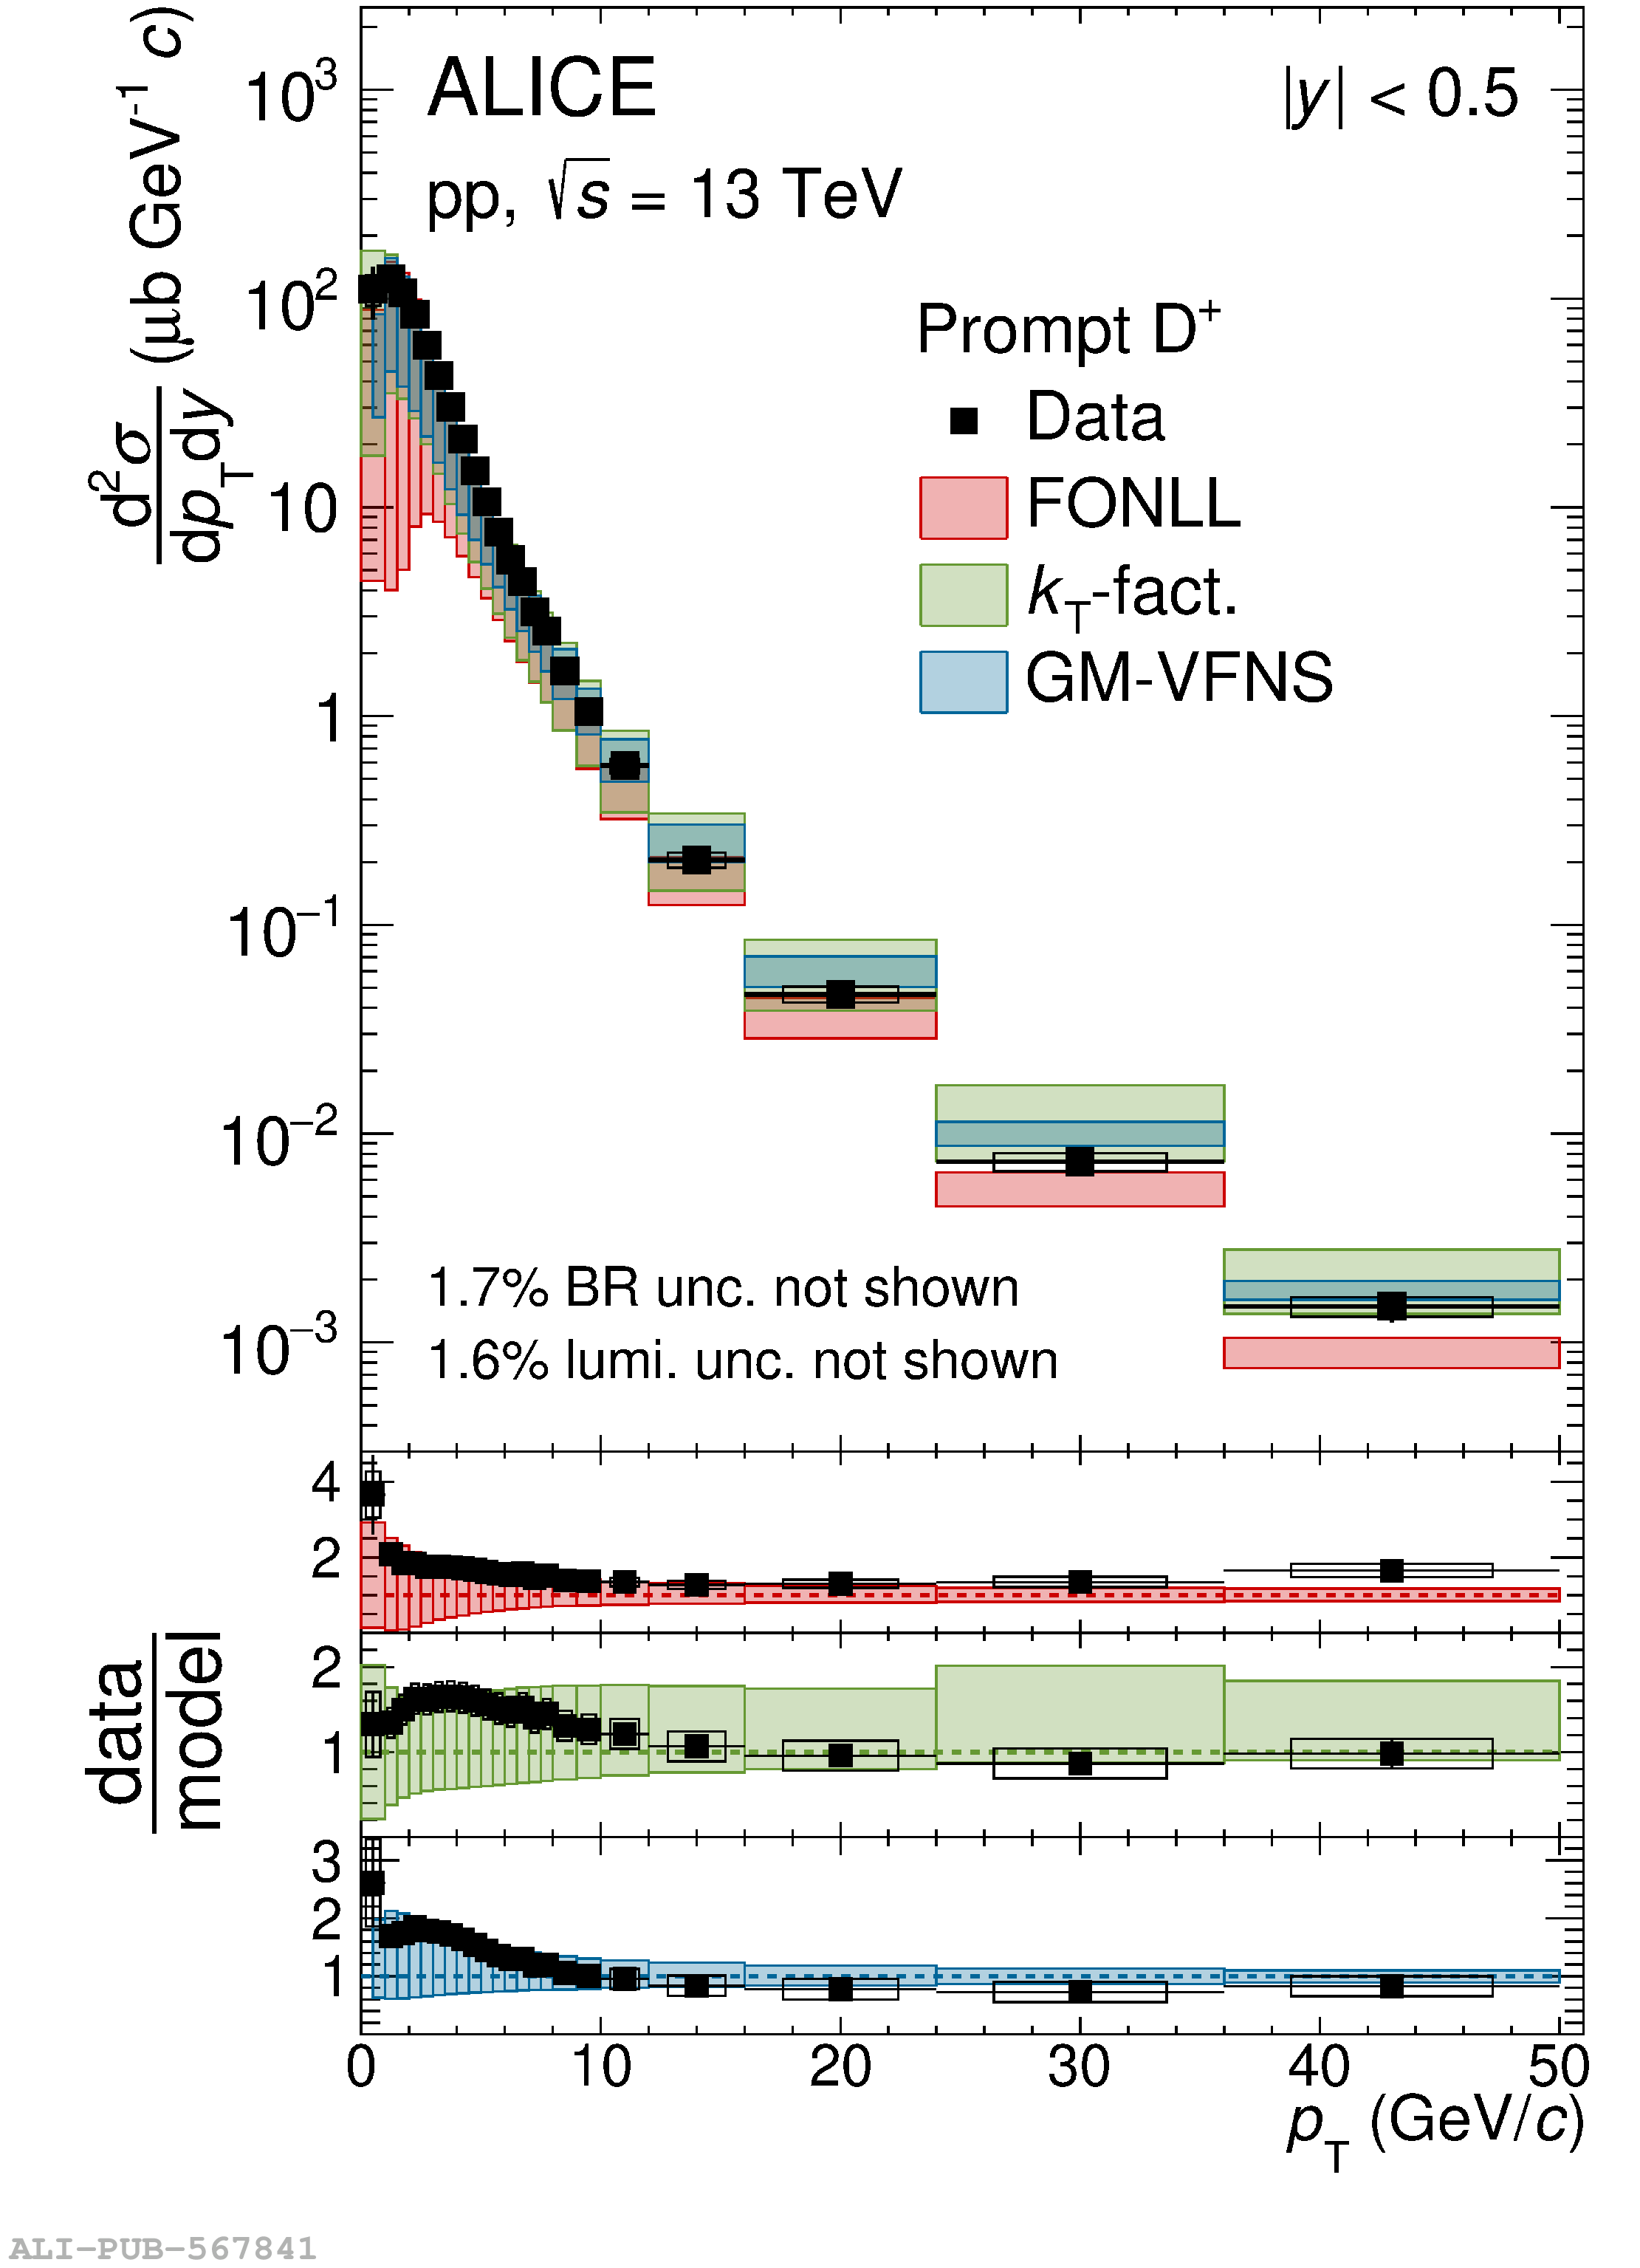 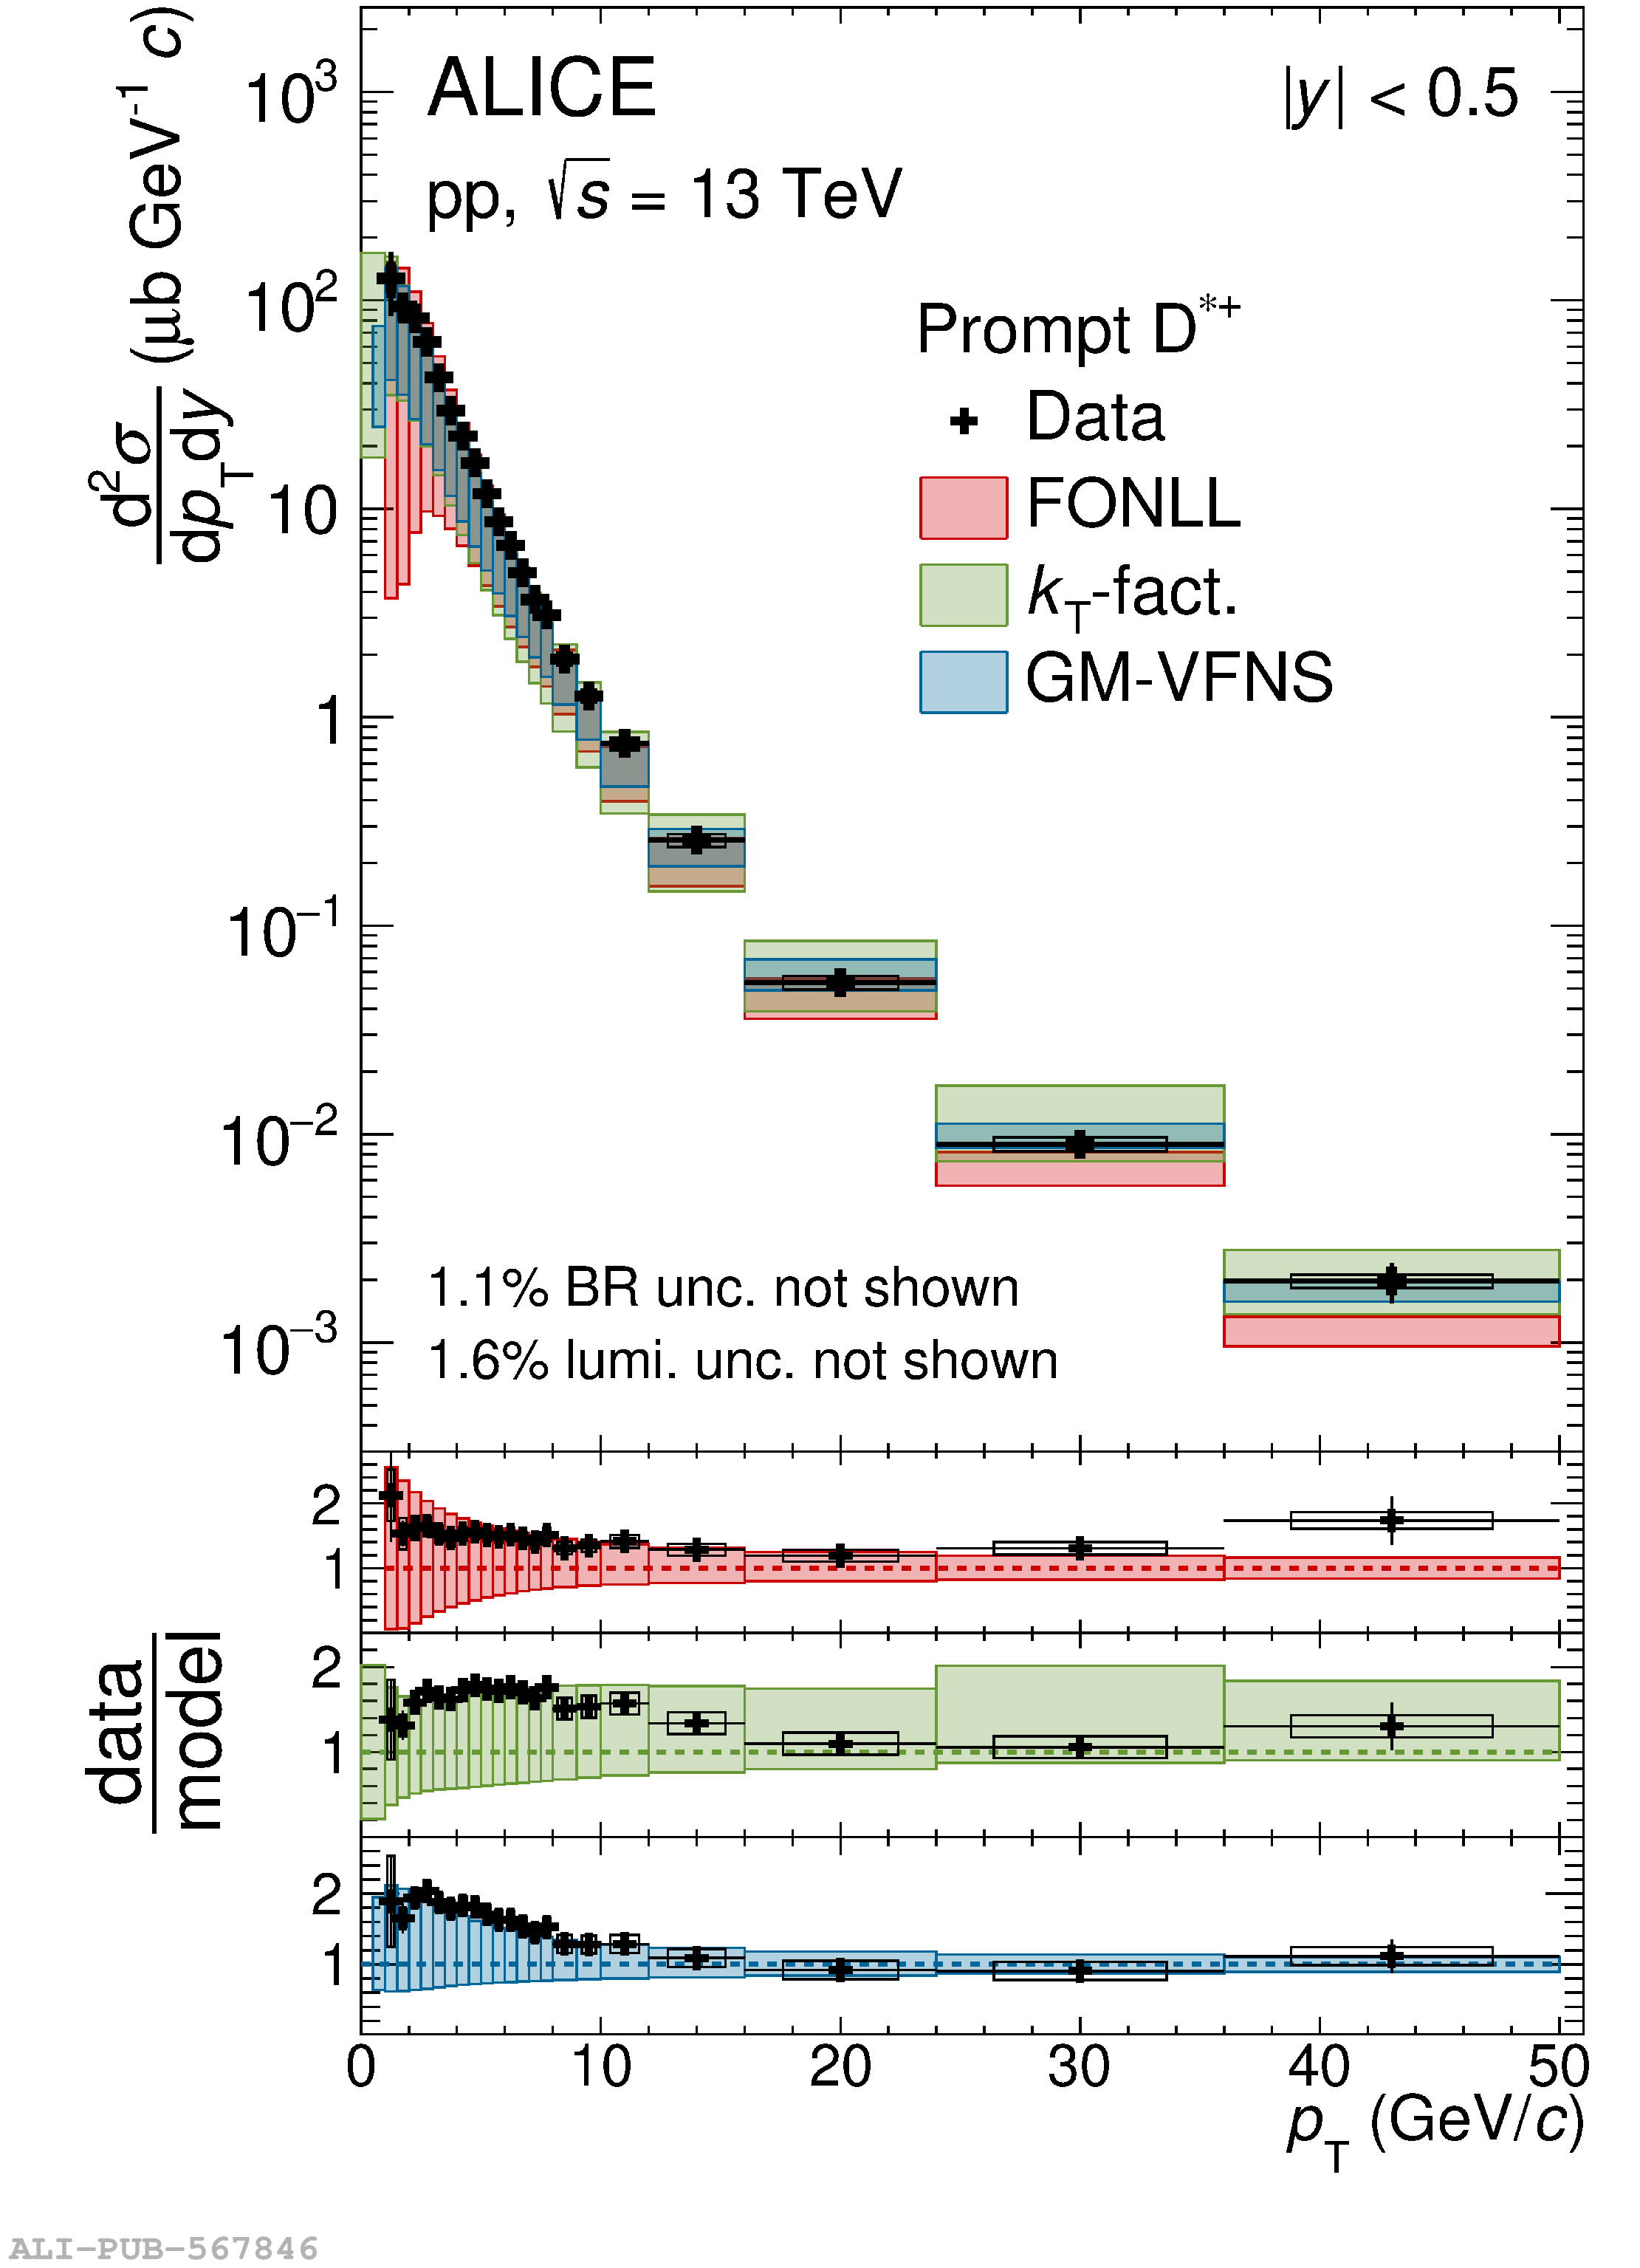 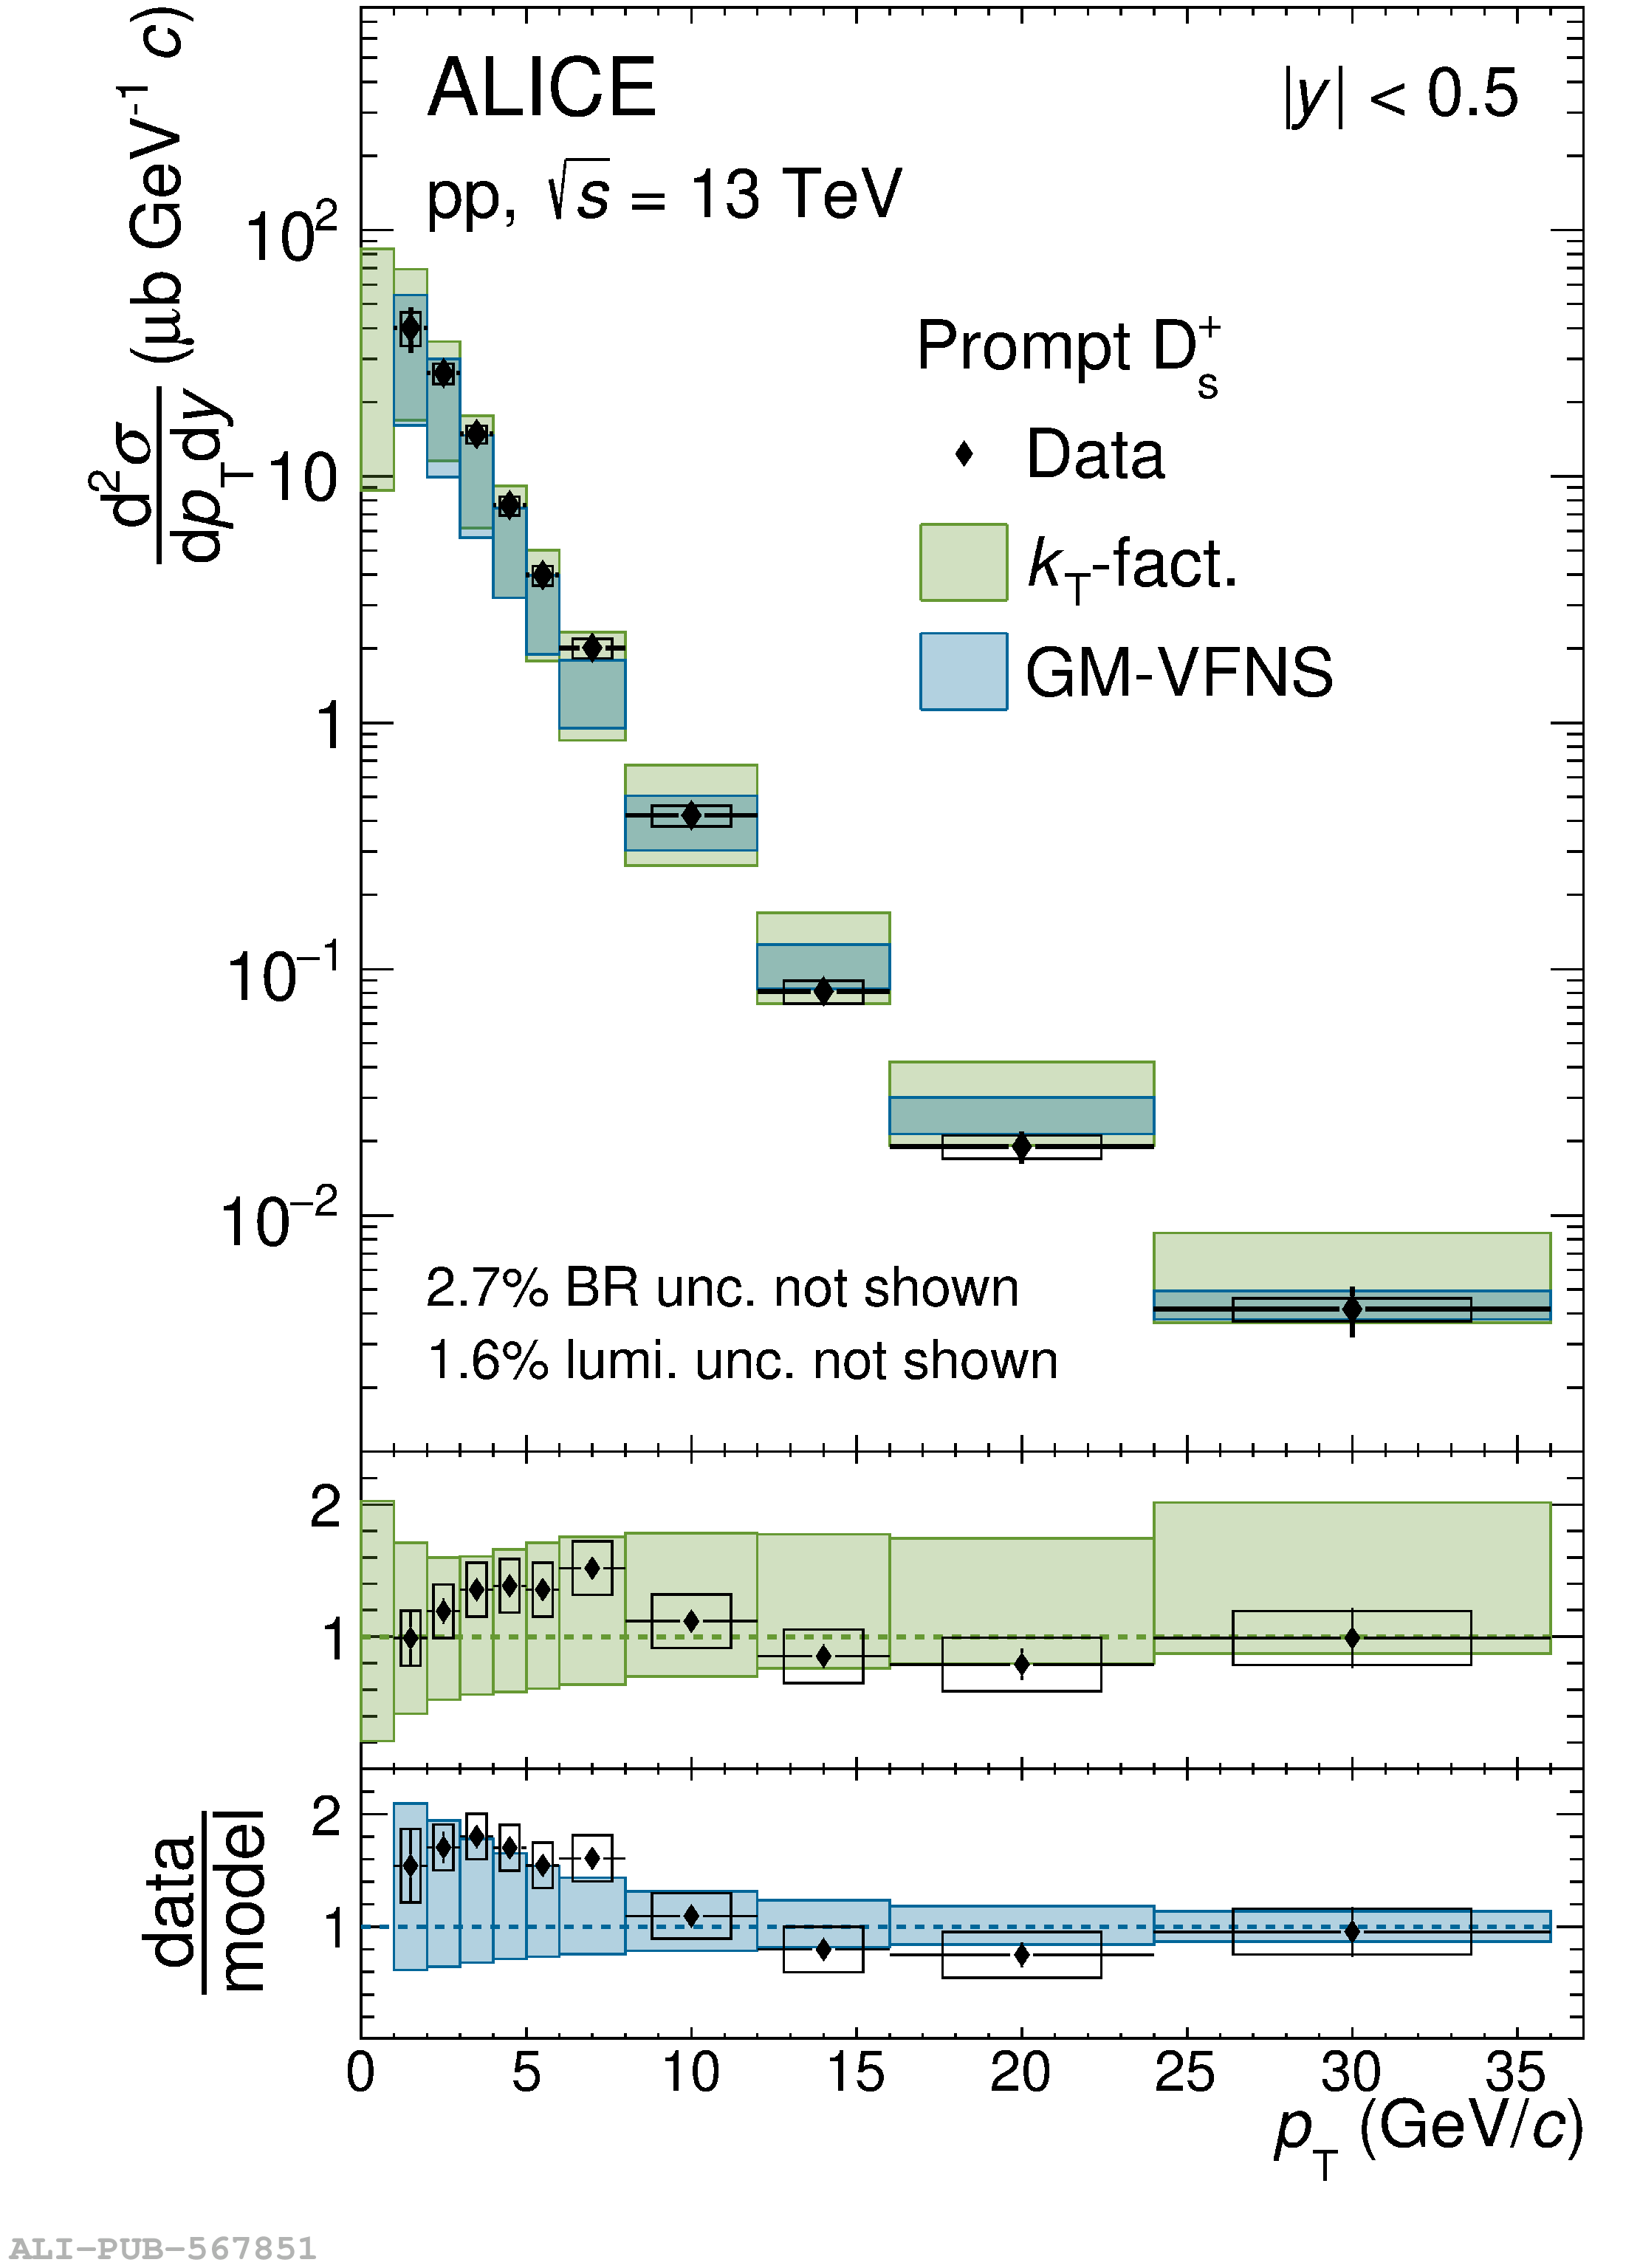 |
Figure 6
$\pt$-differential production cross sections of prompt $\Lambda_{\rm c}^+$, $\Xi_{\rm c}^0$, $\Xi_{\rm c}^+$, and $\Sigma_{\rm c}^{0.++}$ baryons at midrapidity ($|y|<0.5$) in pp collisions at $\s=13$ TeV . The statistical (systematic) uncertainties are shown as vertical bars (boxes). The shaded boxes report the BR uncertainty. | 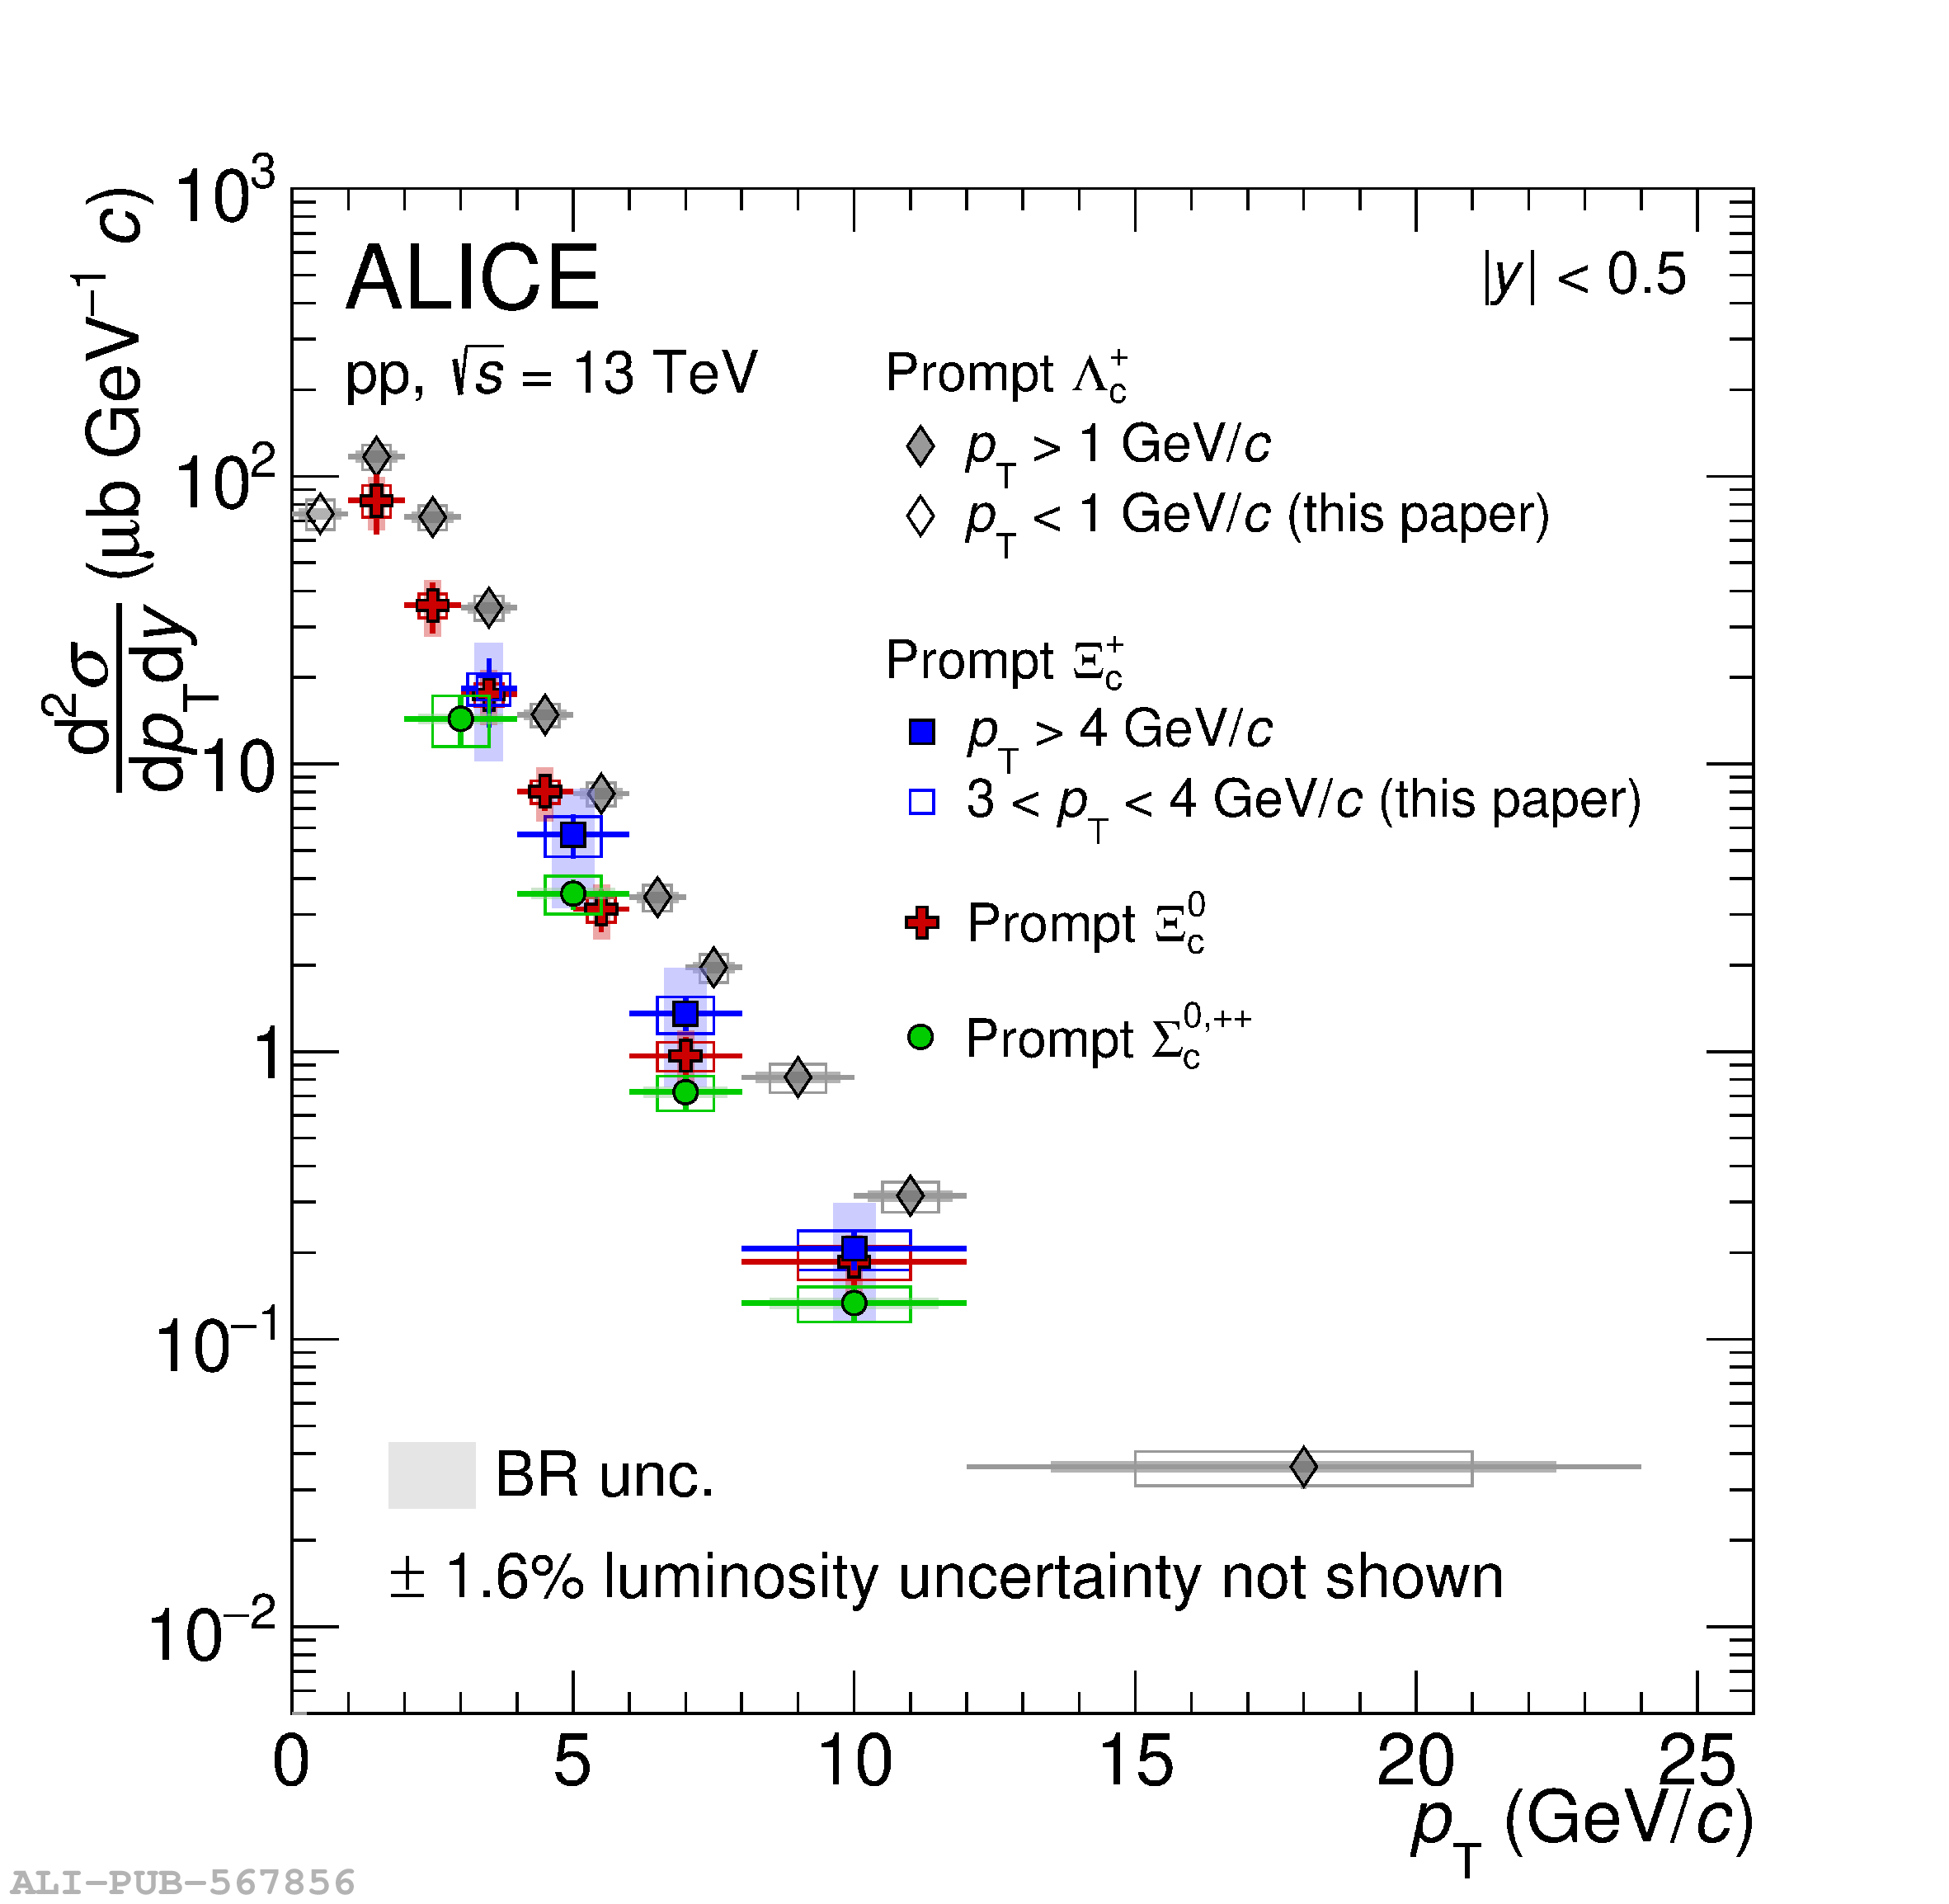 |
Figure 7
Ratios of production cross sections as a function of $\pt$ of prompt $\Dplus/\Dzero$, $\Dstar/\Dzero$, $\Ds/\Dzero$, $\Ds/\Dplus$, and $\Ds/(\Dzero+\Dplus)$ mesons in pp collisions at $\s = 5.02$ TeV , $\s = 7$ TeV , and $\s = 13$ TeV. Vertical bars (boxes) report the statistical (systematic) uncertainties. | 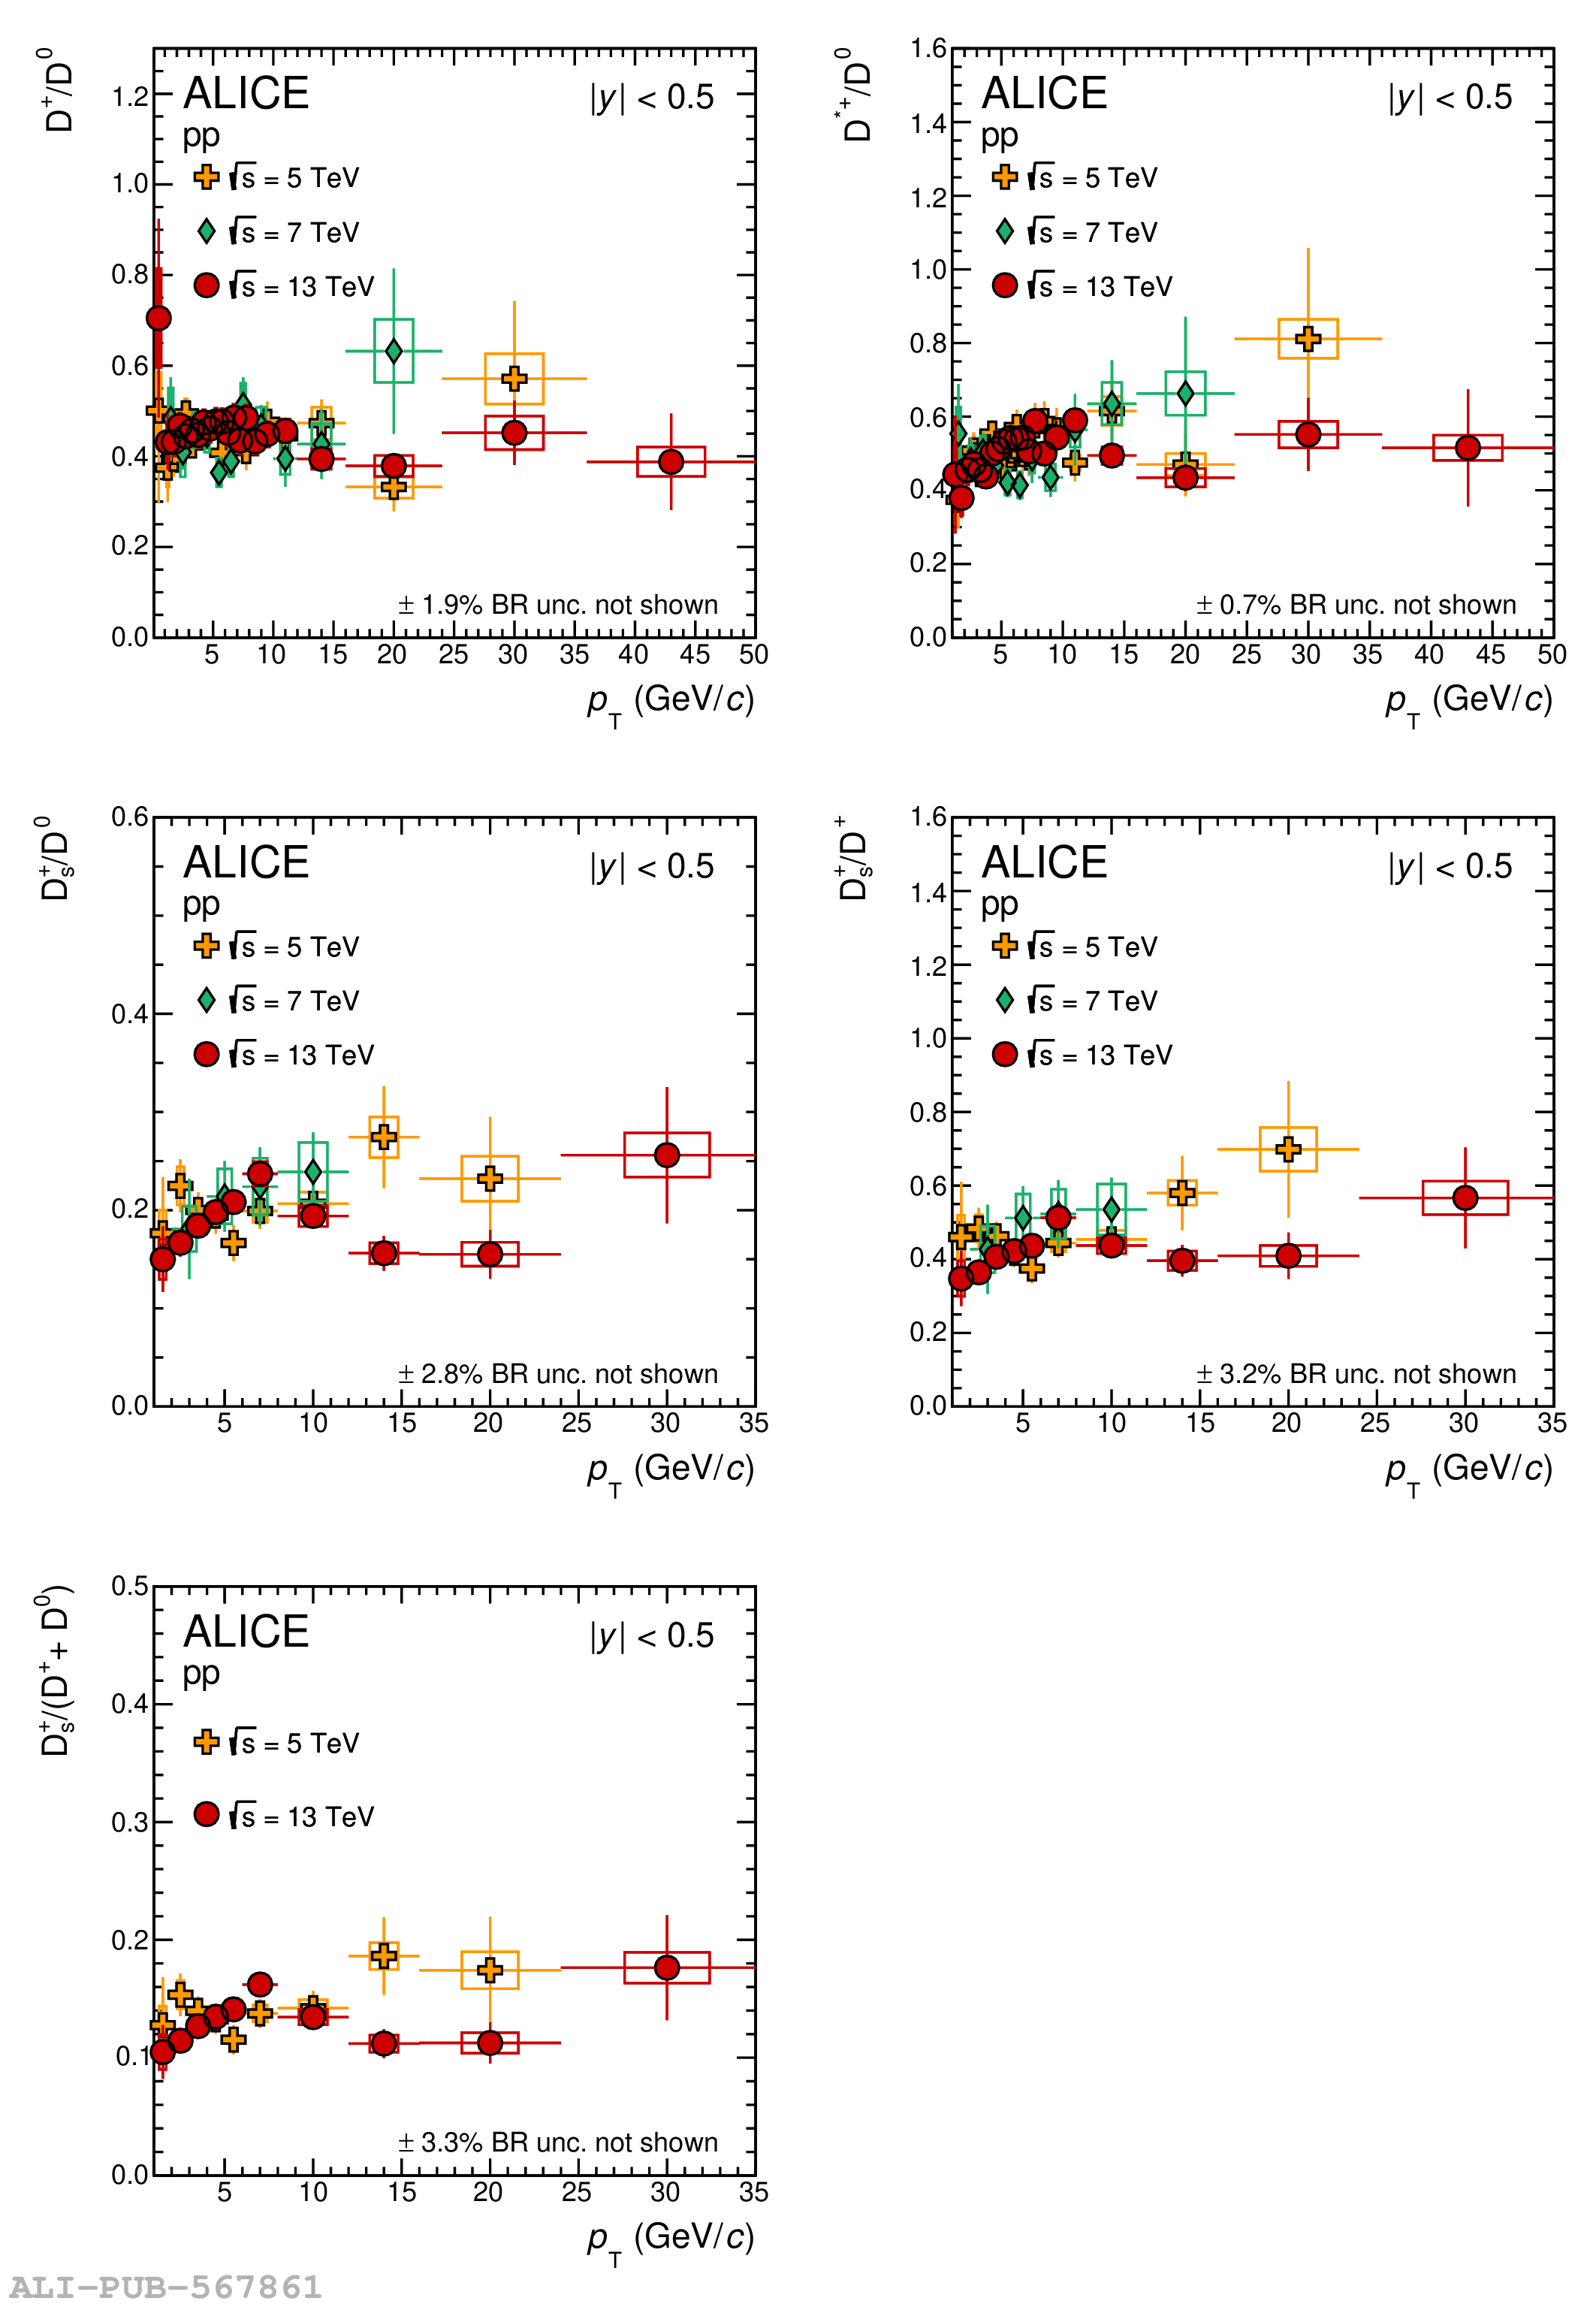 |
Figure 8
Top left: ratio between the $\pt$-differential cross sections at midrapidity ($|y|<0.5$) of prompt $\Lambda_{\rm c}^+$ baryons and $\Dzero$ mesons in pp collisions at $\s=5.02$ TeV , 7 TeV and $13$ TeV The measurement of $\Lambda_{\rm c}^+/\Dzero$ ratio in \pp collisions at $\s=13$ TeV for $\pt>1$ GeV$/c$ uses the $\Lambda_{\rm c}^+$-baryon cross section published in Ref. Bottom left: ratio between the $\pt$-differential cross sections at midrapidity ($|y|<0.5$) of prompt $\Lambda_{\rm c}^+$ baryons and $\Dzero$ mesons in pp collisions at $\s=13$ TeV compared with the predictions from PYTHIA Monash tune , PYTHIA CR-BLC Mode 0, 2 and 3 , SHM+RQM , Catania , QCM , and POWLANG models in pp collisions at $\s=13$ TeV Top right: $\pt$-differential $\Xi_{\rm c}^+/\Dzero$ ratio in pp collisions at $\s=13$ TeV and $\Xi_{\rm c}^0/\Dzero$ ratio in pp collisions at $\s=5.02$ TeV and $\s=13$ TeV . The $\Xi_{\rm c}^+/\Dzero$ ratio in pp collisions at $\s=13$ TeV for $\pt>4$ GeV$/c$ uses the $\Xi_{\rm c}^+$ published in Ref. . Statistical (systematic) uncertainties are reported as vertical bars (open boxes). The shaded boxes show the BR uncertainty Bottom right: $\pt$-differential $\Xi_{\rm c}^0/\Dzero$ and $\Xi_{\rm c}^+/\Dzero$ ratio in pp collisions at $\s=13$ TeV compared with the predictions from the models reported above. | 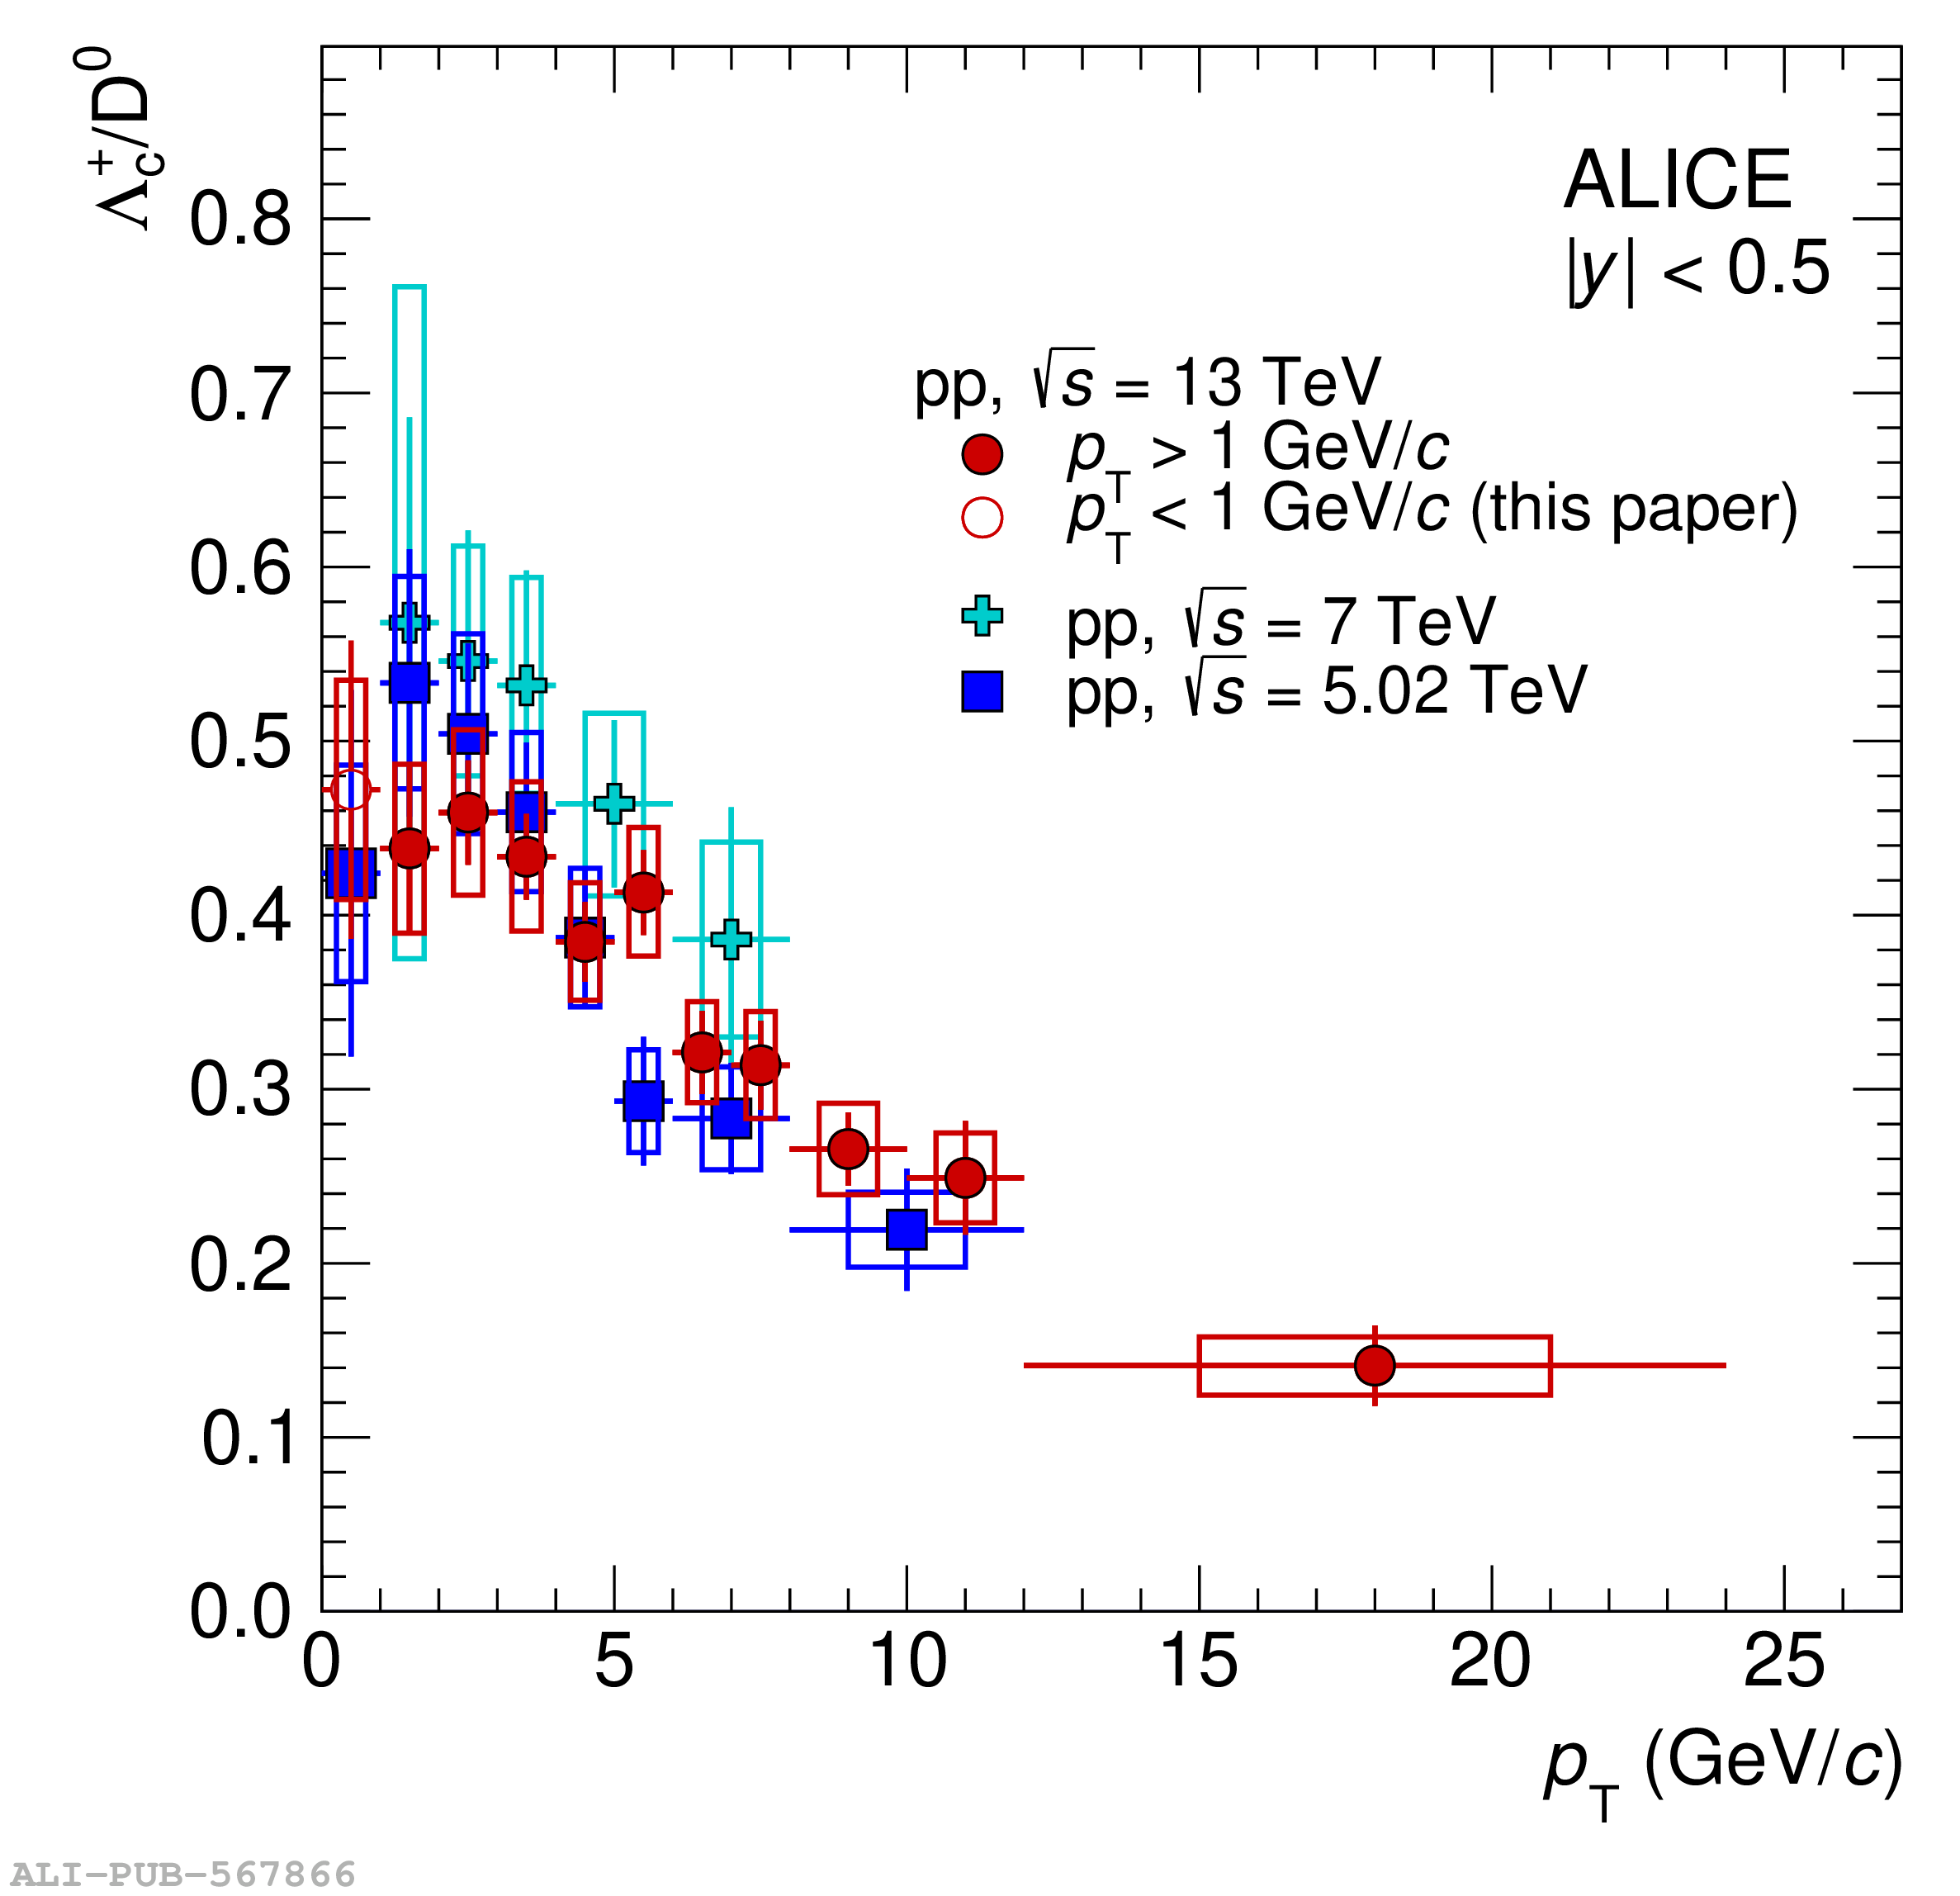 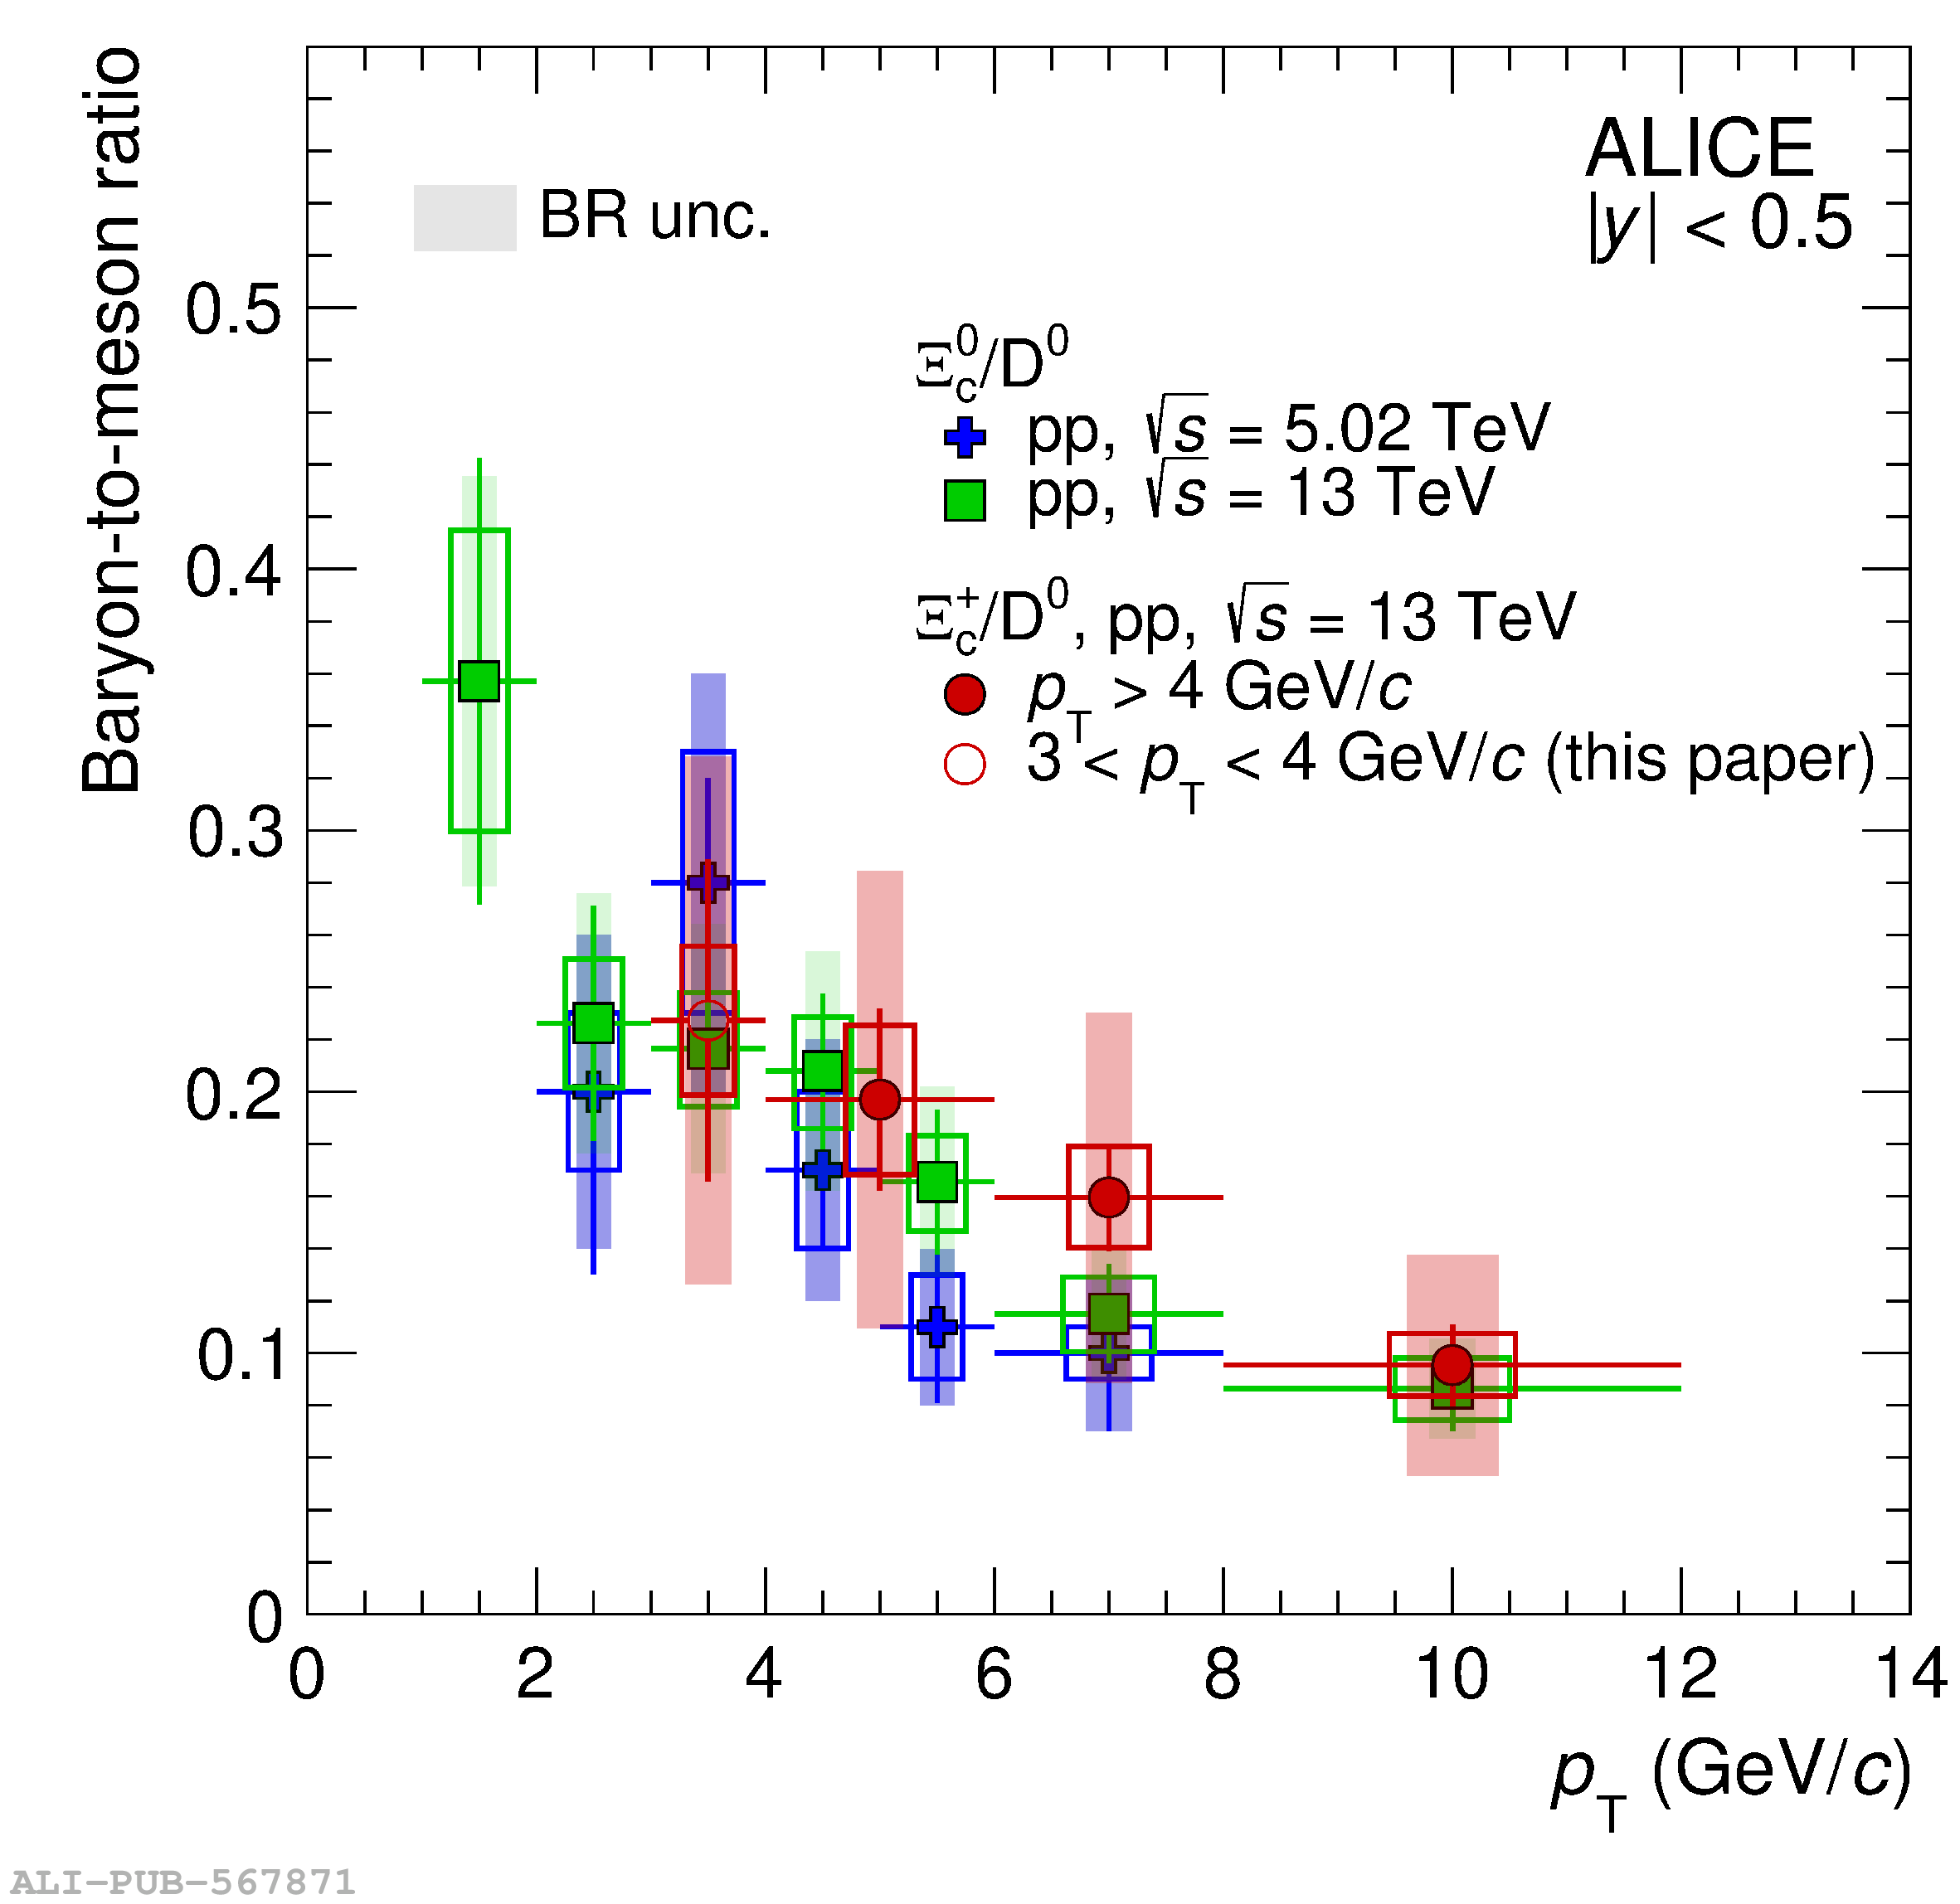 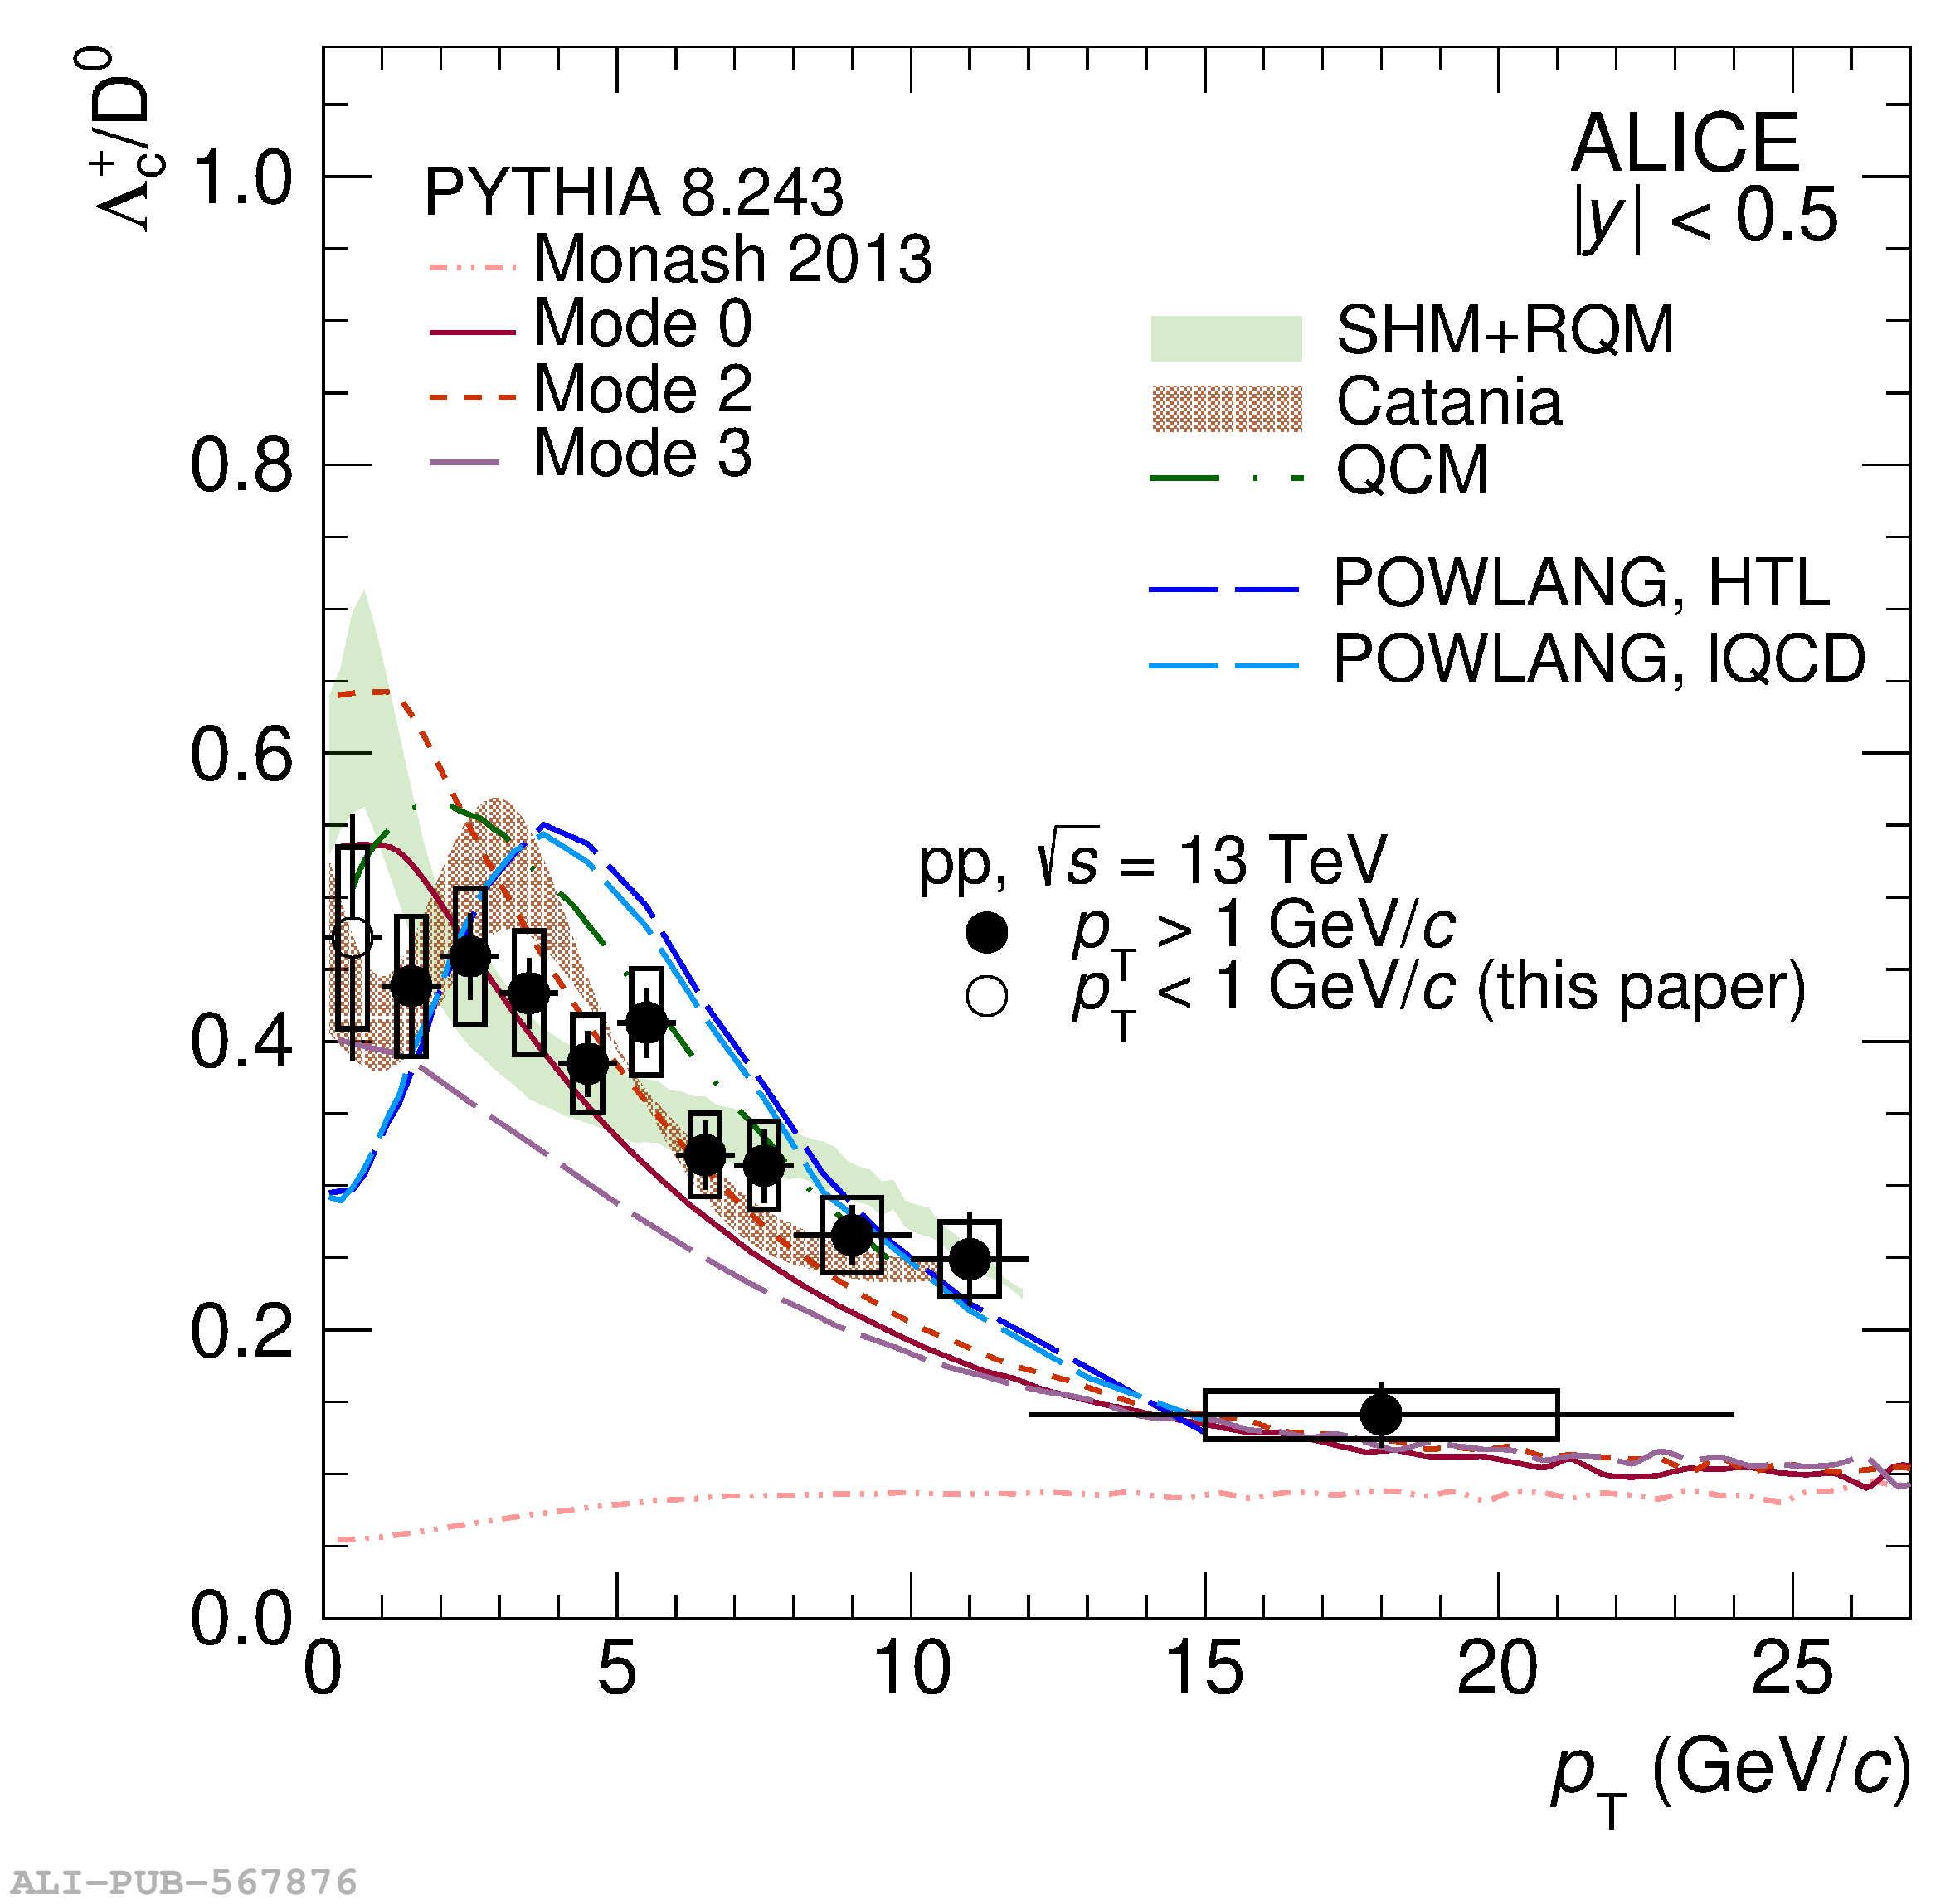 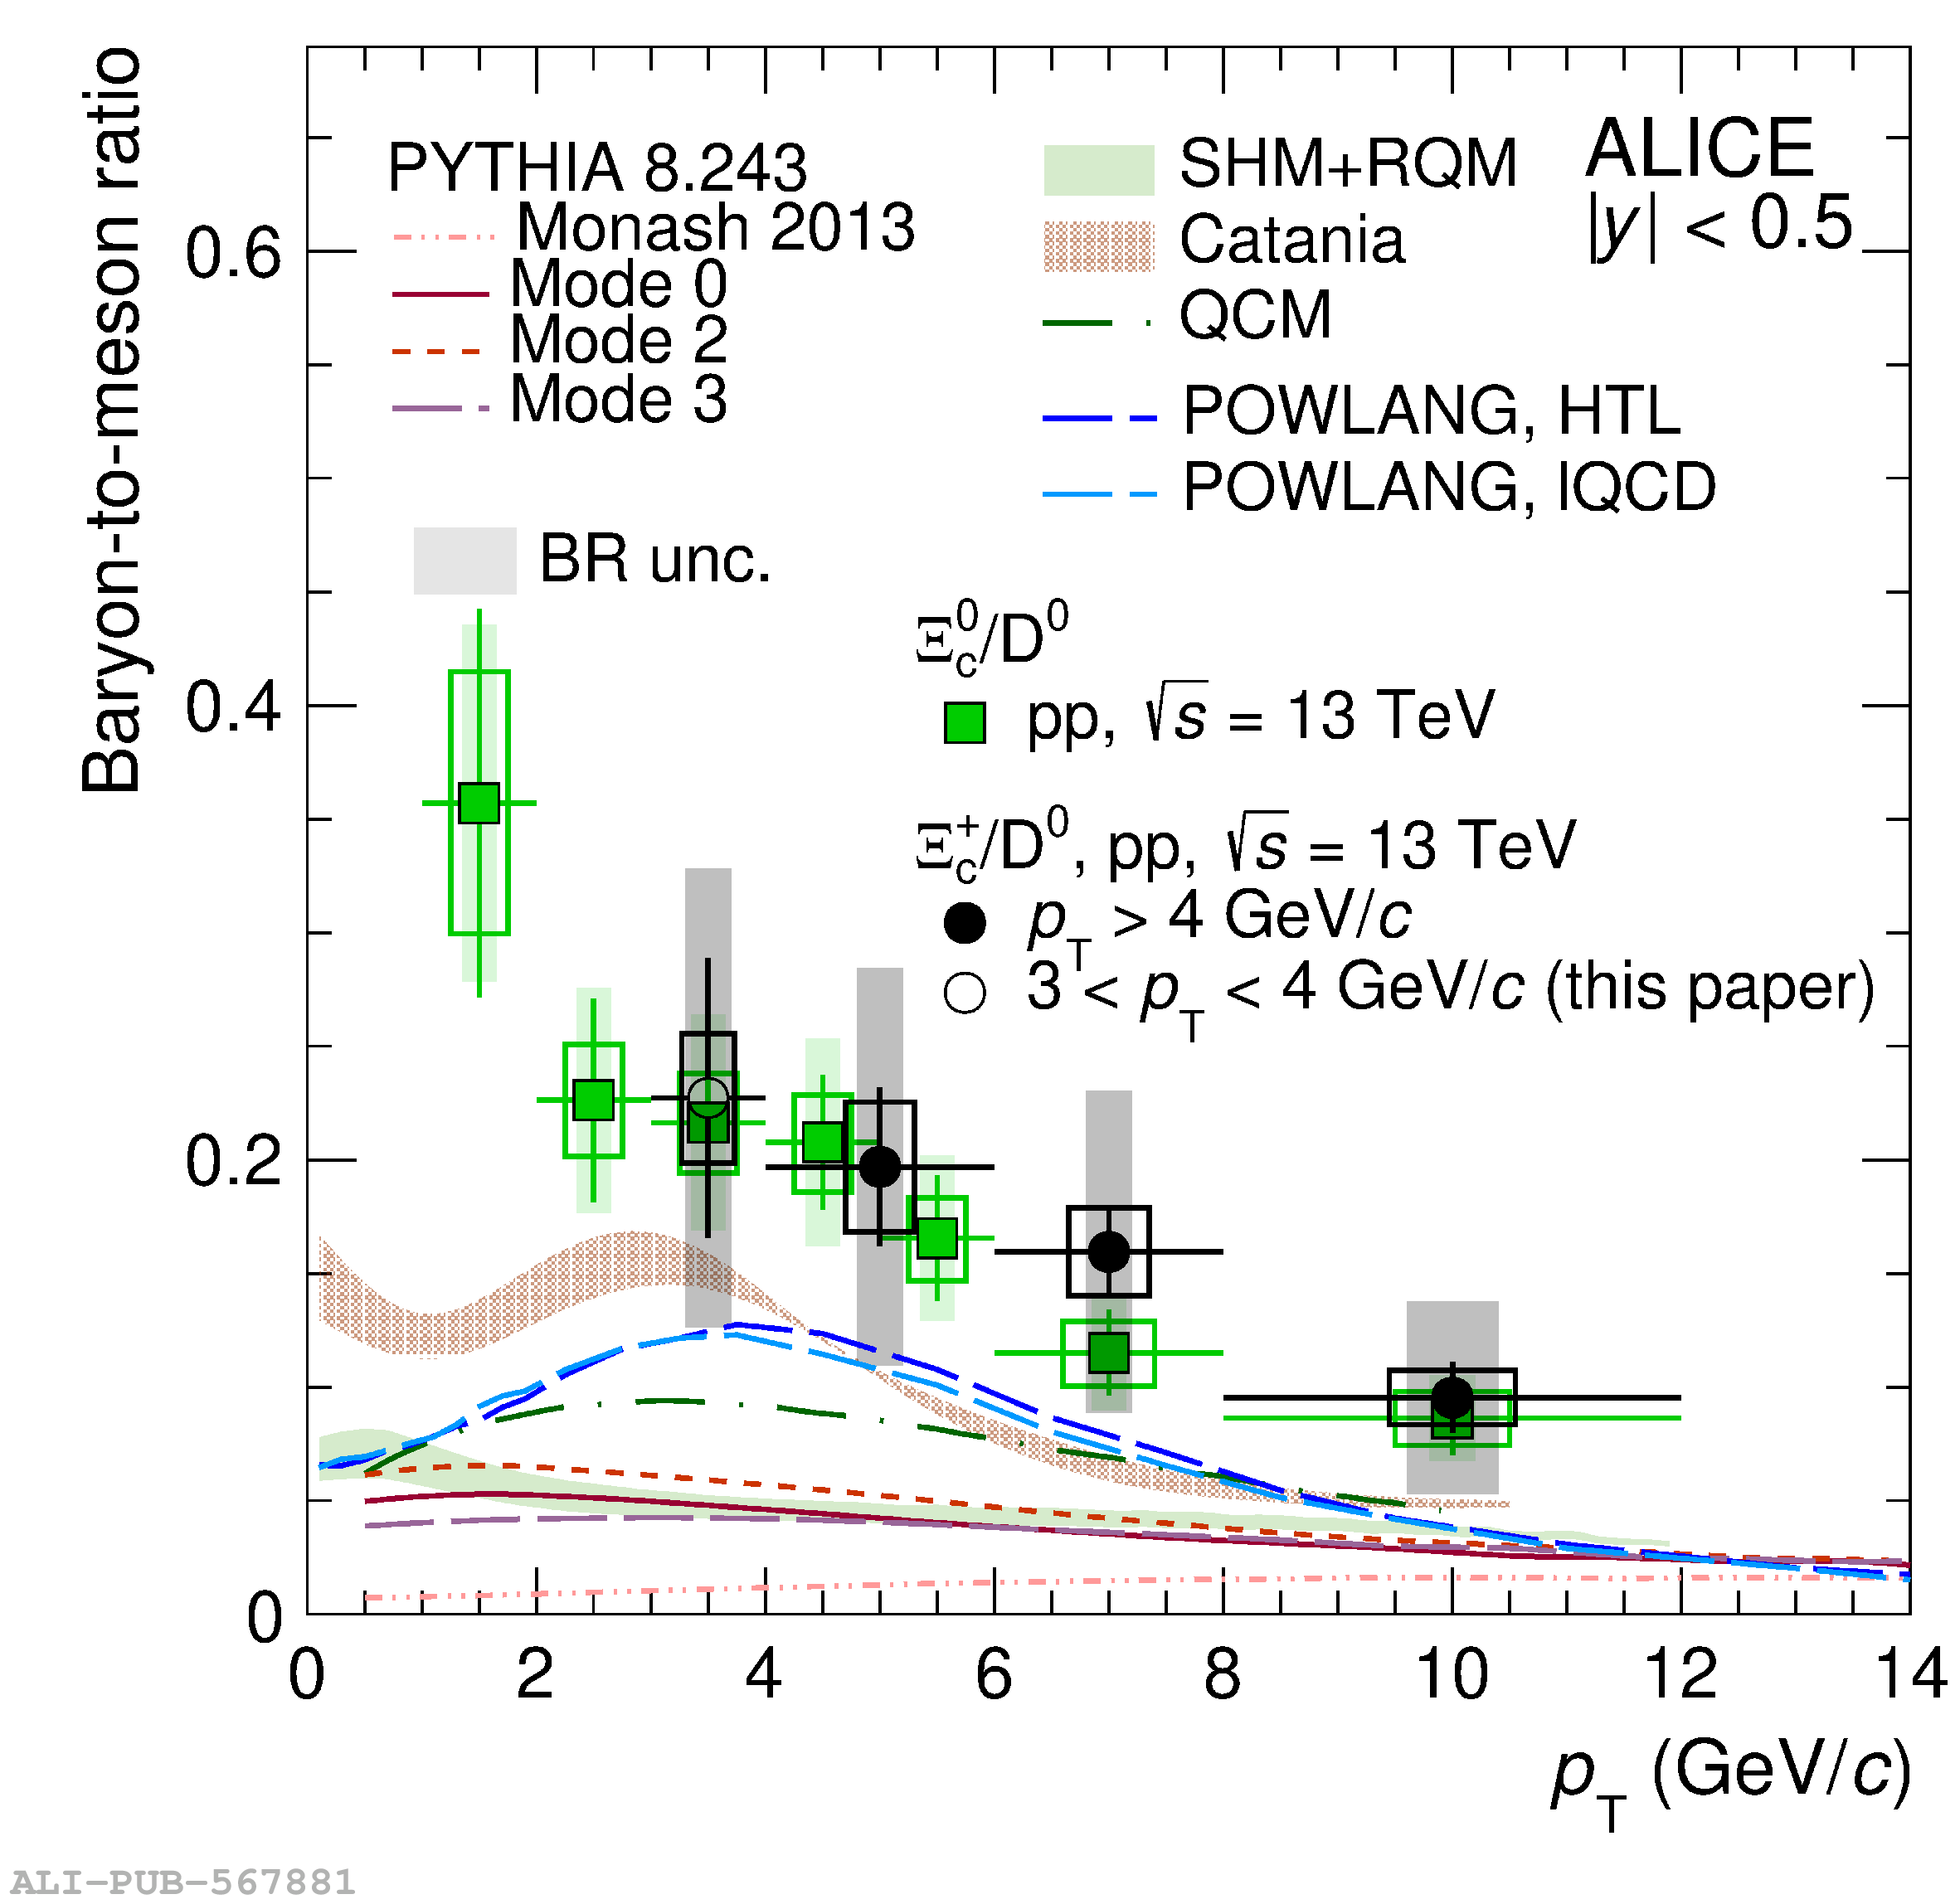 |
Figure 9
Left: ratios between prompt $\Dzero$, $\Dplus$, $\Dstar$, and $\Ds$ mesons production cross sections in \pp collisions at $\s = 13$ TeV and those in \pp collisions at $\s = 5.02$ TeV as a function of $\pt$. Right: ratios between the prompt $\Lambda_{\rm c}^+$-, $\Xi_{\rm c}^0$-, and $\Xi_{\rm c}^+$-baryon production cross sections in \pp collisions at $\s = 13$ TeV and those in \pp collisions at $\s = 5.02$ TeV as a function of $\pt$. Vertical bars (boxes) report the statistical (systematic) uncertainties. | 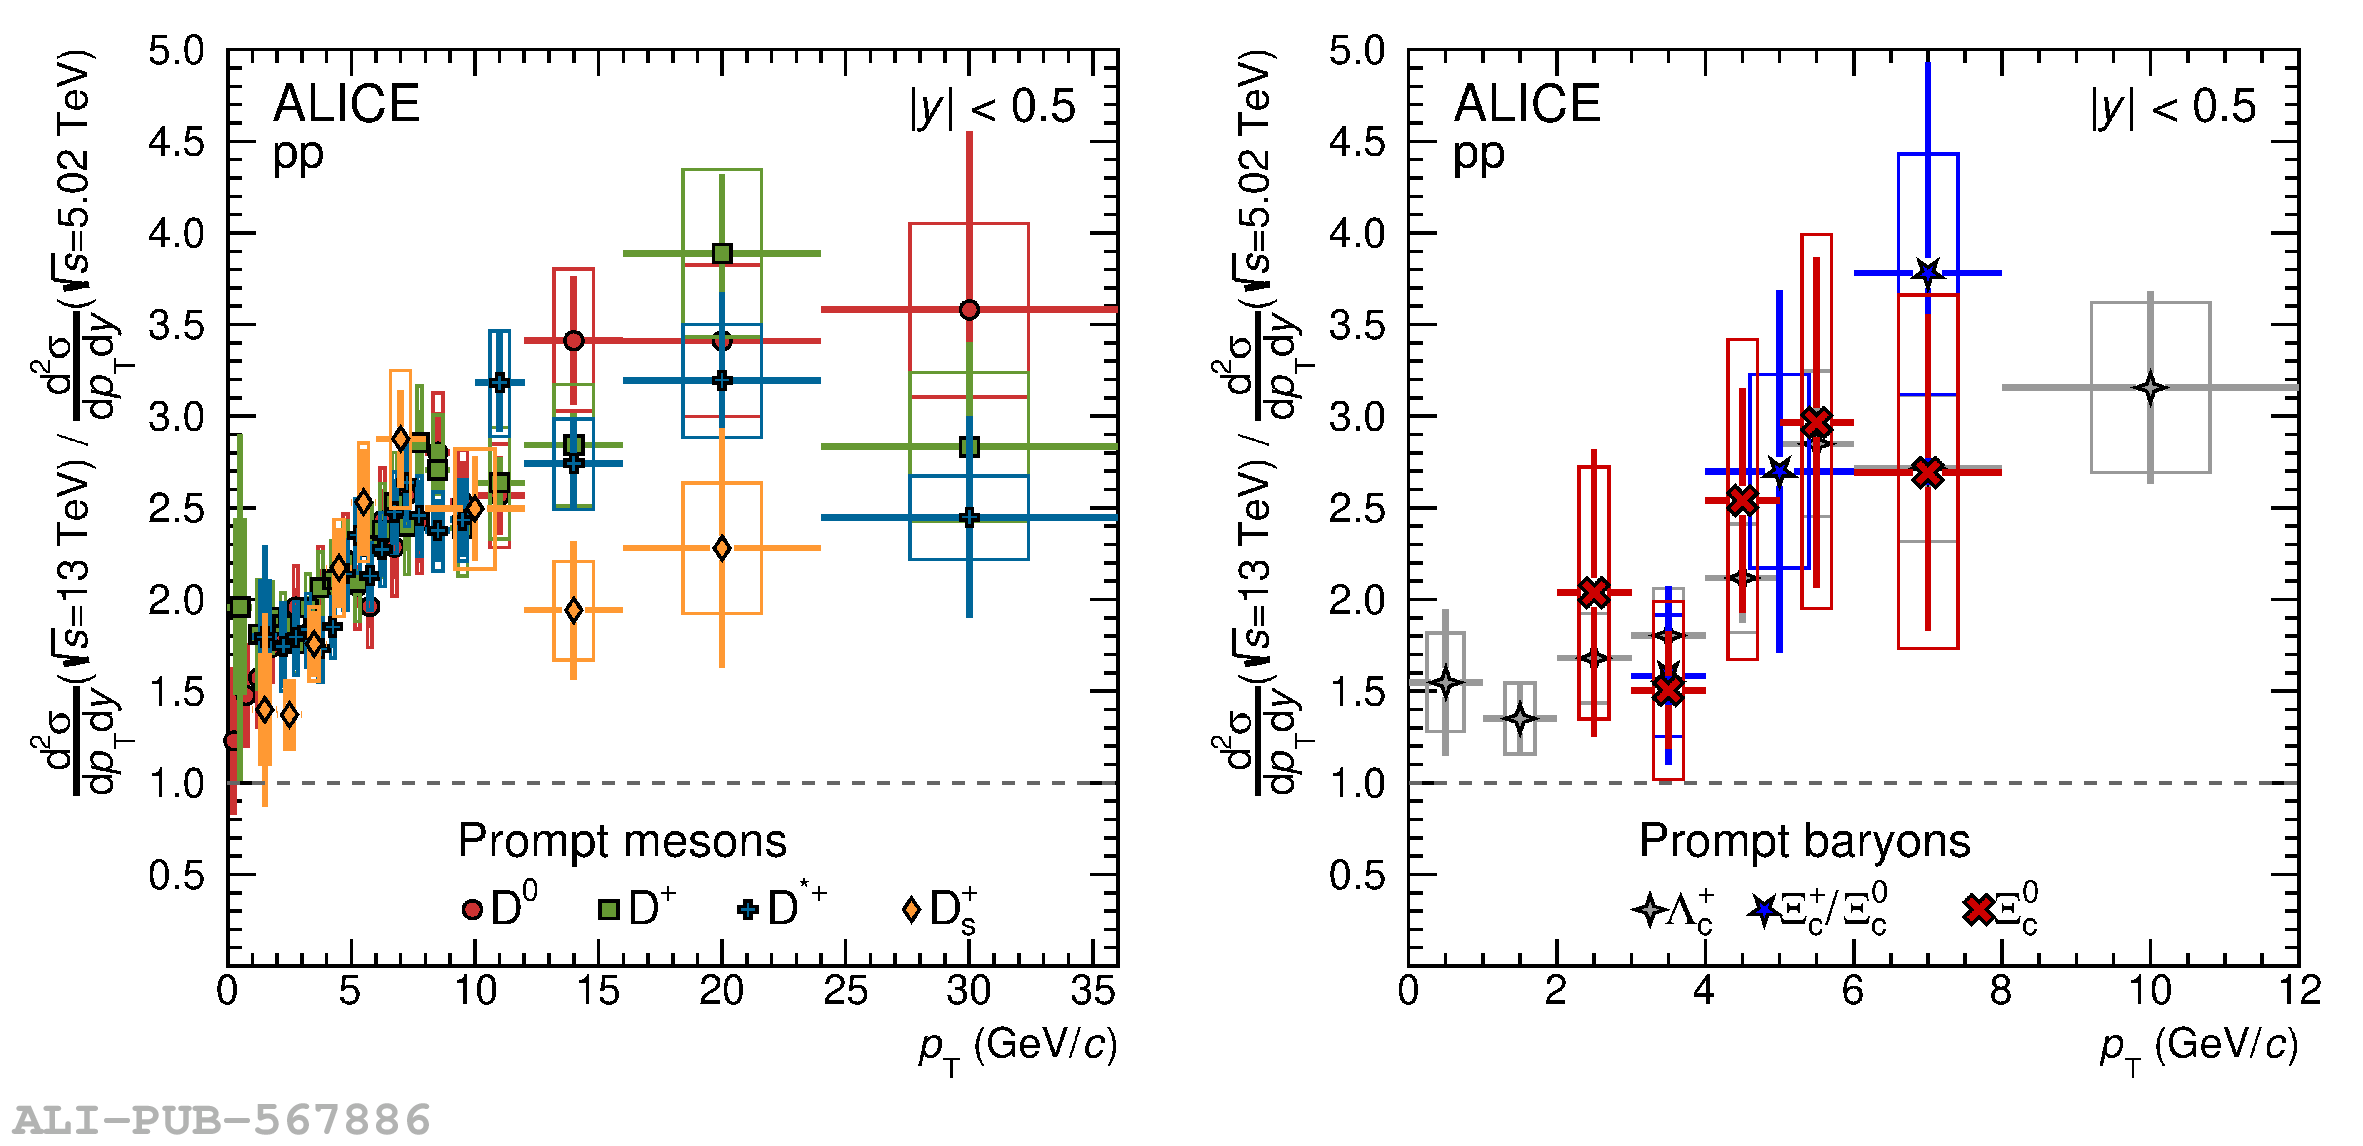 |
Figure 10
Ratios of D-meson production cross sections per unit of rapidity at midrapidity ($|y| < 0.5$) to those measured by LHCb in three rapidity intervals: $2 < y < 2.5$ (top-left panel), $3 < y < 3.5$ (top-right panel), and $4 < y < 4.5$ (bottom-left panel), as a function of $\pt$. Statistical (systematic) uncertainties are reported as vertical bars (boxes). | 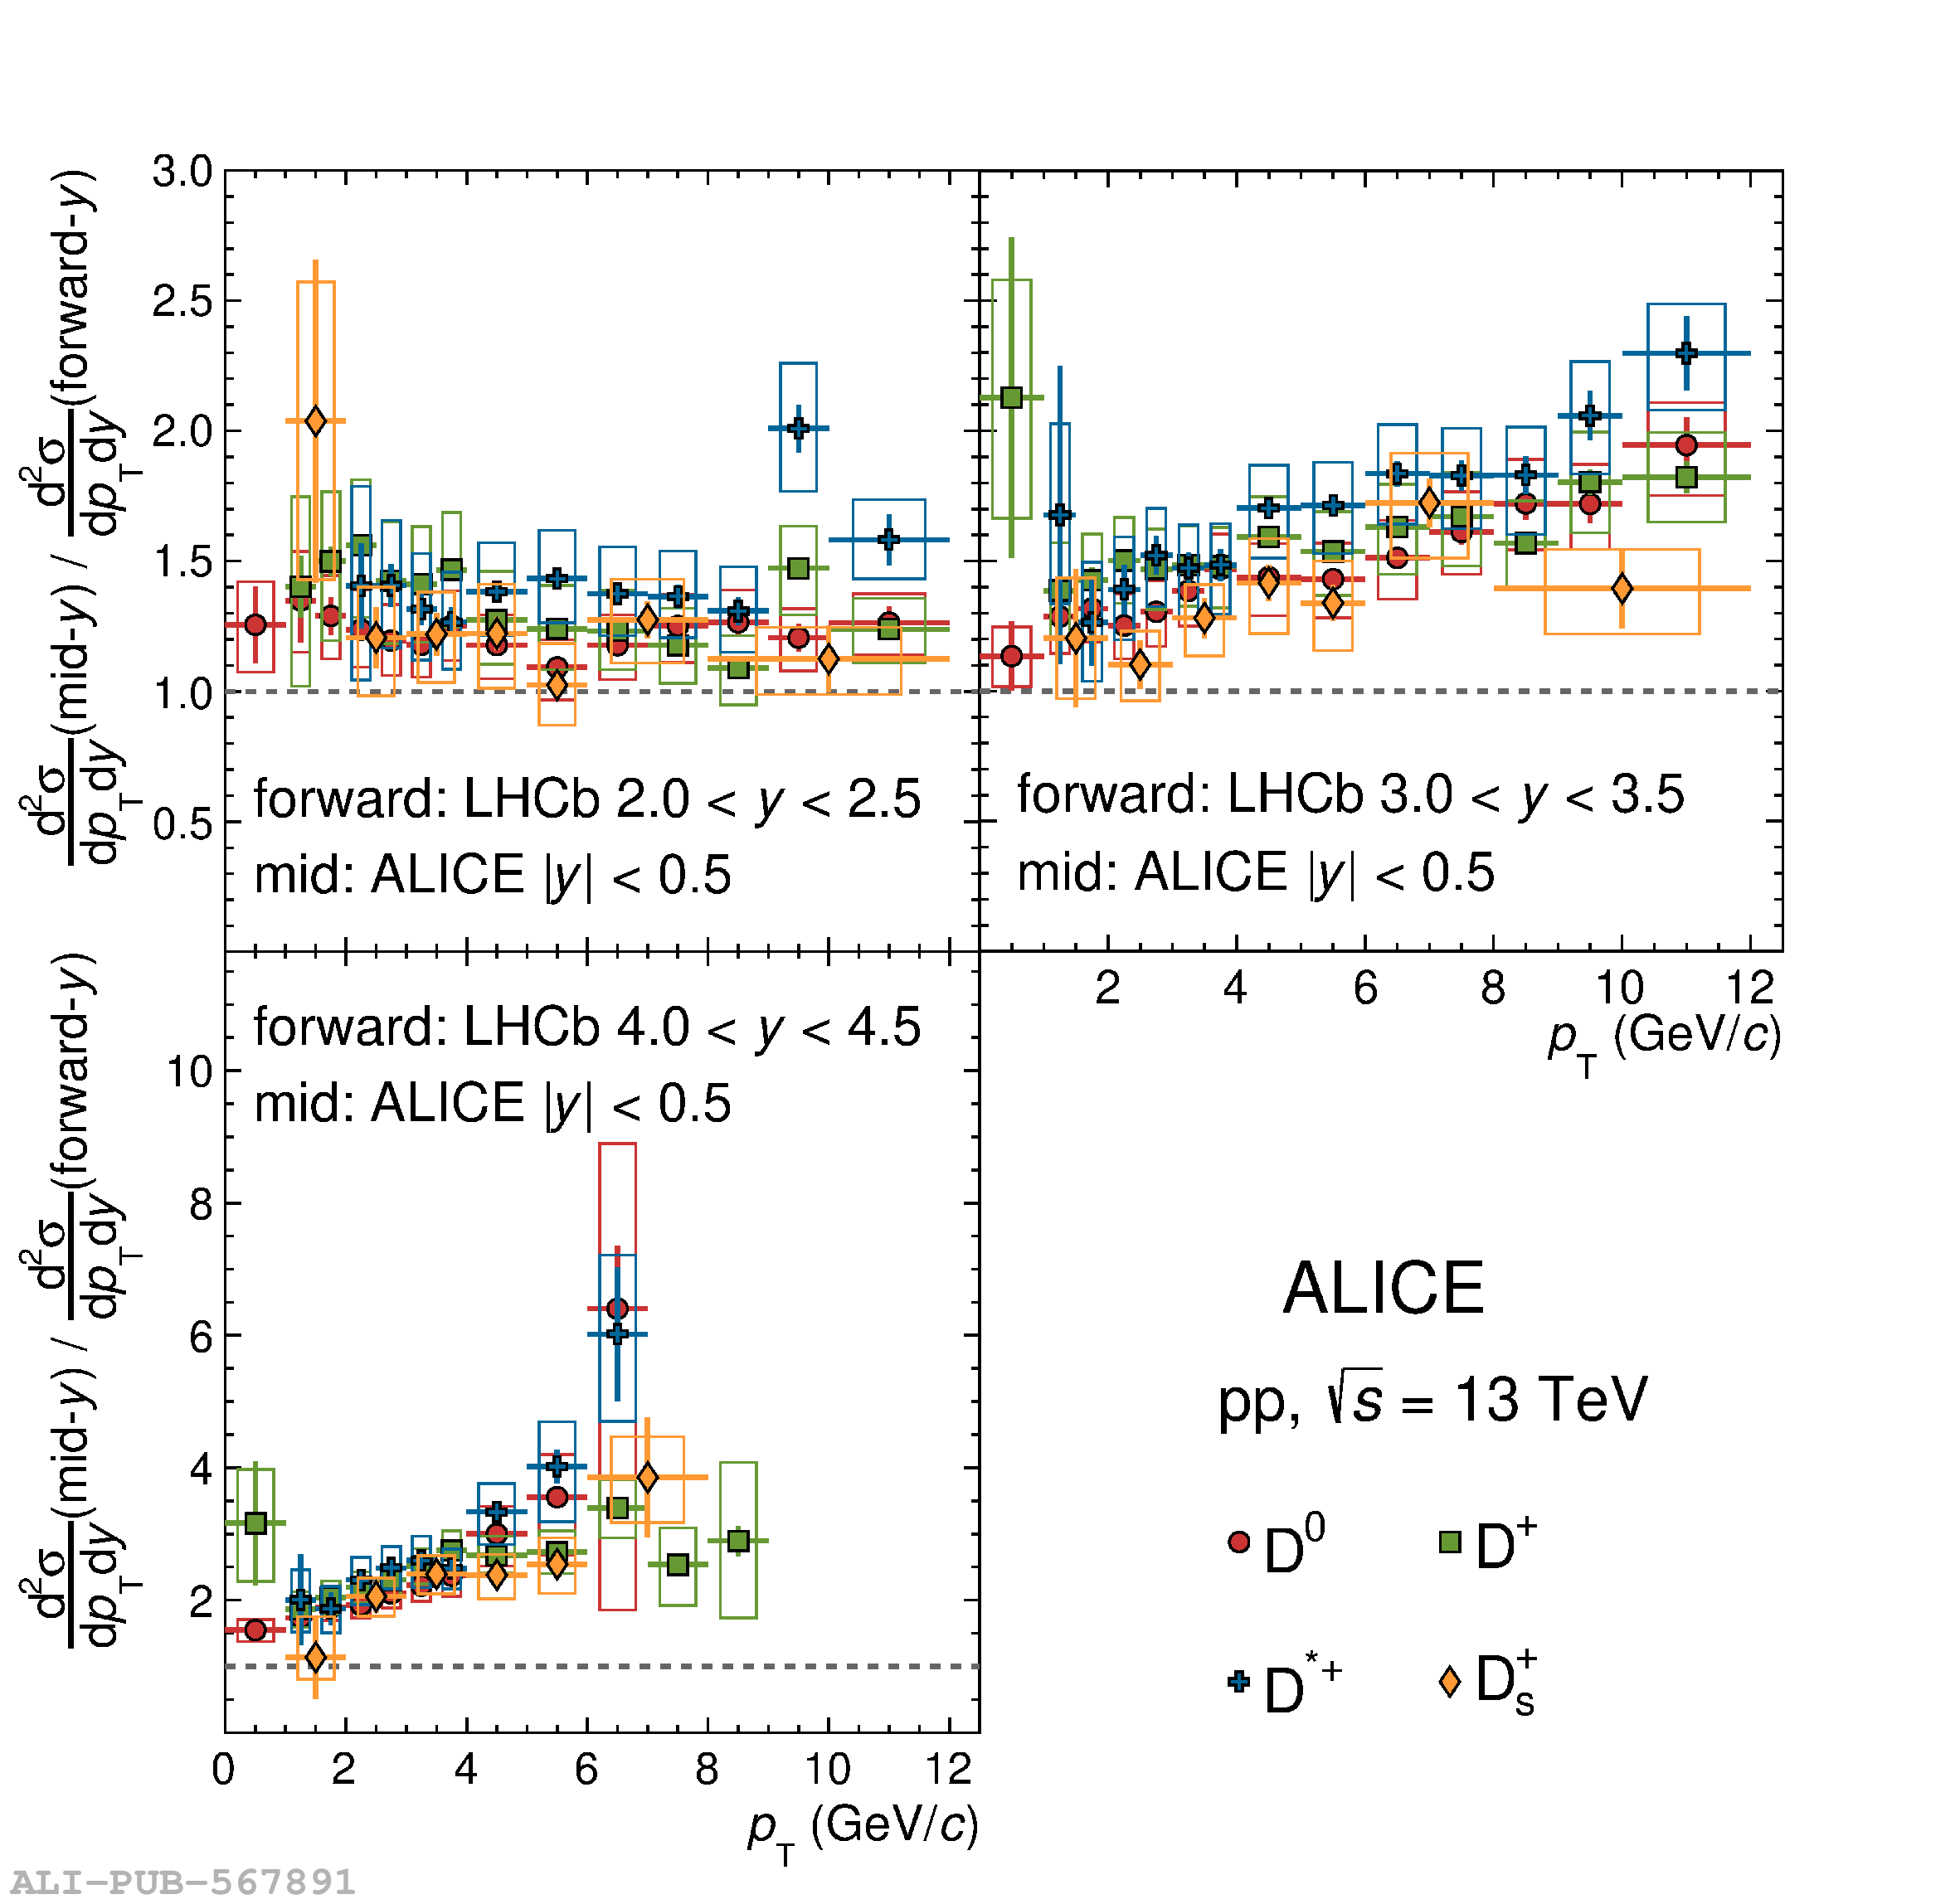 |
Figure 11
Ratio between $\pt$-differential cross sections of prompt $\Dzero$ mesons at midrapidity ($|y|<0.5$) in pp collisions at $\s=5.02$ TeV and $13$ TeV and those at forward rapidity in three rapidity intervals (left: $2< y< 2.5$, middle: $3< y< 3.5$, right: $4< y< 4.5$) measured by the LHCb Collaboration. The double ratios $\rho$, defined in Eq. 2, are shown in the middle and bottom rows together with FONLL calculations employing the CTEQ6.6 (middle row) and NNPDF30 (bottom row) PDF sets. The statistical (systematic) uncertainties are shown as vertical bars (boxes). | 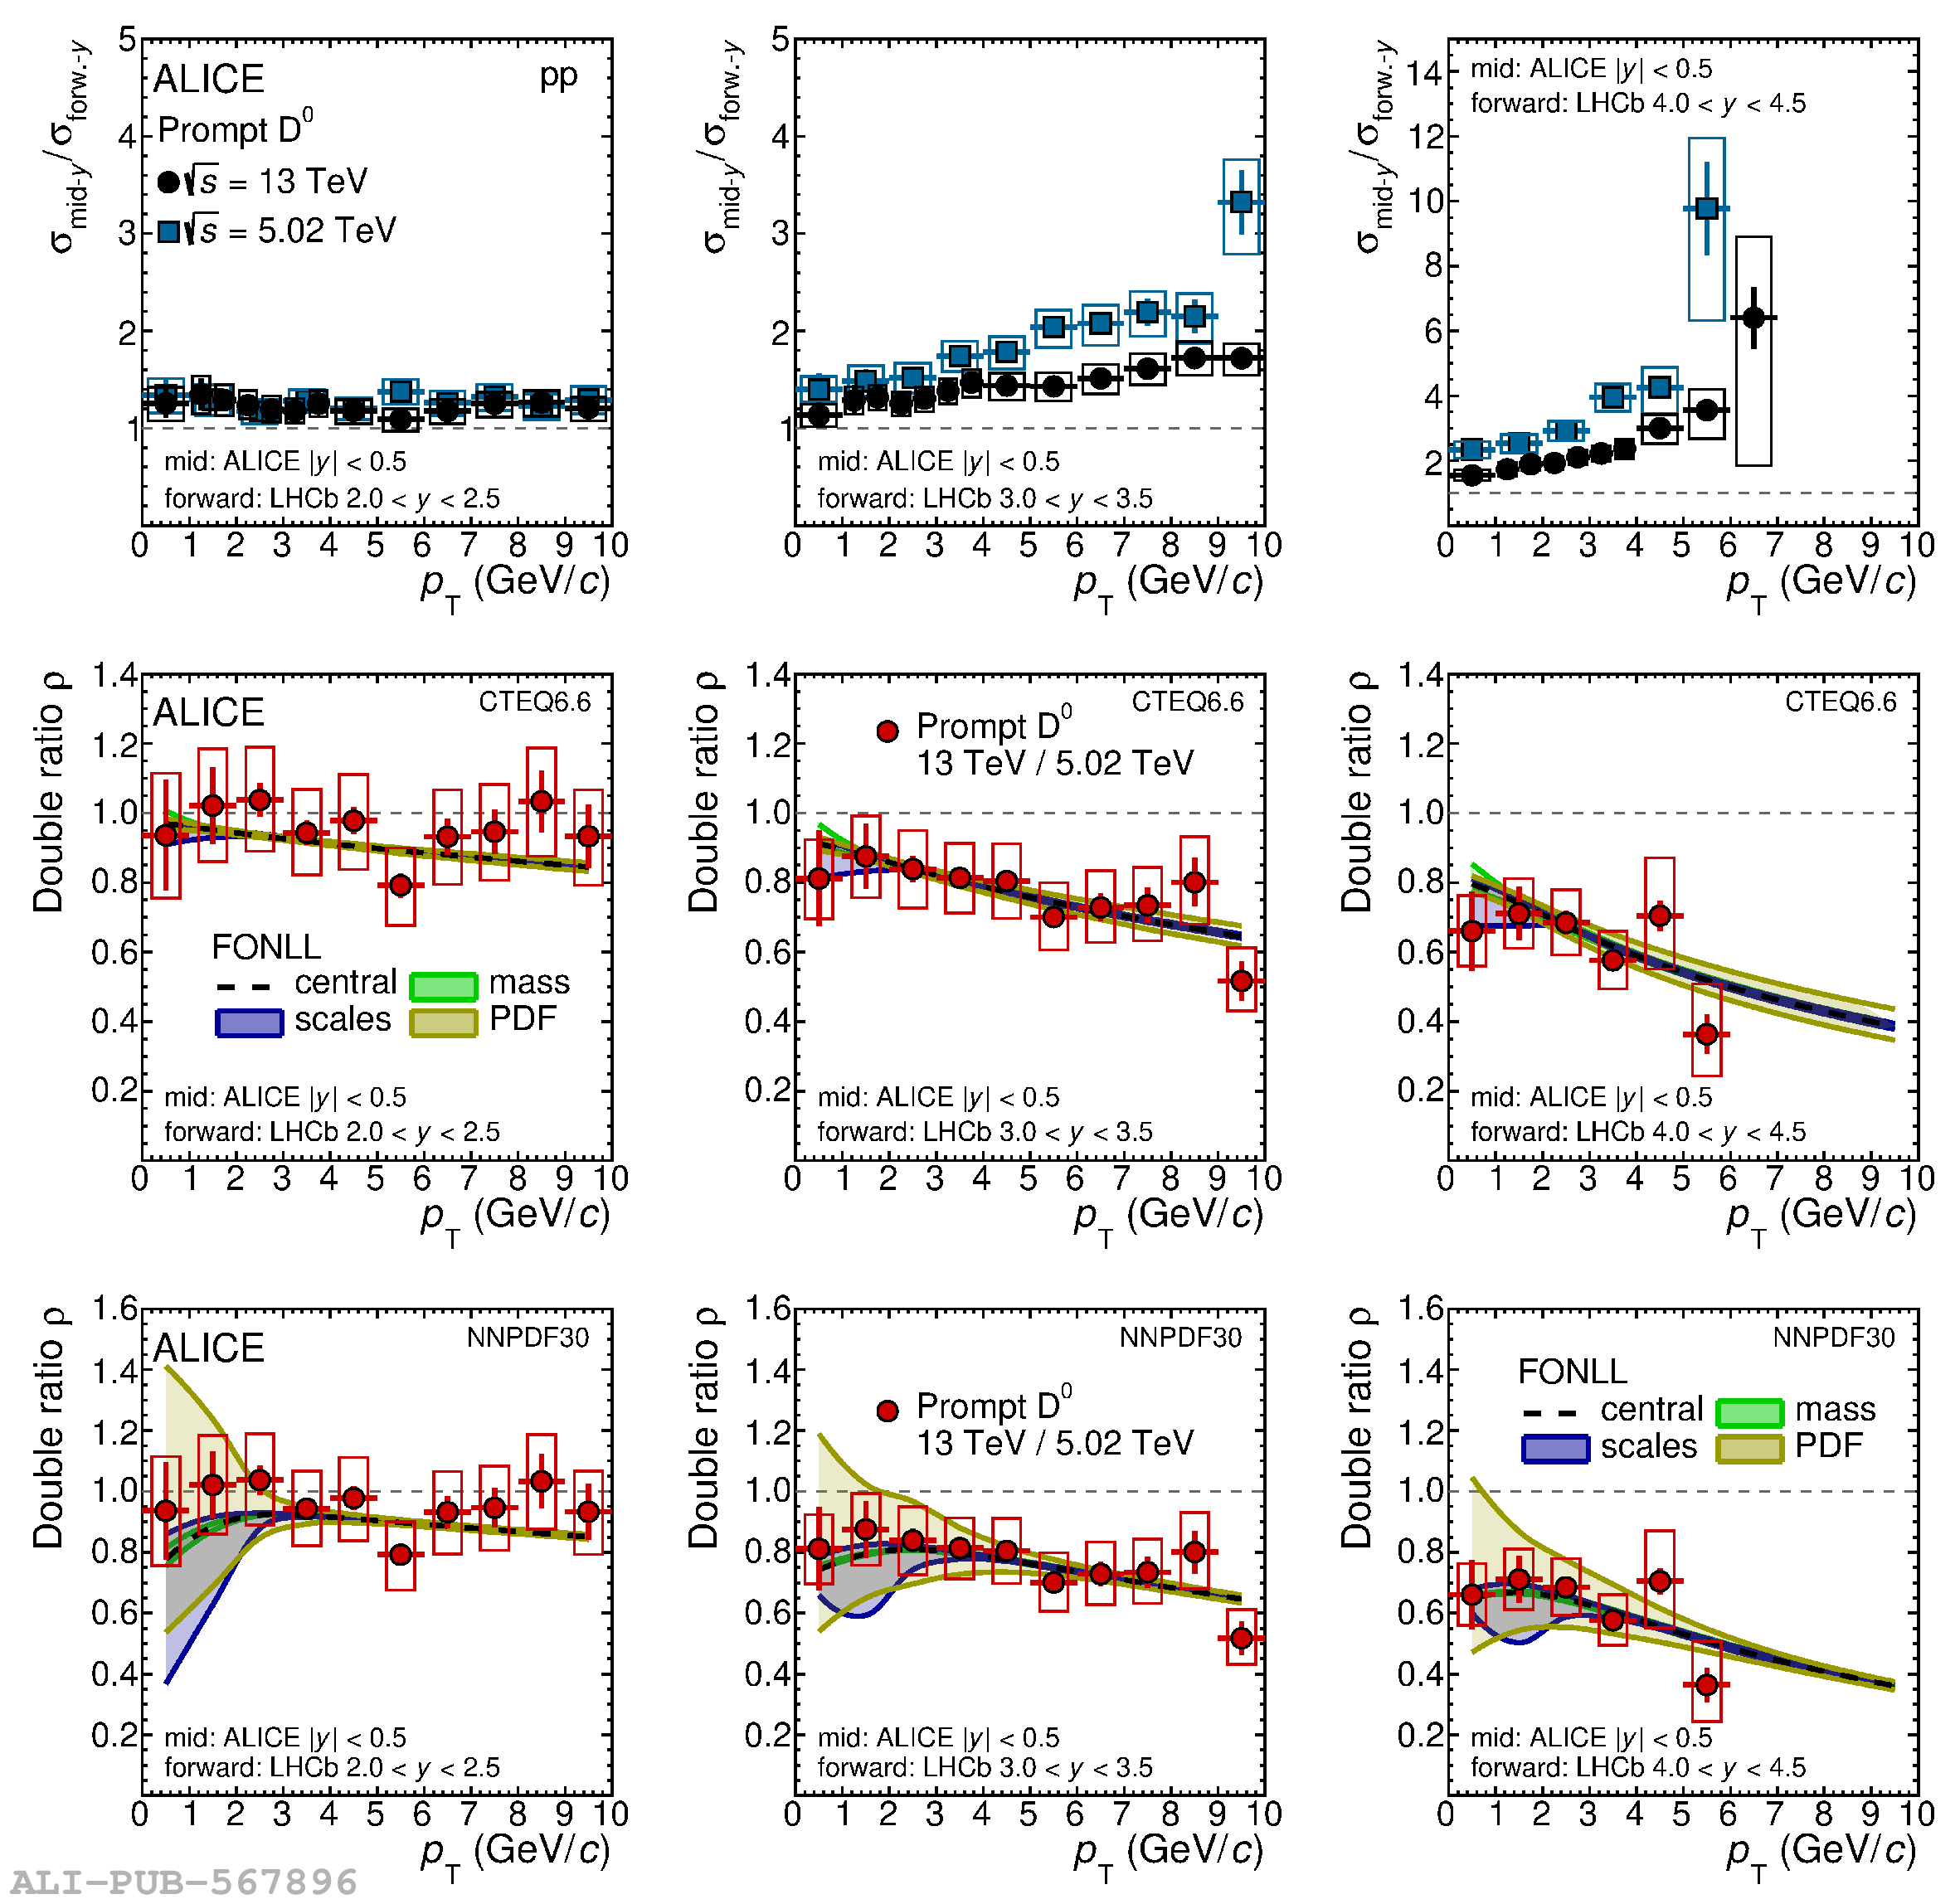 |
Figure 12
Charm-quark fragmentation-fraction ratio $f_{\rm s}/(f_{\rm u} + f_{\rm d})$ (red) compared with previous measurements performed by the ALICE , H1 , ZEUS , and ATLAS Collaborations, and to the average of LEP measurements . The total experimental uncertainties (bars) and the theoretical uncertainties (shaded boxes) are shown. | 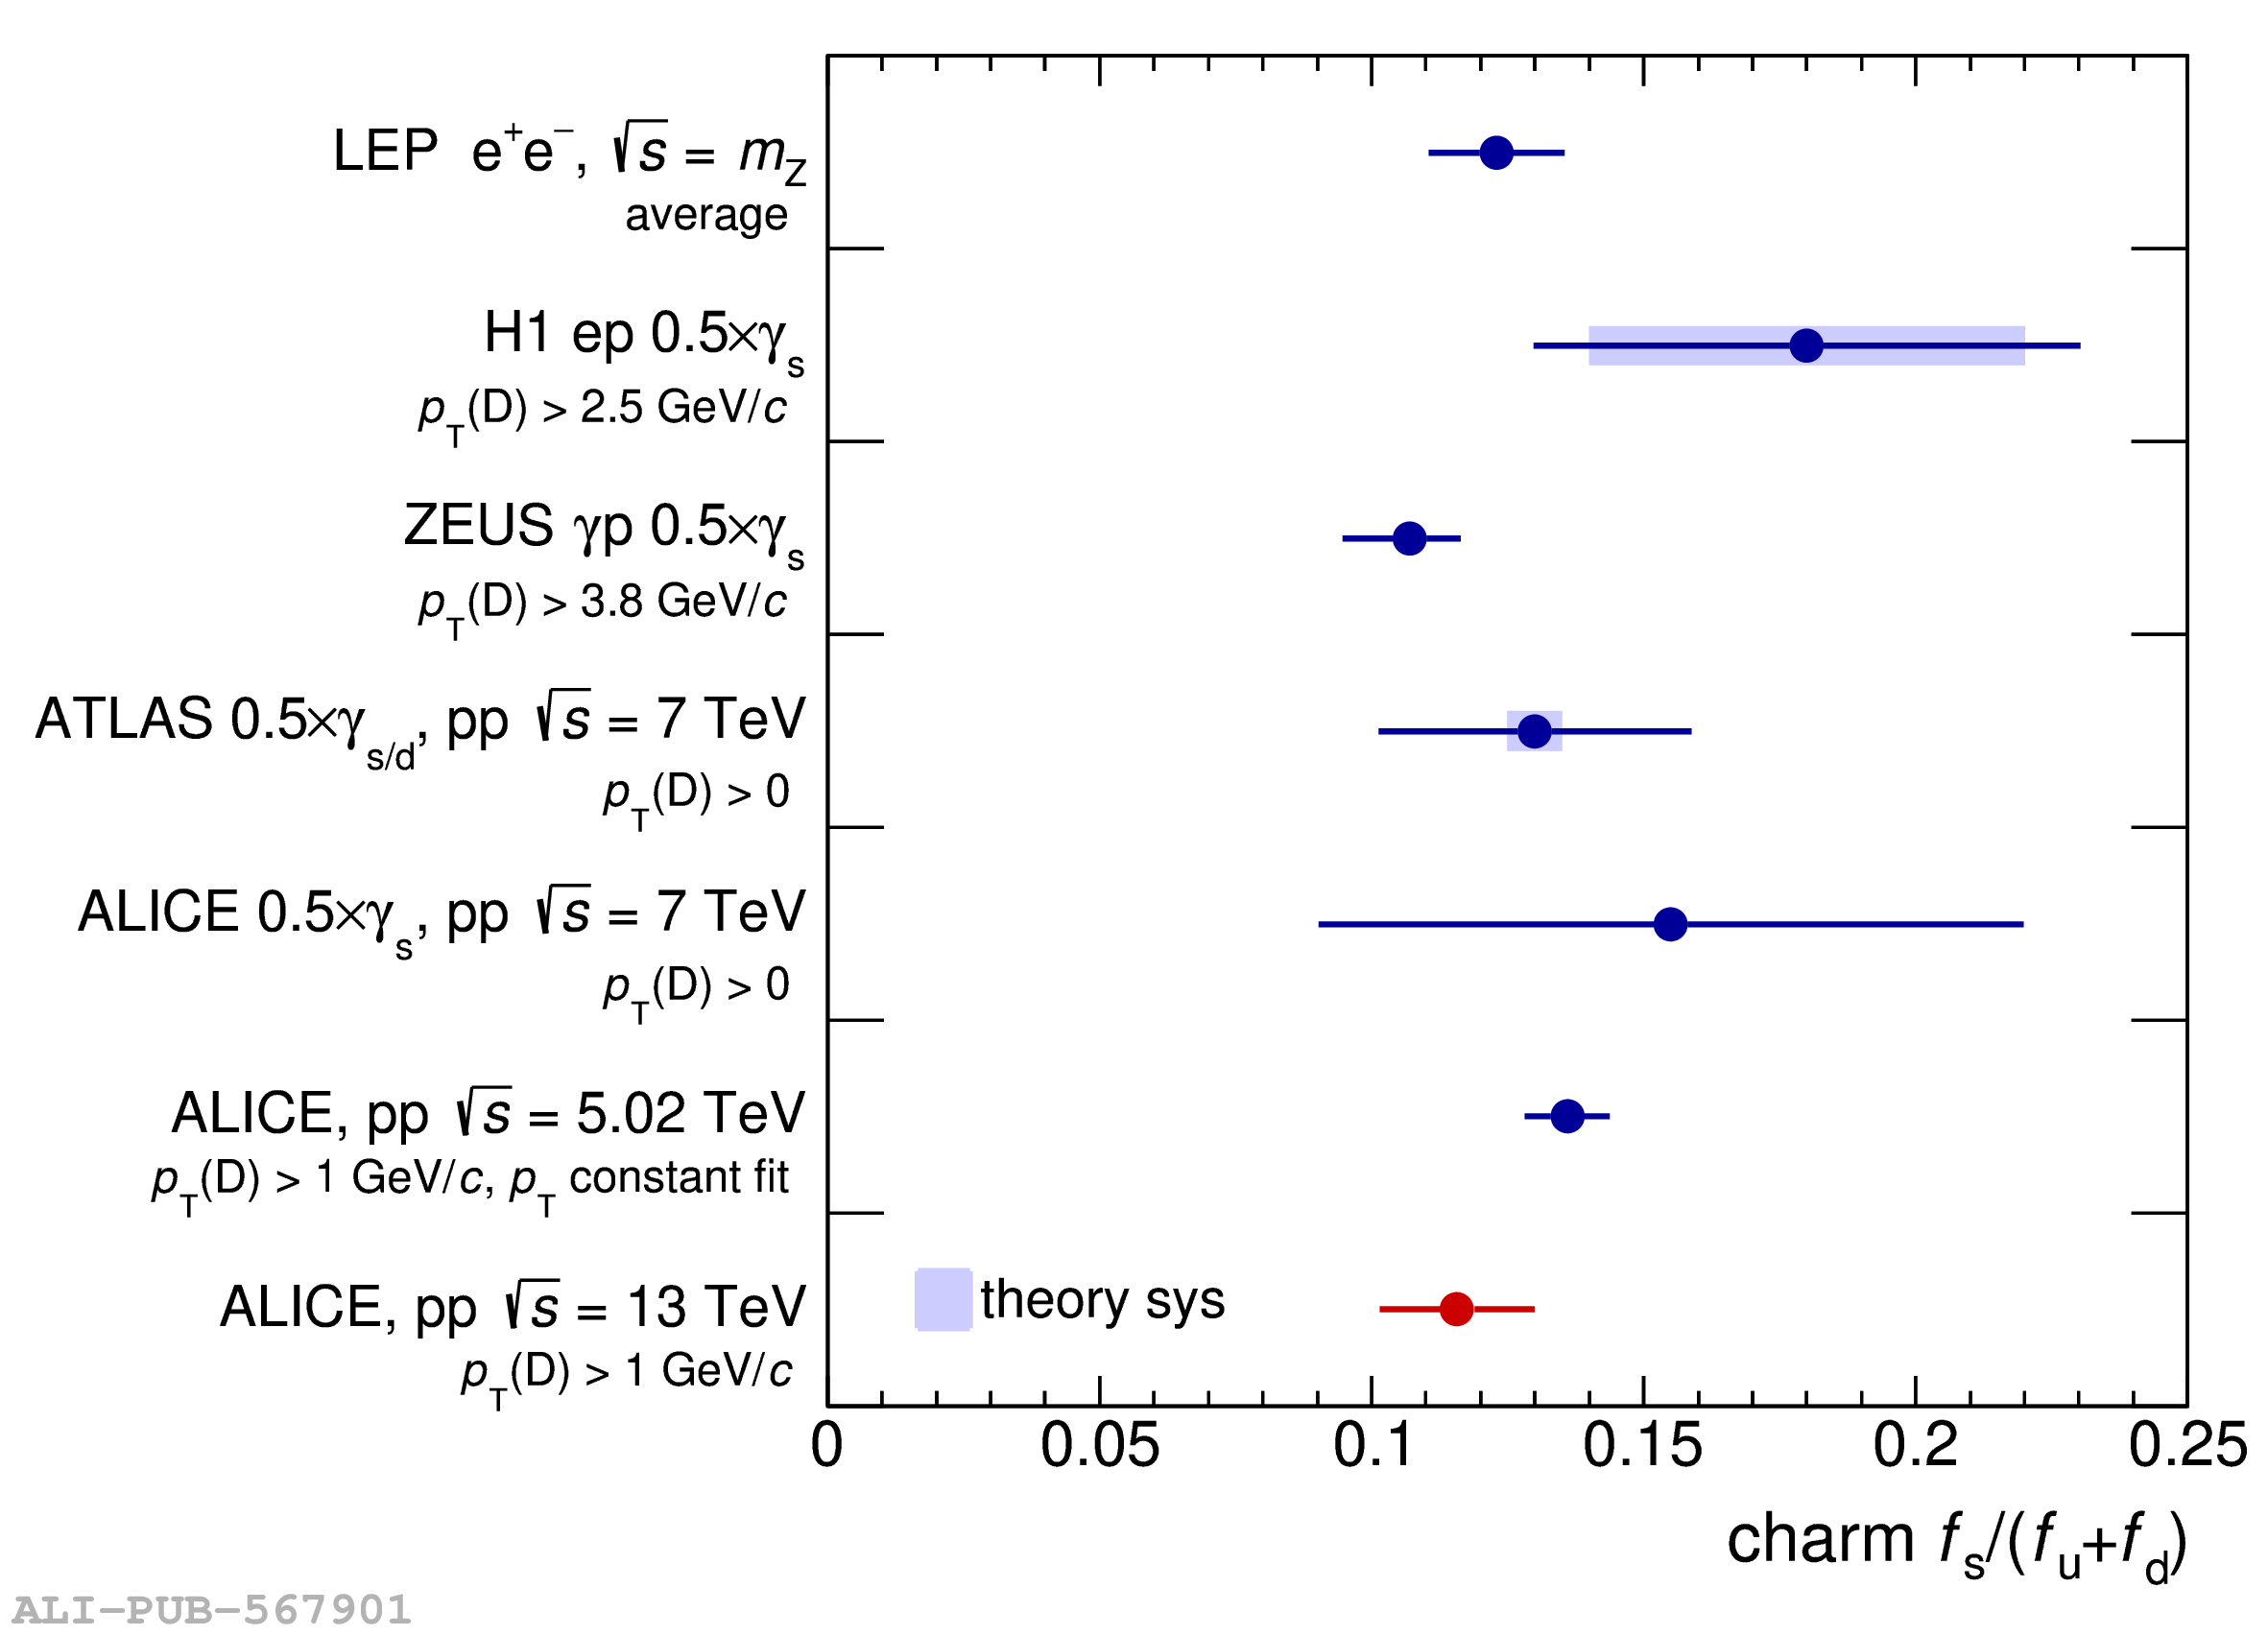 |
Figure 13
Left: charm-quark fragmentation fractions at midrapidity $(|y|<0.5)$ in pp collisions at $\s=5.02$ TeV and $\s=13$ TeV compared with results in ${\rm e^+e^-}$ and ep collisions. The fragmentation fractions $f(\rm c\to h_c)$ of $J/\psi$ mesons are multiplied by a factor 20 for better visibility. Right: ${\rm c\overline{c}}$ production cross section per unit of rapidity at midrapidity ($|y|<0.5$) in \pp collisions as a function of $\s$. The measurements are compared with predictions from FONLL and NNLO calculations. The statistical and systematic uncertainties are reported as vertical bars and boxes, respectively. | 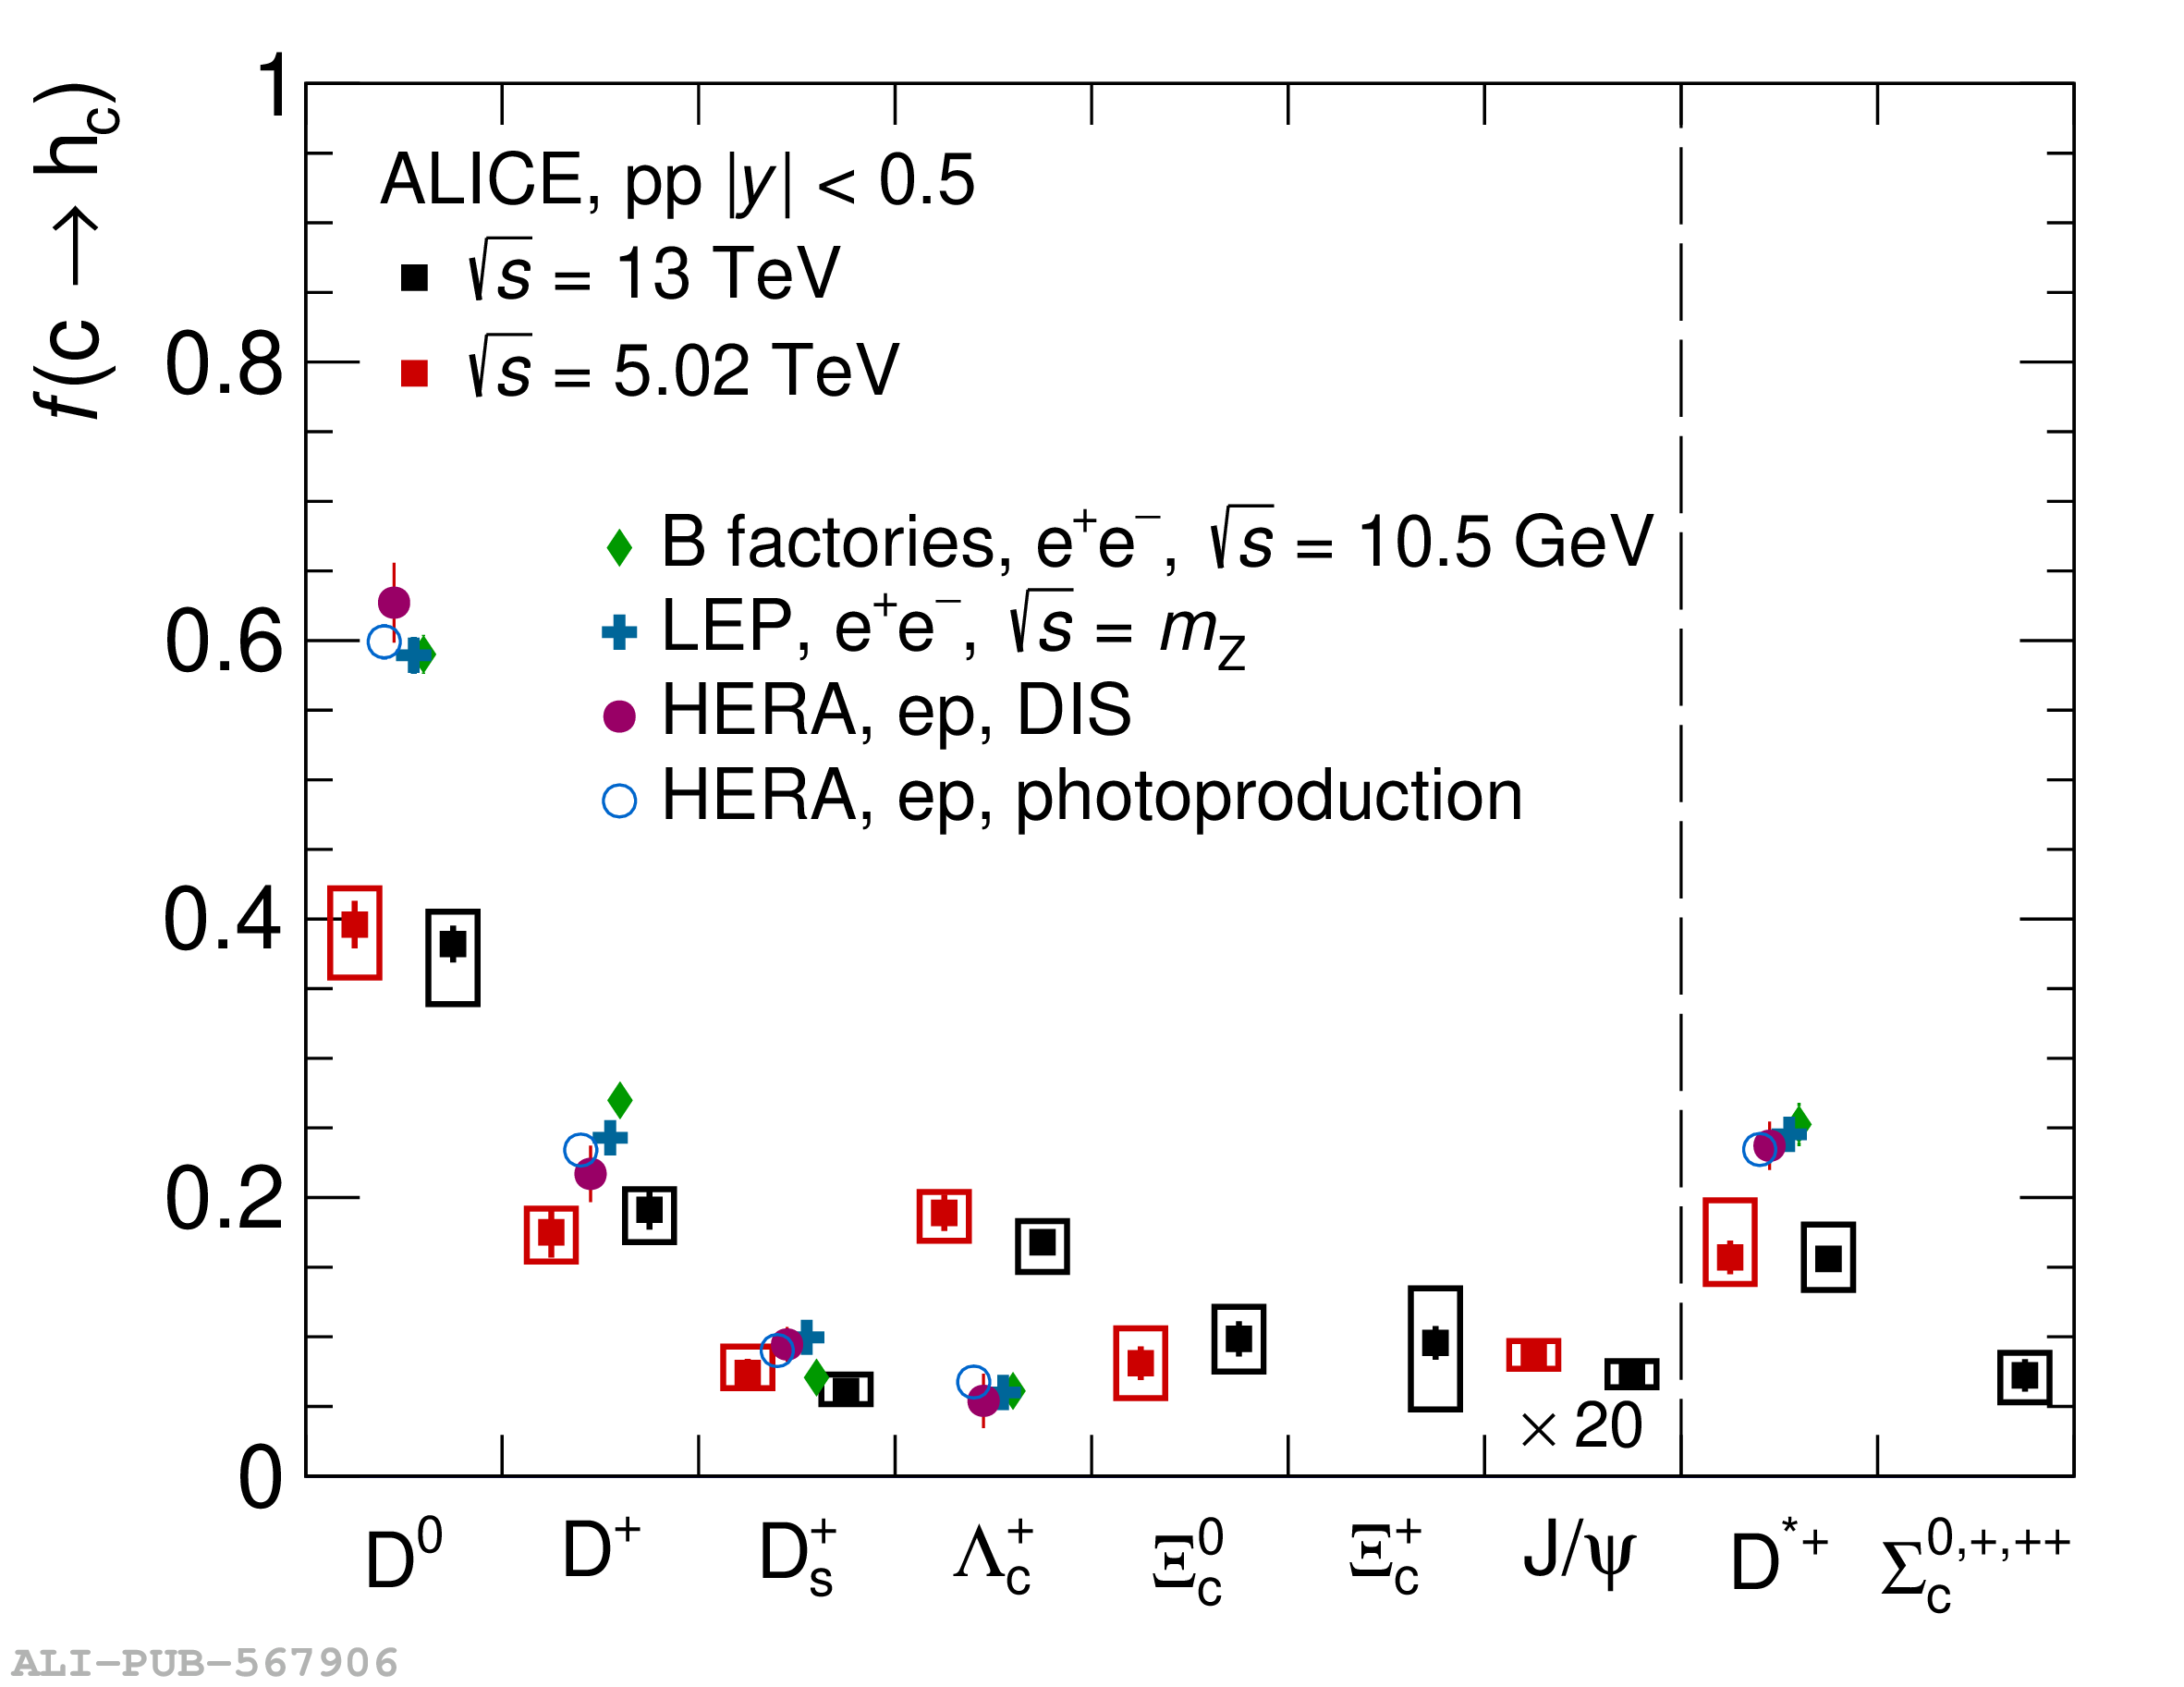 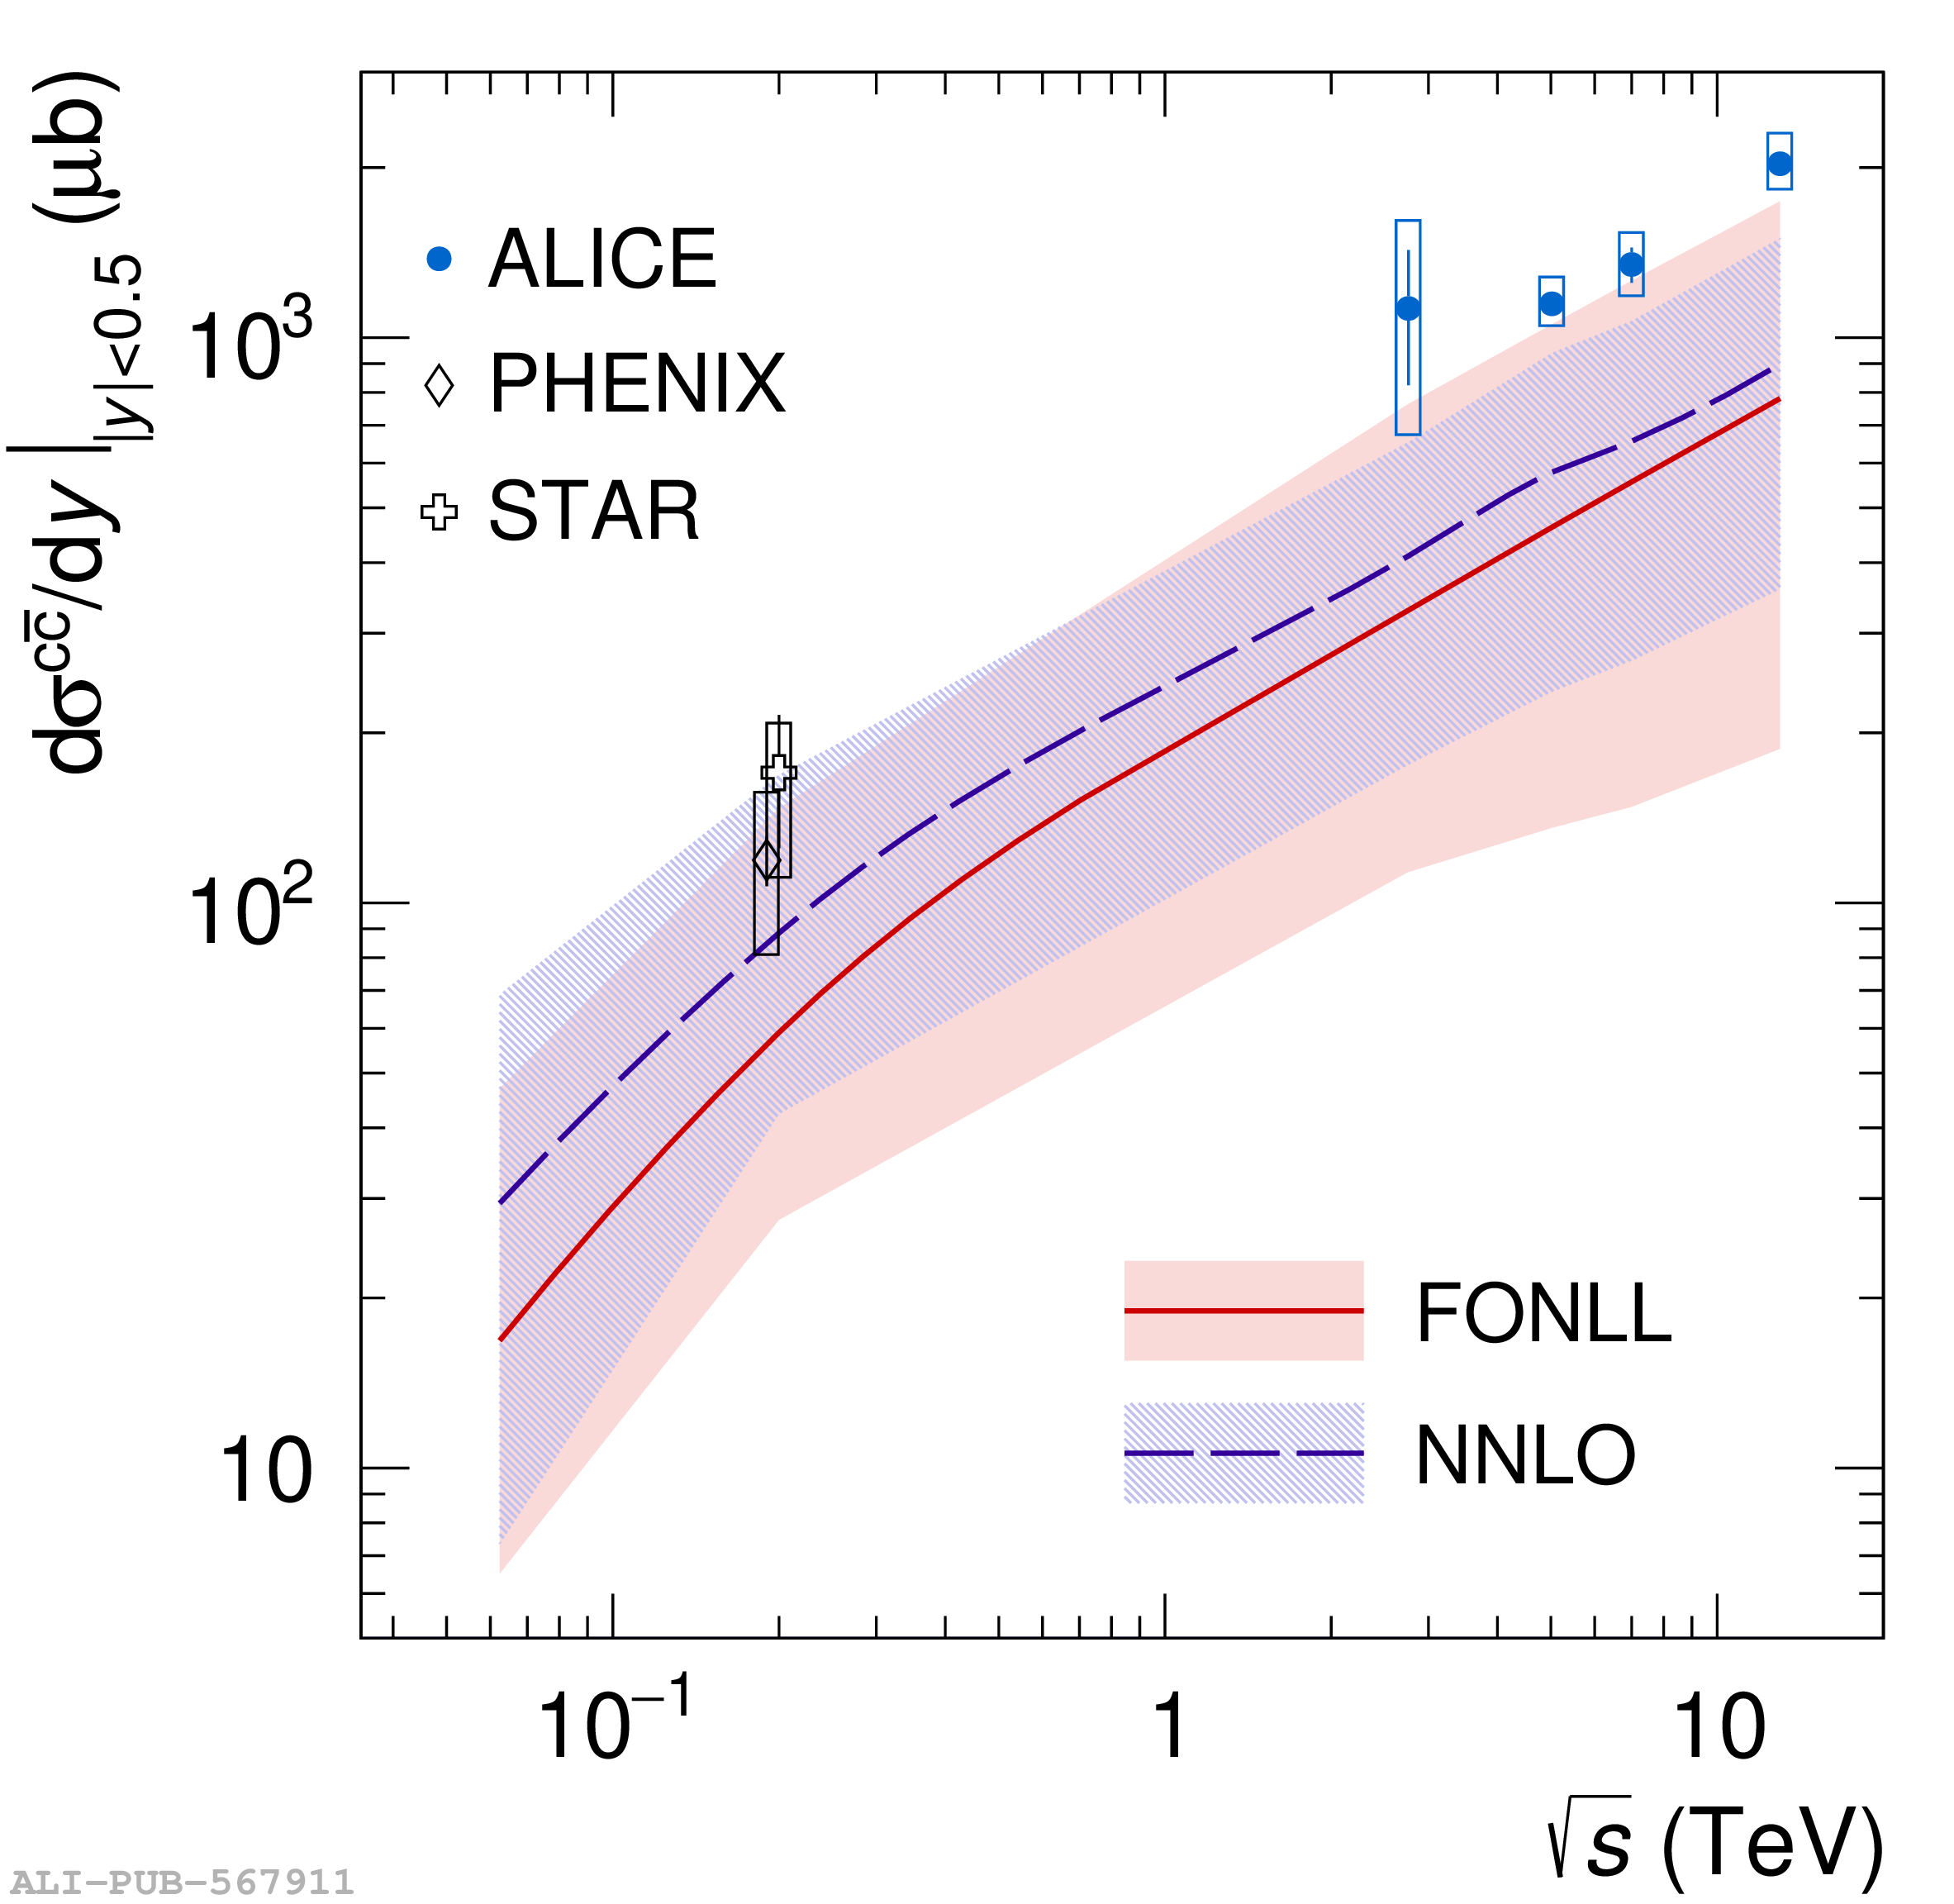 |